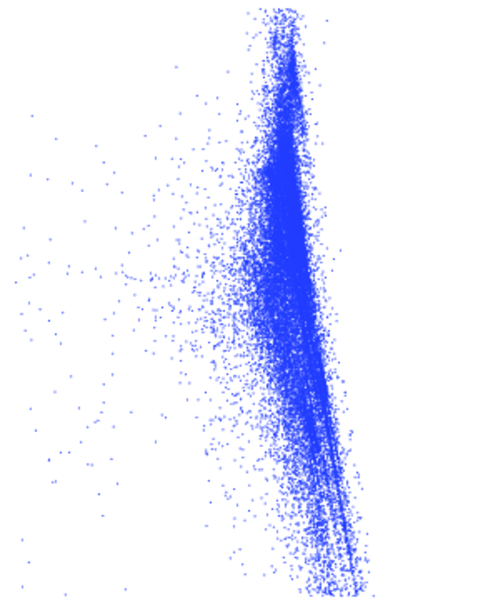
Skitter
This is the undirected network of autonomous system on the Internet connected
to each other, from the Skitter project.
Metadata
Statistics
| Size | n = | 1,696,415
|
| Volume | m = | 11,095,298
|
| Loop count | l = | 0
|
| Wedge count | s = | 16,021,665,681
|
| Claw count | z = | 96,557,738,585,948
|
| Cross count | x = | 600,795,229,914,113,920
|
| Triangle count | t = | 28,769,868
|
| Square count | q = | 62,769,198,018
|
| 4-Tour count | T4 = | 566,262,437,464
|
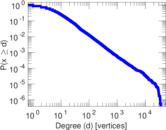
| Maximum degree | dmax = | 35,455
|
| Average degree | d = | 13.080 9
|
| Fill | p = | 7.710 90 × 10−6
|
| Size of LCC | N = | 1,694,616
|
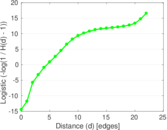
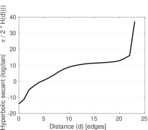
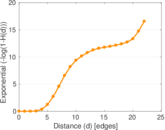
| Diameter | δ = | 31
|
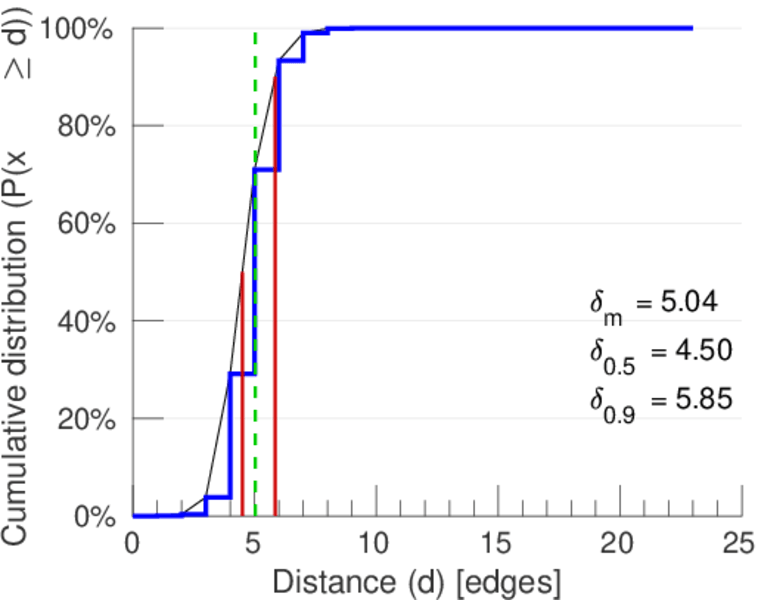
| 50-Percentile effective diameter | δ0.5 = | 4.499 30
|
| 90-Percentile effective diameter | δ0.9 = | 5.851 31
|
| Median distance | δM = | 5
|
| Mean distance | δm = | 5.036 87
|
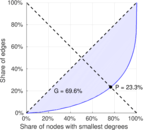
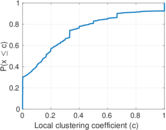
| Gini coefficient | G = | 0.696 474
|
| Balanced inequality ratio | P = | 0.233 354
|
| Relative edge distribution entropy | Her = | 0.889 471
|
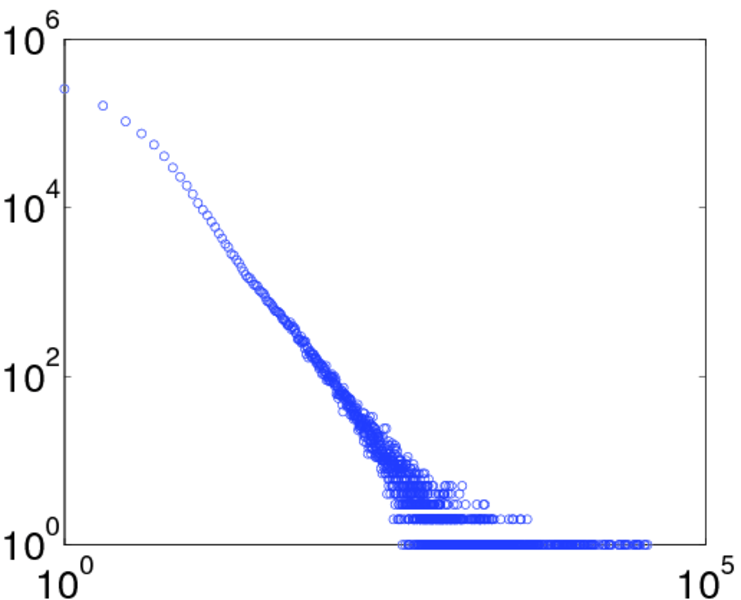
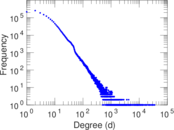
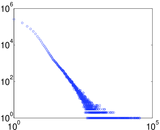
| Power law exponent | γ = | 1.610 77
|
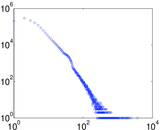
| Tail power law exponent | γt = | 2.291 00
|
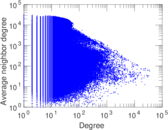
| Degree assortativity | ρ = | −0.081 420 1
|
| Degree assortativity p-value | pρ = | 0.000 00
|
| Clustering coefficient | c = | 0.005 387 06
|
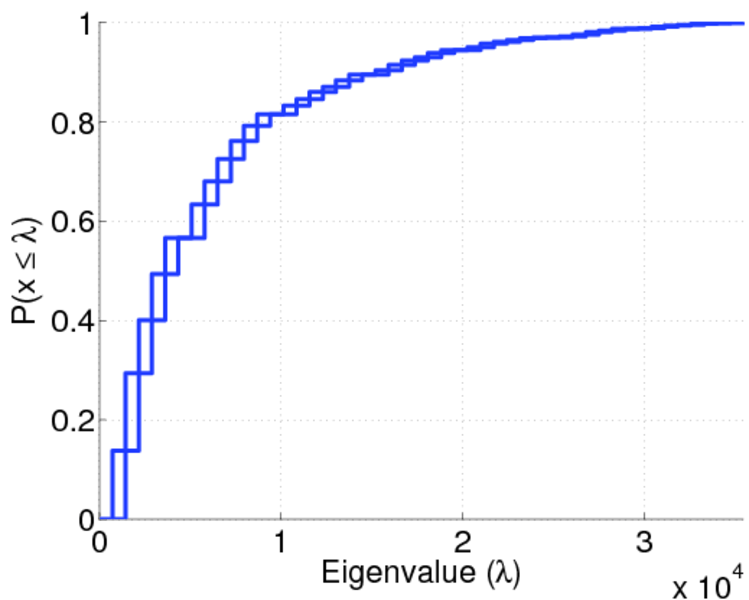
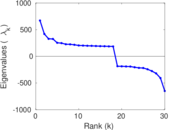
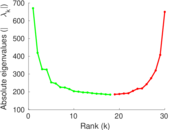
| Spectral norm | α = | 670.349
|
| Algebraic connectivity | a = | 0.001 077 53
|
| Spectral separation | |λ1[A] / λ2[A]| = | 1.031 40
|
| Non-bipartivity | bA = | 0.030 448 1
|
| Normalized non-bipartivity | bN = | 0.001 329 05
|
| Controllability | C = | 692,392
|
| Relative controllability | Cr = | 0.408 150
|
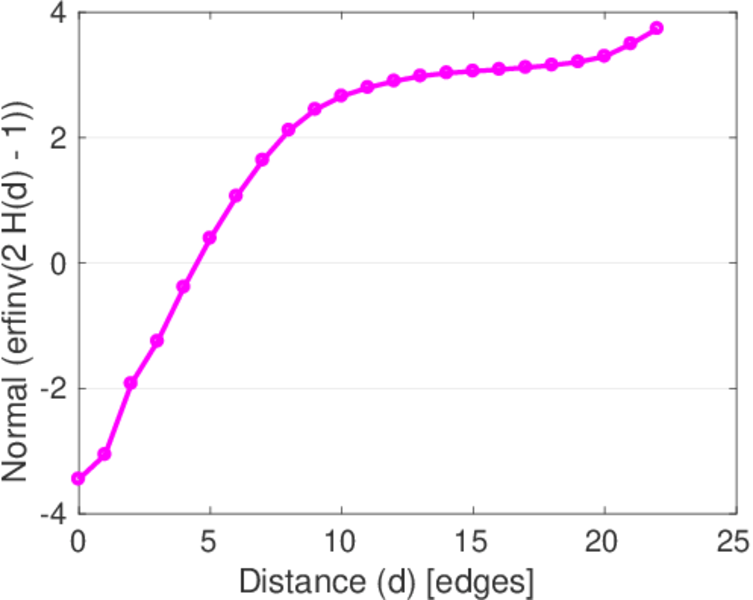
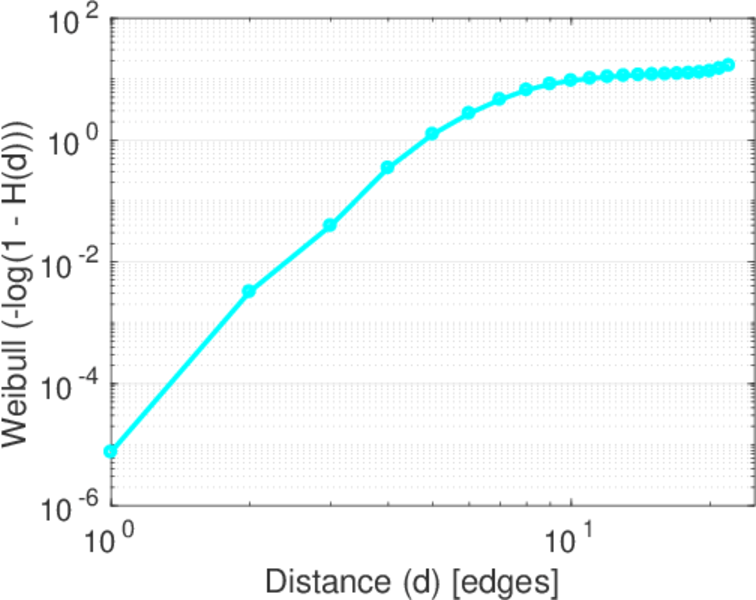
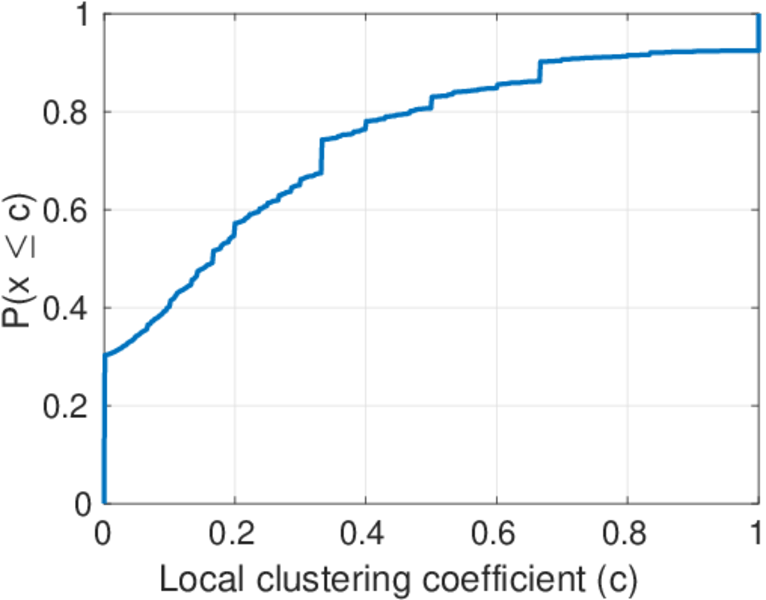
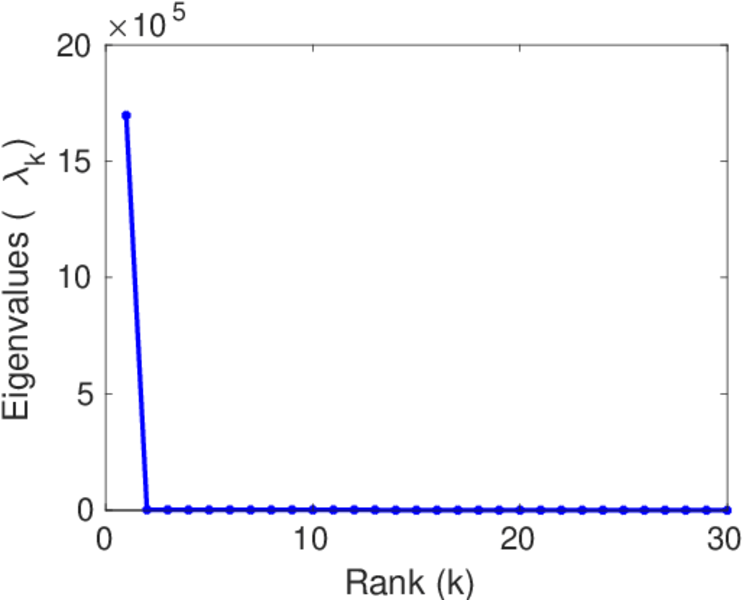
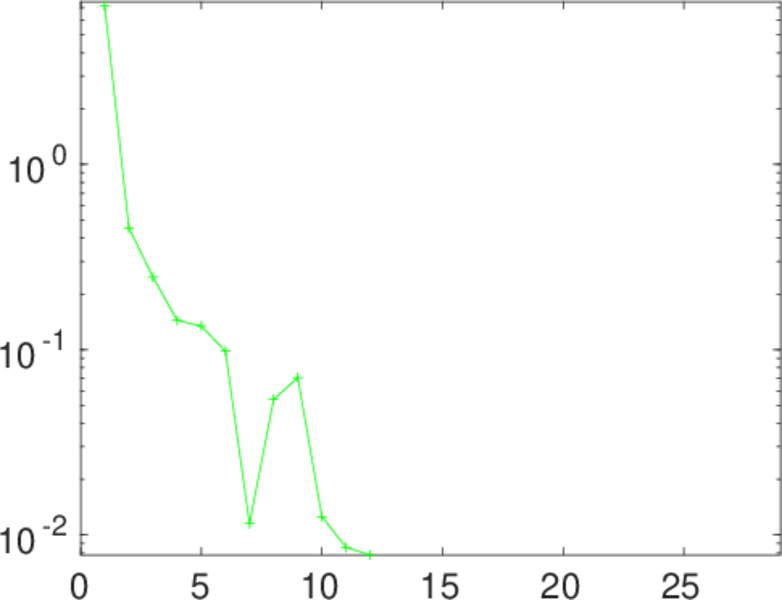
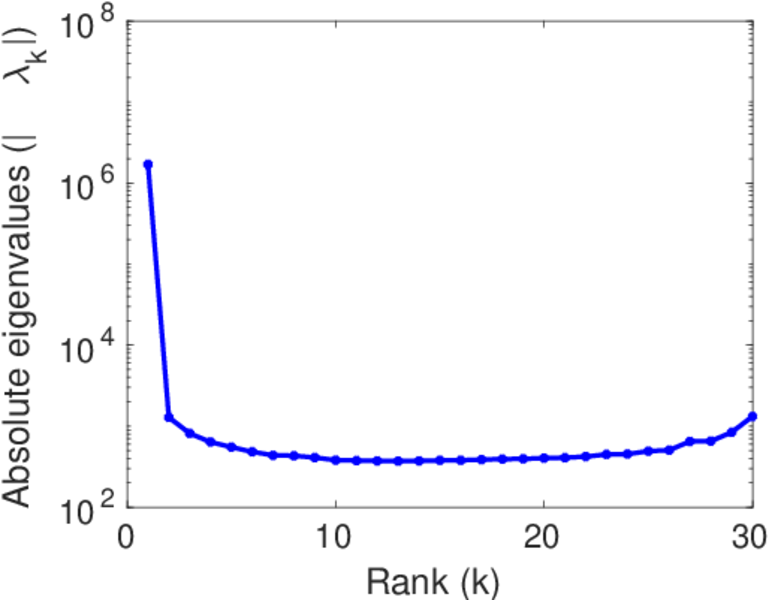
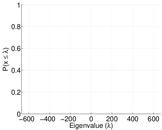
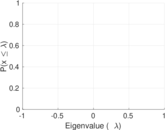
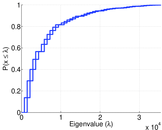
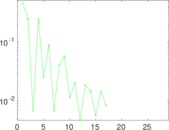
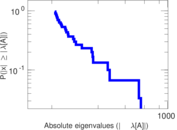
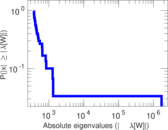
Plots
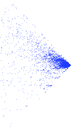


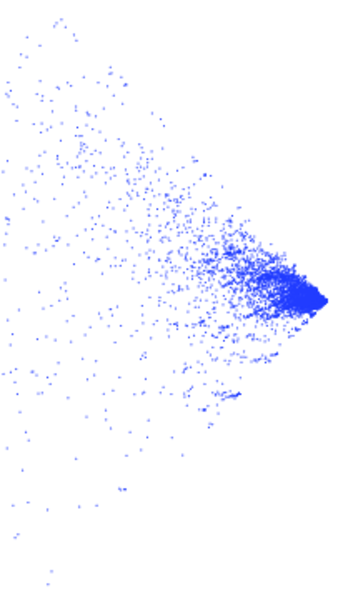
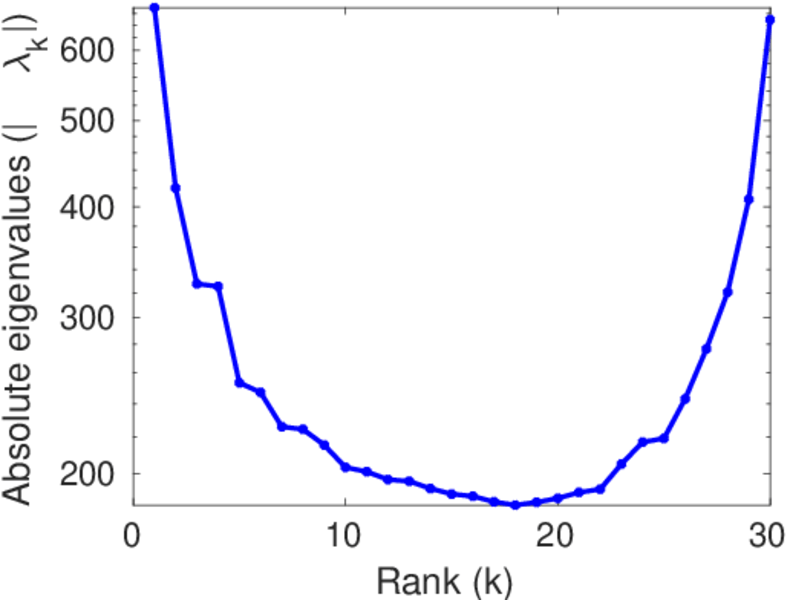
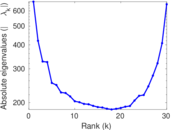
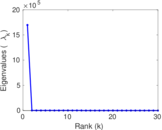
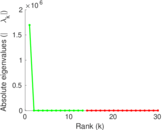
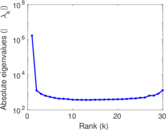
Matrix decompositions plots

Downloads
References
|
[1]
|
Jérôme Kunegis.
KONECT – The Koblenz Network Collection.
In Proc. Int. Conf. on World Wide Web Companion, pages
1343–1350, 2013.
[ http ]
|
|
[2]
|
Jure Leskovec, Jon Kleinberg, and Christos Faloutsos.
Graph evolution: Densification and shrinking diameters.
ACM Trans. Knowl. Discov. from Data, 1(1):1–40, 2007.
|
 KONECT ‣ Networks ‣
Buy Me a Coffee
KONECT ‣ Networks ‣
Buy Me a Coffee