Youtube friendships
This is the friendship network of the video-sharing site Youtube. Nodes are
users and an undirected edge between two nodes indicates a friendship.
Metadata
Statistics
| Size | n = | 1,134,890
|
| Volume | m = | 2,987,624
|
| Loop count | l = | 0
|
| Wedge count | s = | 1,474,482,560
|
| Claw count | z = | 5,743,242,041,025
|
| Cross count | x = | 32,746,672,524,915,828
|
| Triangle count | t = | 3,056,386
|
| Square count | q = | 468,774,021
|
| 4-Tour count | T4 = | 9,654,097,656
|
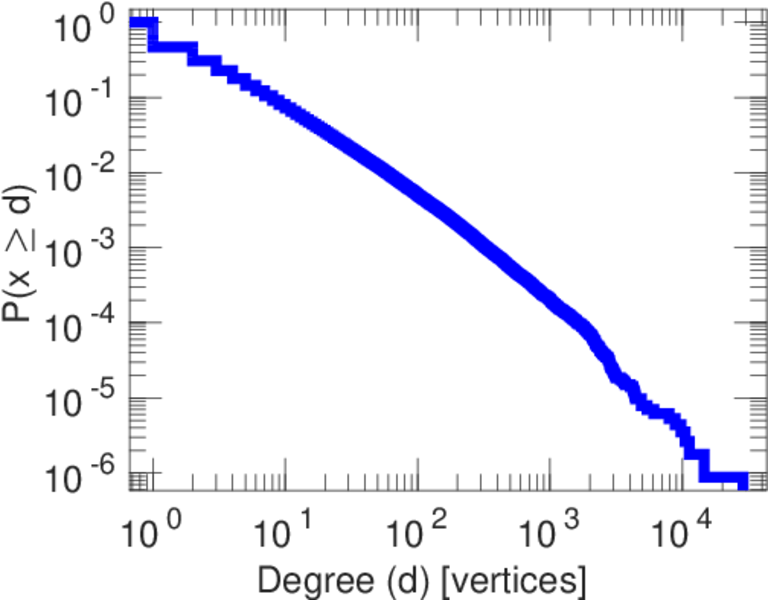
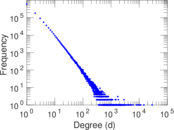
| Maximum degree | dmax = | 28,754
|
| Average degree | d = | 5.265 05
|
| Fill | p = | 4.639 26 × 10−6
|
| Size of LCC | N = | 1,134,890
|
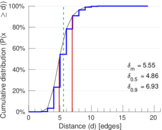
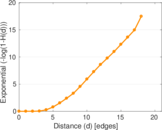
| Diameter | δ = | 24
|
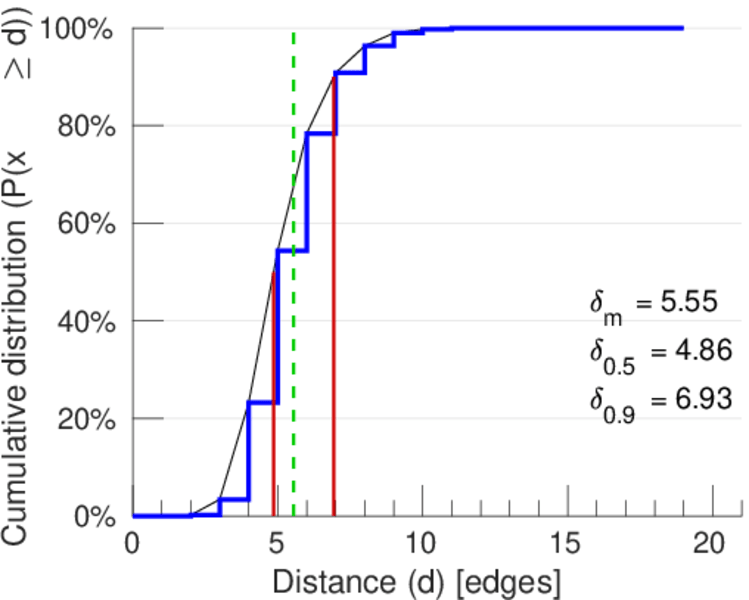
| 50-Percentile effective diameter | δ0.5 = | 4.860 22
|
| 90-Percentile effective diameter | δ0.9 = | 6.934 78
|
| Median distance | δM = | 5
|
| Mean distance | δm = | 5.548 06
|
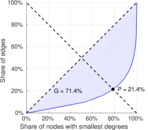
| Gini coefficient | G = | 0.714 126
|
| Balanced inequality ratio | P = | 0.213 532
|
| Relative edge distribution entropy | Her = | 0.877 112
|
| Power law exponent | γ = | 2.429 00
|
| Tail power law exponent | γt = | 2.141 00
|
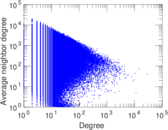
| Degree assortativity | ρ = | −0.036 909 9
|
| Degree assortativity p-value | pρ = | 0.000 00
|
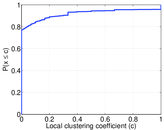
| Clustering coefficient | c = | 0.006 218 56
|
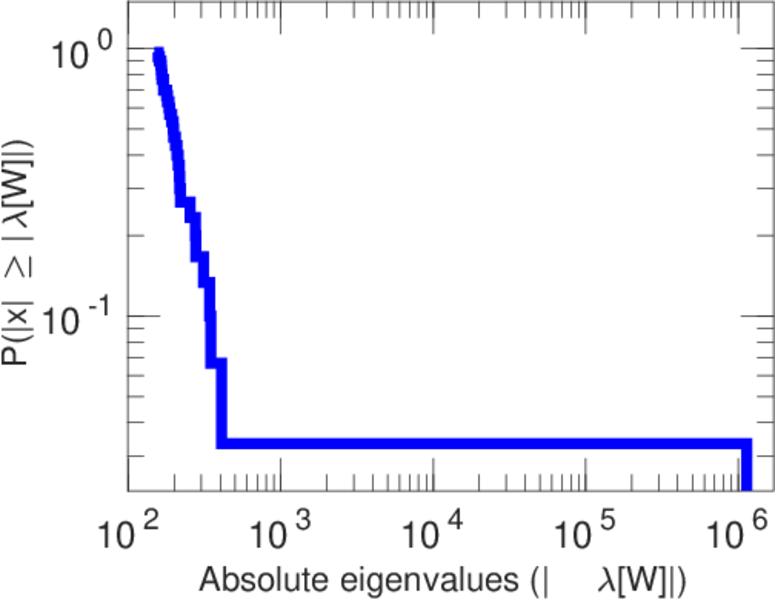
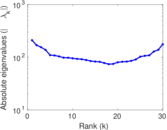
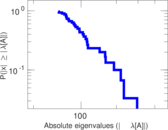
| Spectral norm | α = | 210.395
|
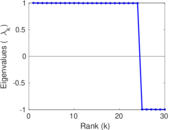
| Spectral separation | |λ1[A] / λ2[A]| = | 1.191 91
|
| Non-bipartivity | bA = | 0.161 013
|
| Normalized non-bipartivity | bN = | 0.002 045 96
|
| Algebraic non-bipartivity | χ = | 0.004 266 35
|
| Spectral bipartite frustration | bK = | 0.000 202 579
|
| Controllability | C = | 588,233
|
| Relative controllability | Cr = | 0.518 317
|
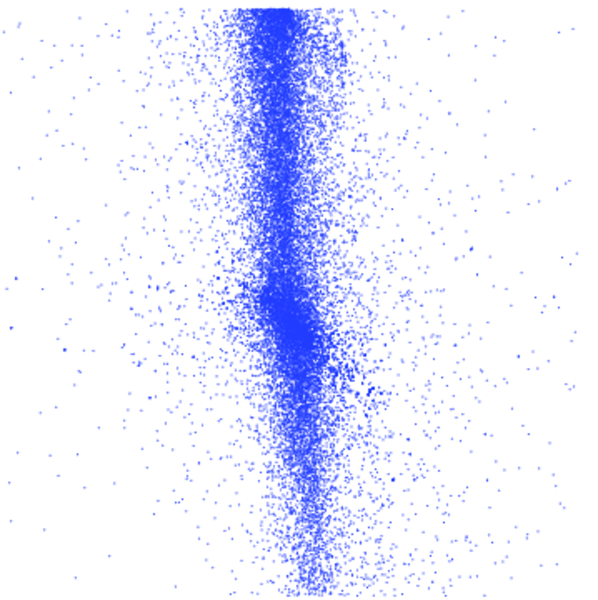
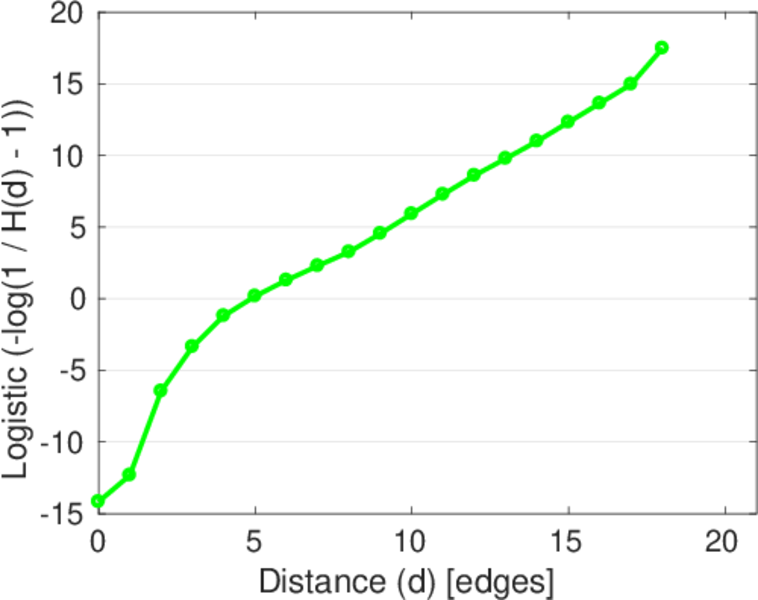
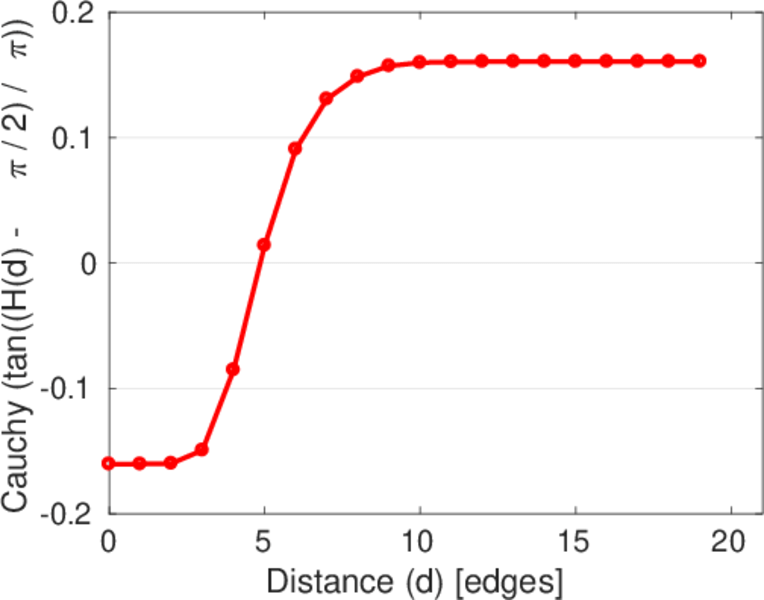
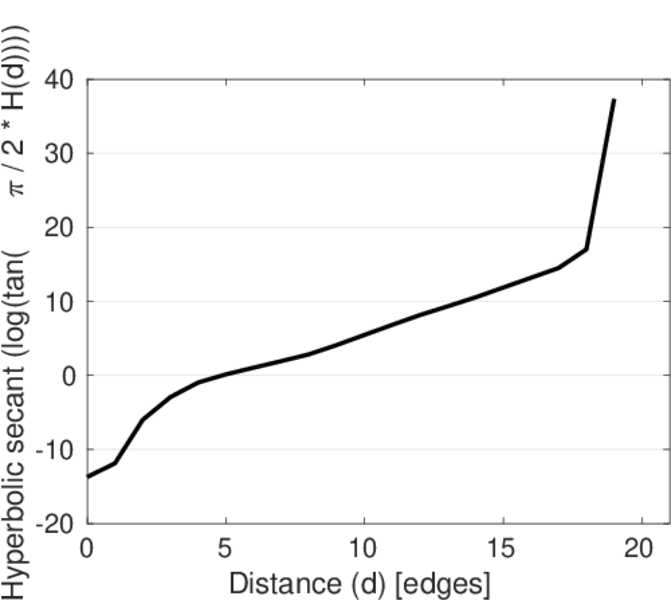
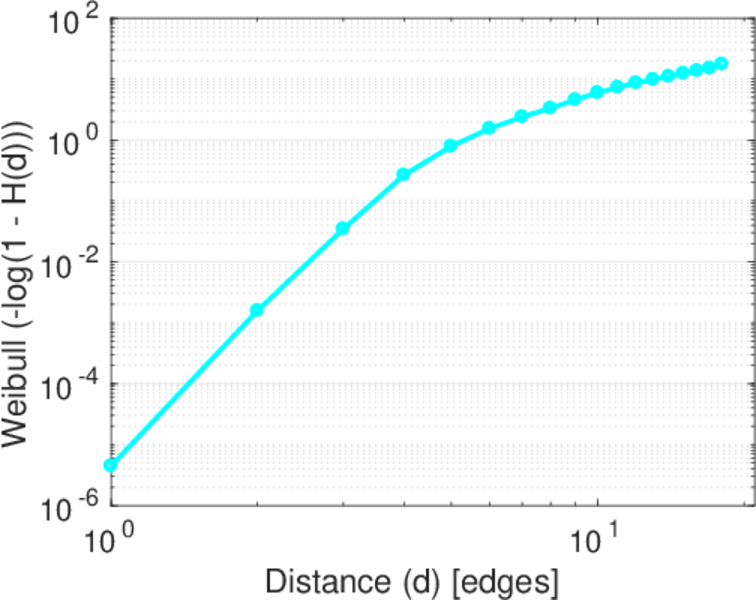
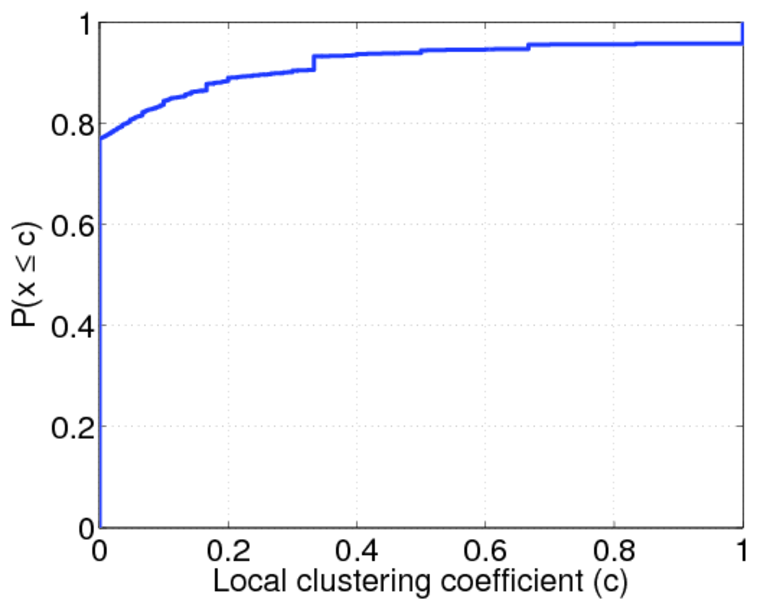
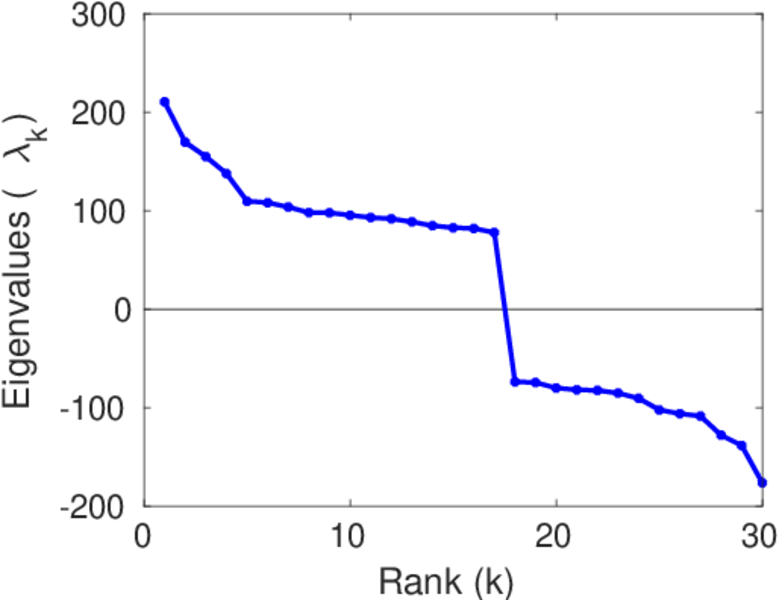
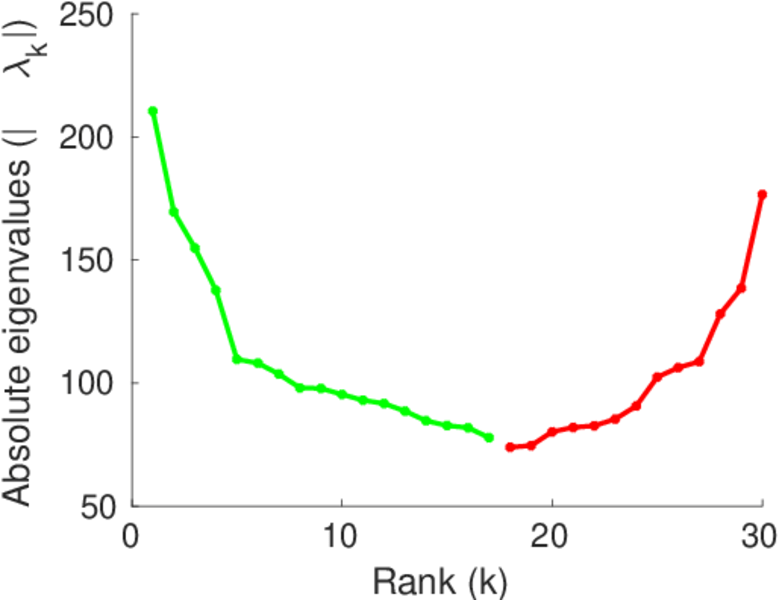
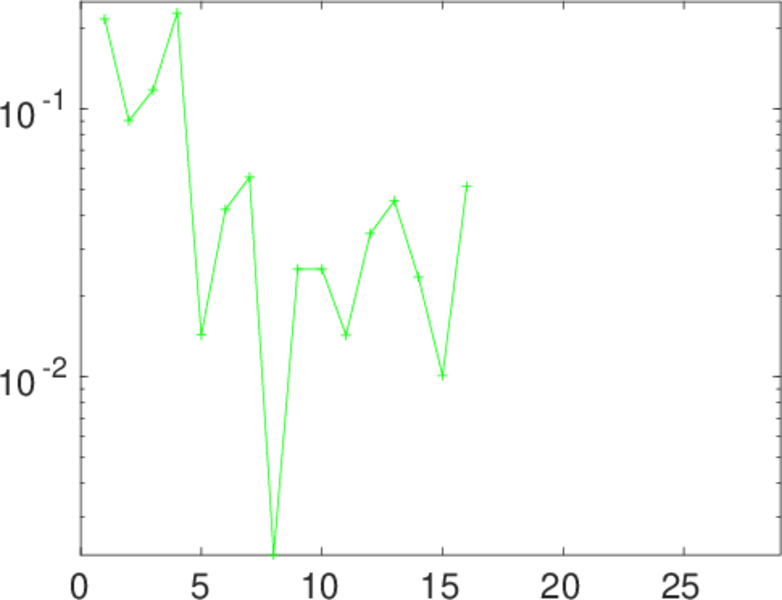
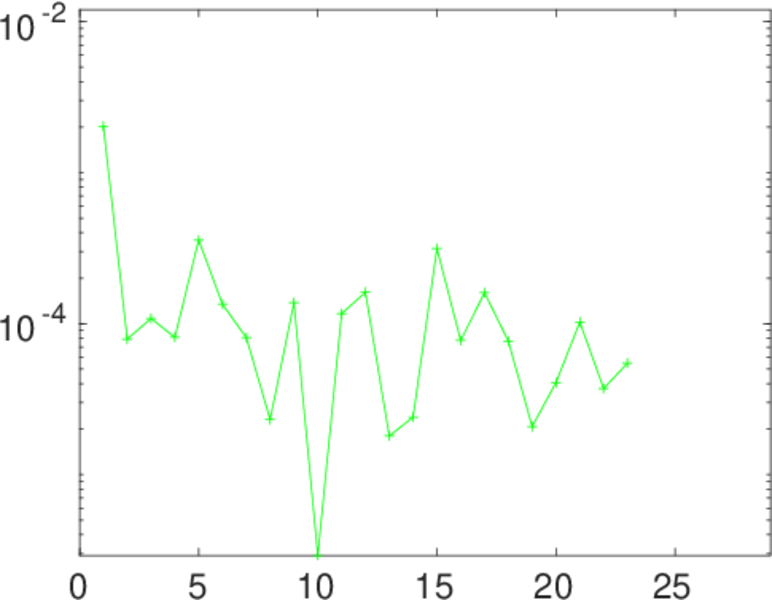
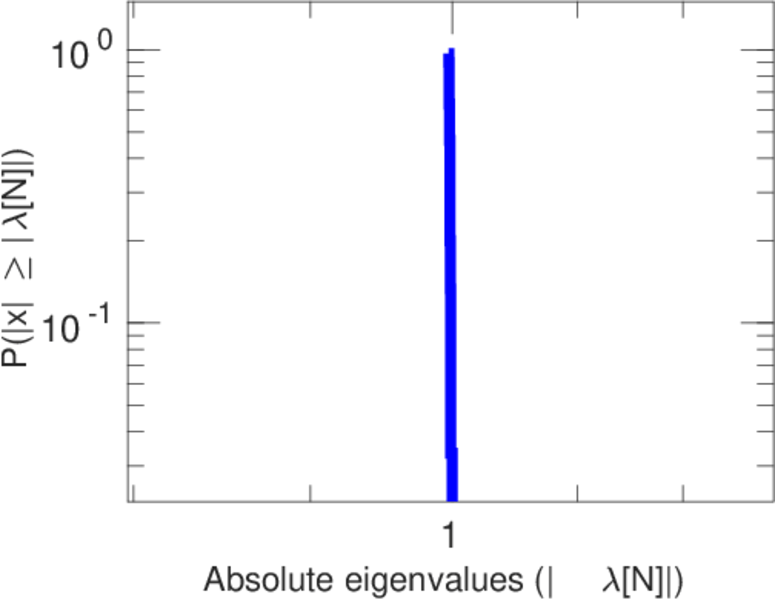
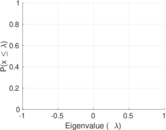
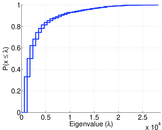
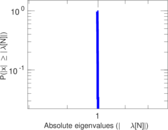
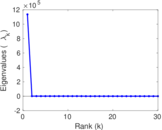
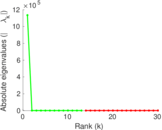
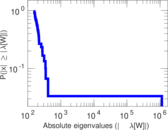
Plots


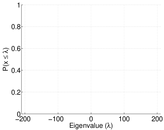
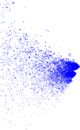
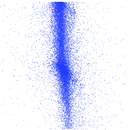


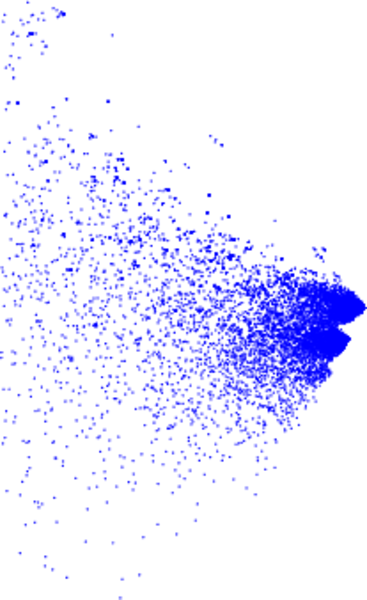
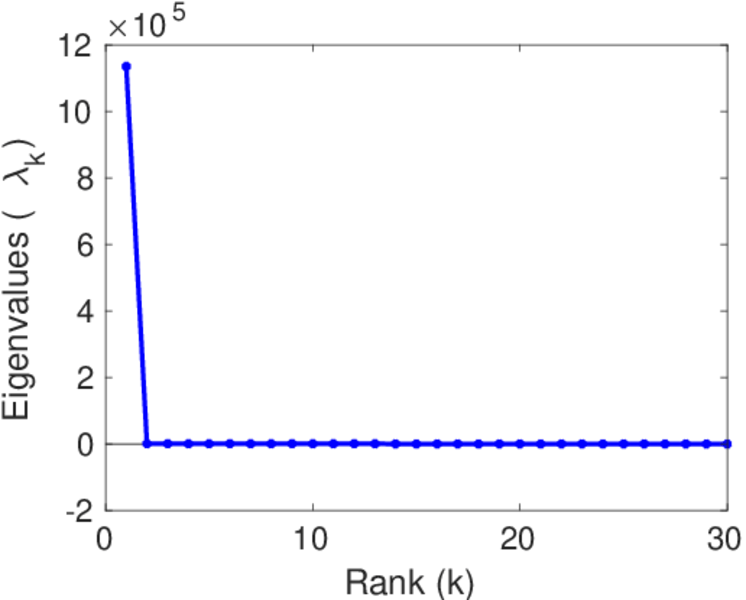
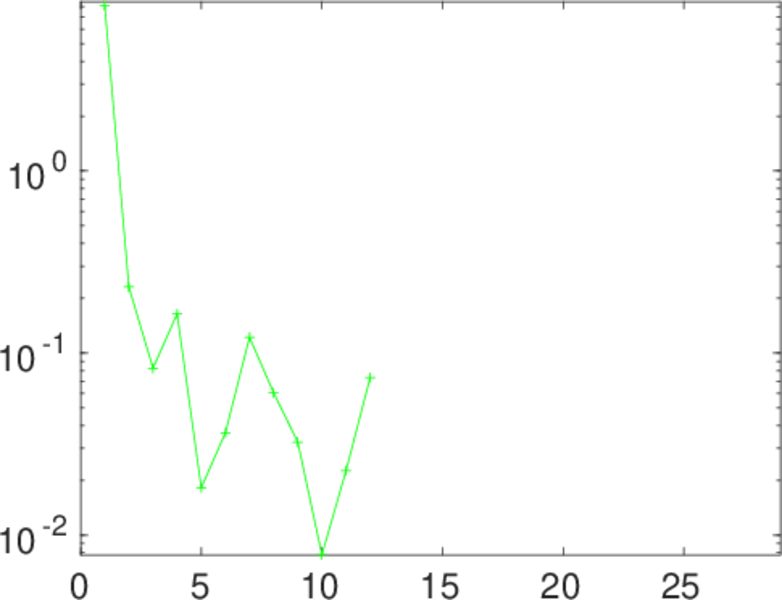
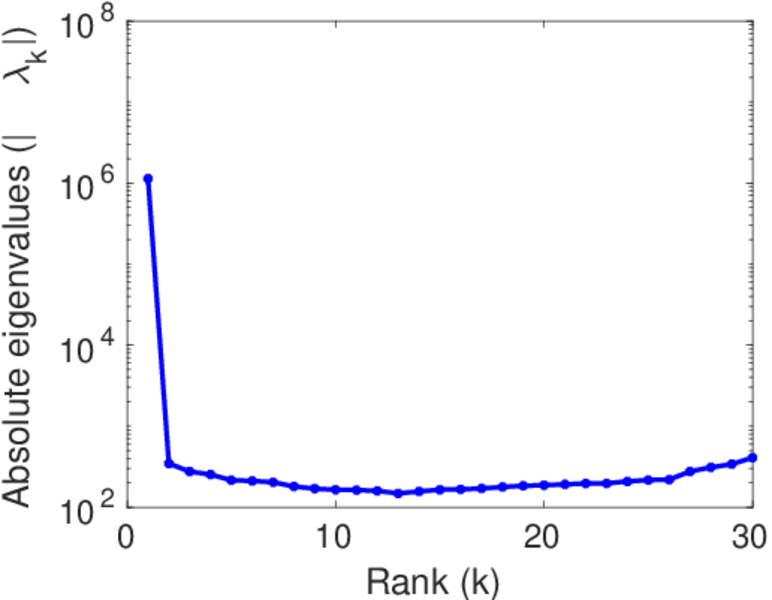
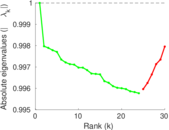
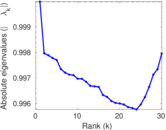
Matrix decompositions plots


Downloads
References
|
[1]
|
Jérôme Kunegis.
KONECT – The Koblenz Network Collection.
In Proc. Int. Conf. on World Wide Web Companion, pages
1343–1350, 2013.
[ http ]
|
|
[2]
|
Jaewon Yang and Jure Leskovec.
Defining and evaluating network communities based on ground-truth.
In Proc. ACM SIGKDD Workshop on Min. Data Semant., page 3,
2012.
|
 KONECT ‣ Networks ‣
Buy Me a Coffee
KONECT ‣ Networks ‣
Buy Me a Coffee