DBLP
This is the authorshop network of the DBLP computer science bibliography. The
network is bipartite; its nodes are authors and publications. Each edge
connects an author to one of his publications.
Metadata
Statistics
| Size | n = | 7,577,304
|
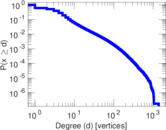
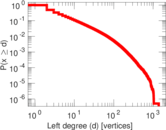
| Left size | n1 = | 1,953,085
|
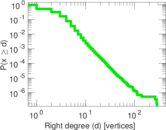
| Right size | n2 = | 5,624,219
|
| Volume | m = | 12,282,059
|
| Wedge count | s = | 320,739,707
|
| Claw count | z = | 24,570,683,973
|
| Cross count | x = | 2,921,014,732,764
|
| Square count | q = | 31,673,959
|
| 4-Tour count | T4 = | 1,560,916,090
|
| Maximum degree | dmax = | 1,386
|
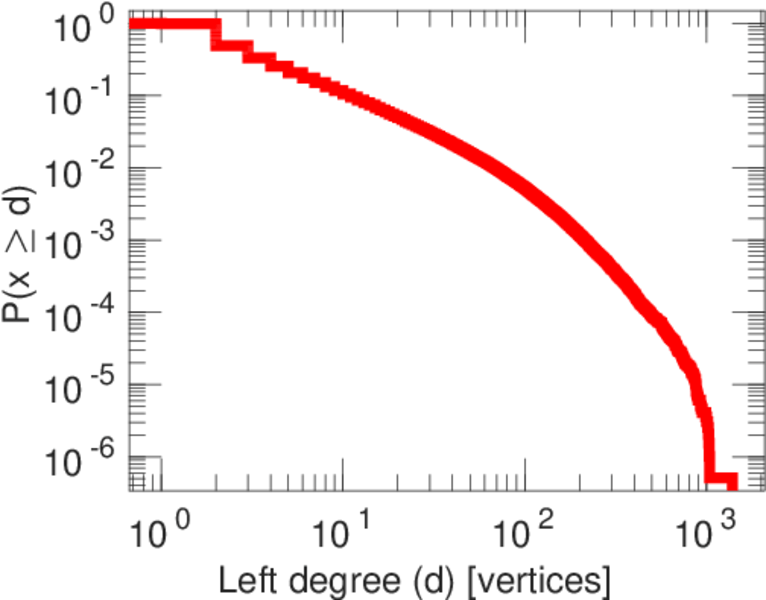
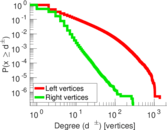
| Maximum left degree | d1max = | 1,386
|
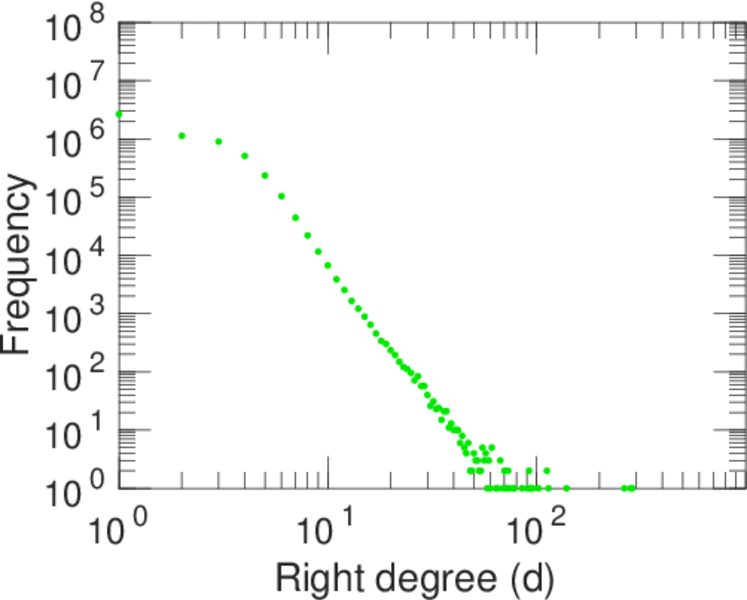
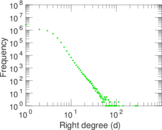
| Maximum right degree | d2max = | 287
|
| Average degree | d = | 3.241 80
|
| Average left degree | d1 = | 6.288 54
|
| Average right degree | d2 = | 2.183 78
|
| Fill | p = | 1.118 12 × 10−6
|
| Size of LCC | N = | 6,735,203
|
| Diameter | δ = | 48
|
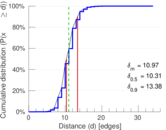
| 50-Percentile effective diameter | δ0.5 = | 10.314 7
|
| 90-Percentile effective diameter | δ0.9 = | 13.377 2
|
| Median distance | δM = | 11
|
| Mean distance | δm = | 10.972 5
|
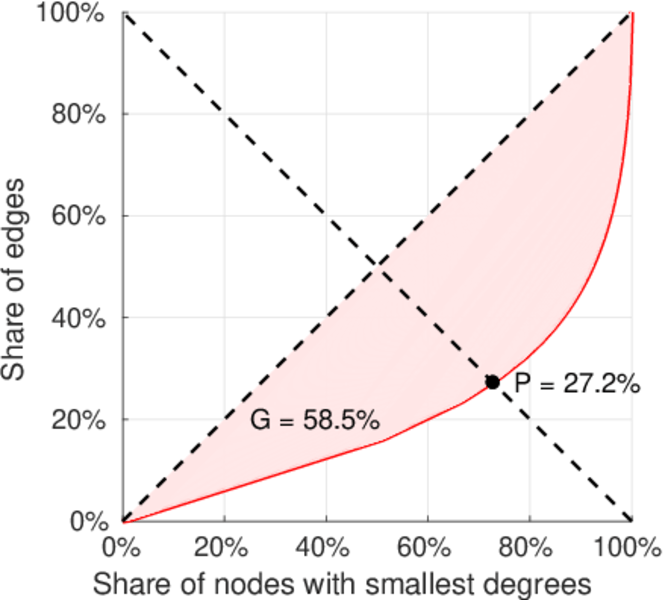
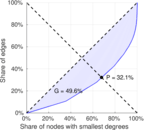
| Gini coefficient | G = | 0.550 189
|
| Balanced inequality ratio | P = | 0.297 016
|
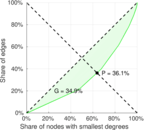
| Left balanced inequality ratio | P1 = | 0.271 530
|
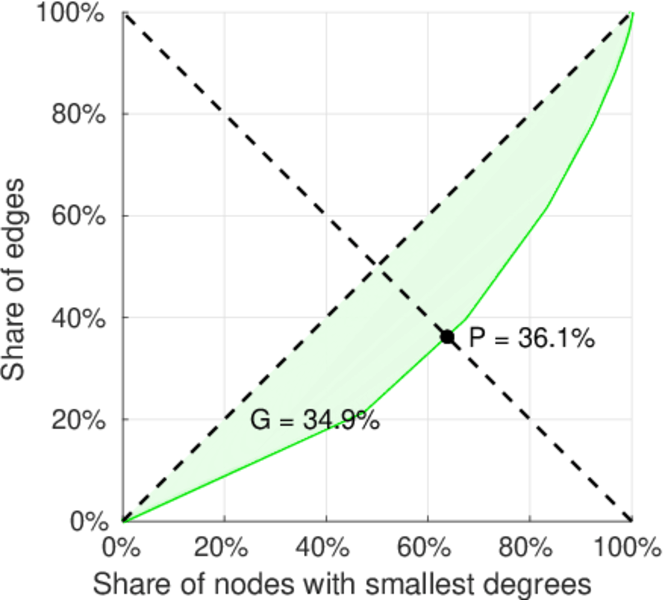
| Right balanced inequality ratio | P2 = | 0.360 600
|
| Relative edge distribution entropy | Her = | 0.956 031
|
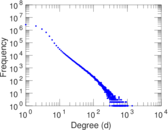
| Power law exponent | γ = | 2.338 25
|
| Tail power law exponent | γt = | 2.291 00
|
| Tail power law exponent with p | γ3 = | 2.291 00
|
| p-value | p = | 0.000 00
|
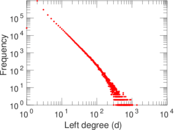
| Left tail power law exponent with p | γ3,1 = | 2.121 00
|
| Left p-value | p1 = | 0.000 00
|
| Right tail power law exponent with p | γ3,2 = | 4.351 00
|
| Right p-value | p2 = | 0.422 000
|
| Degree assortativity | ρ = | +0.032 781 5
|
| Degree assortativity p-value | pρ = | 0.000 00
|
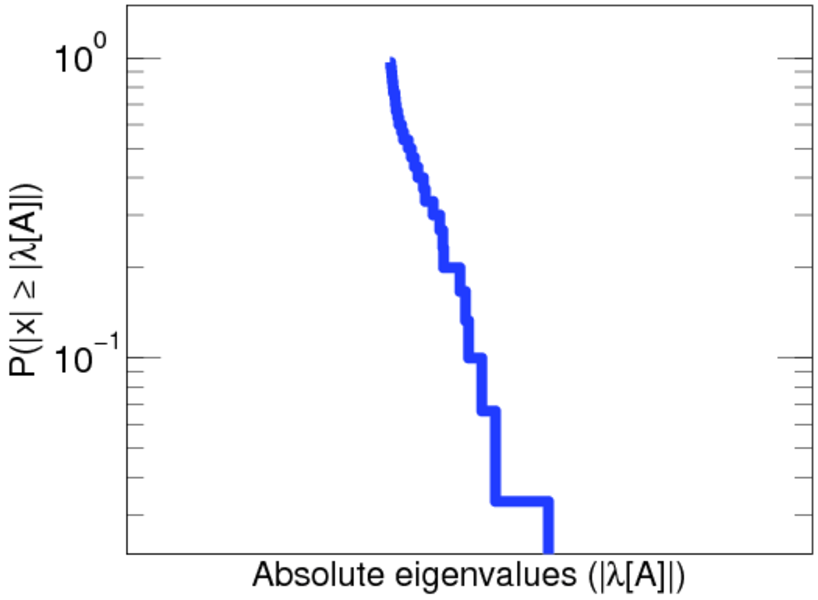
| Spectral norm | α = | 37.938 1
|
| Spectral separation | |λ1[A] / λ2[A]| = | 1.084 58
|
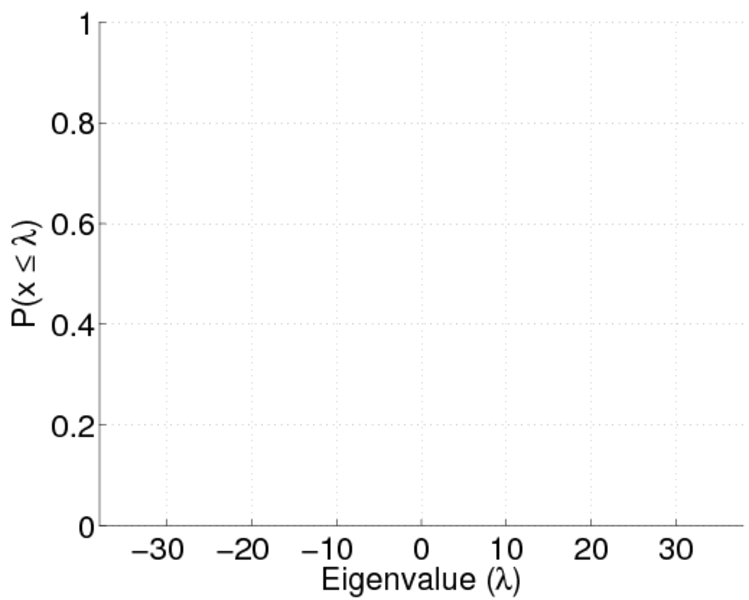
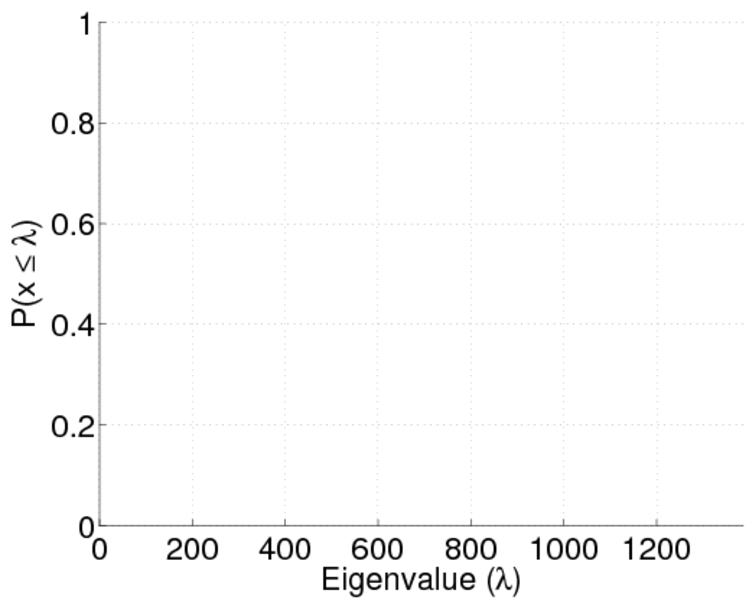
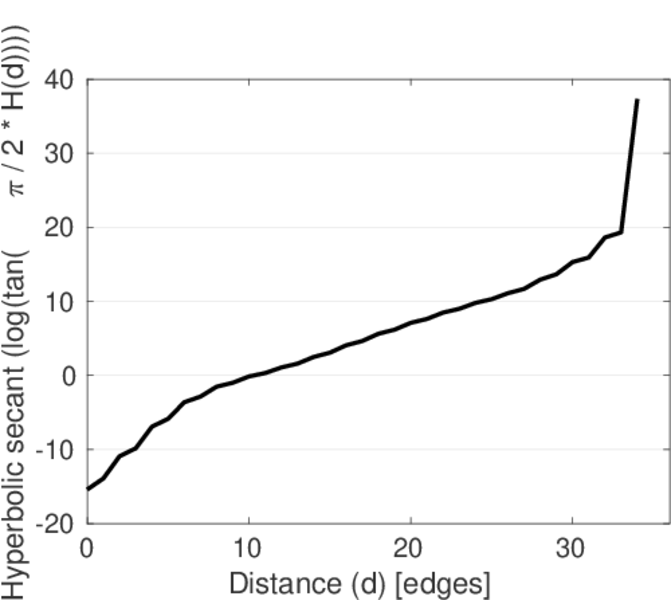
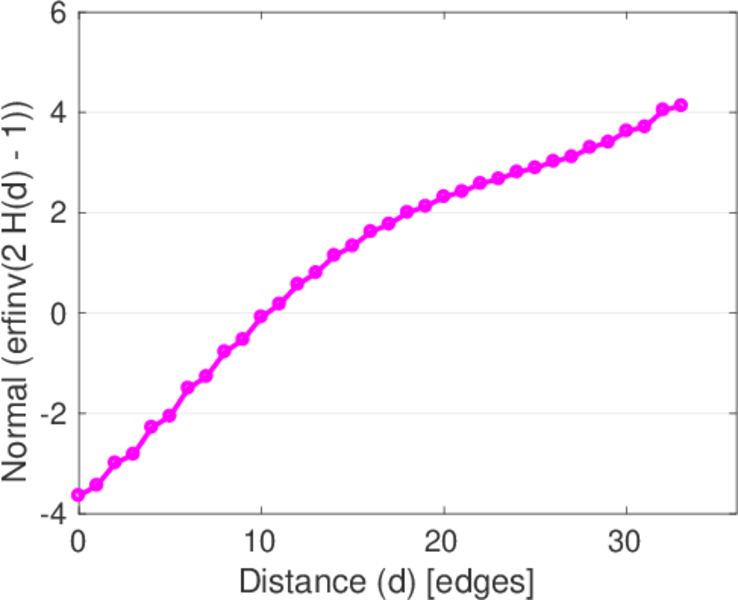
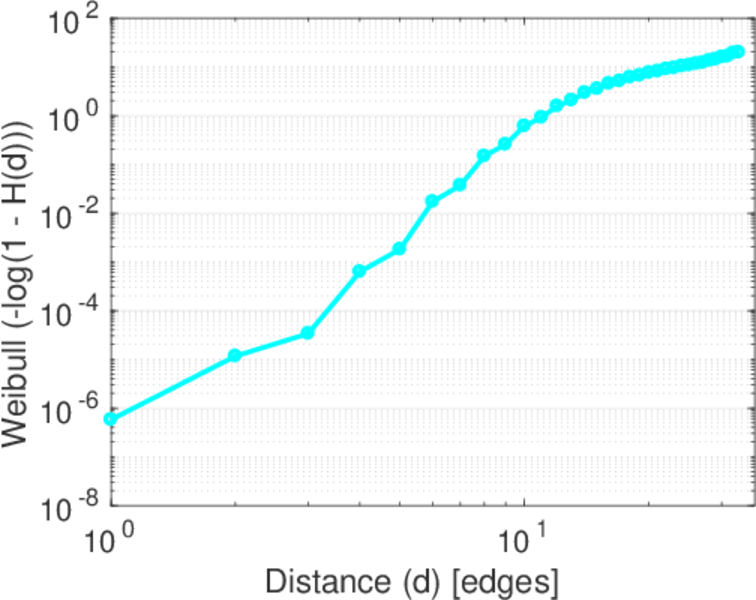
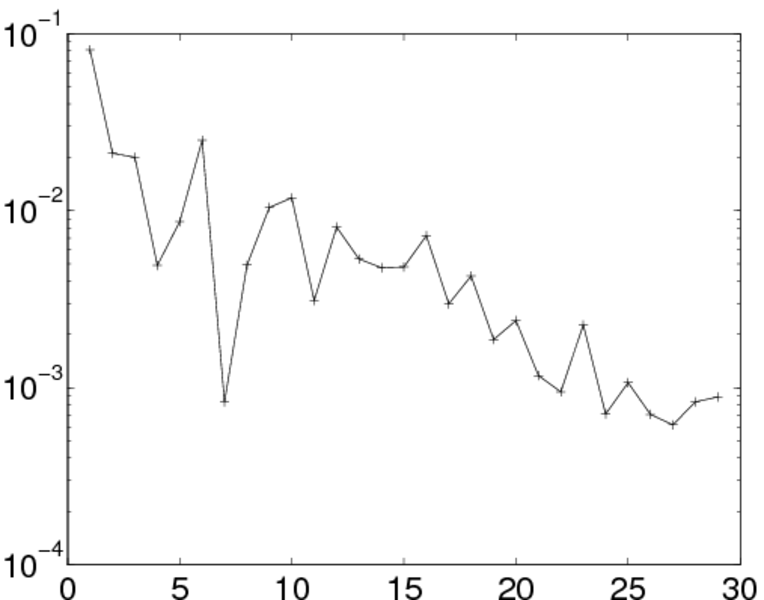
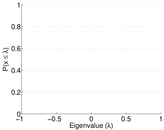
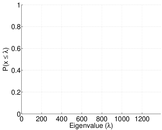
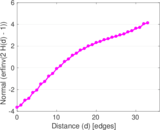
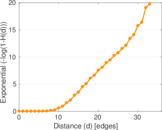
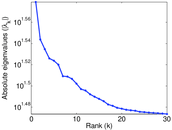
Plots

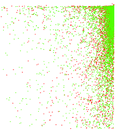
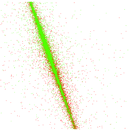

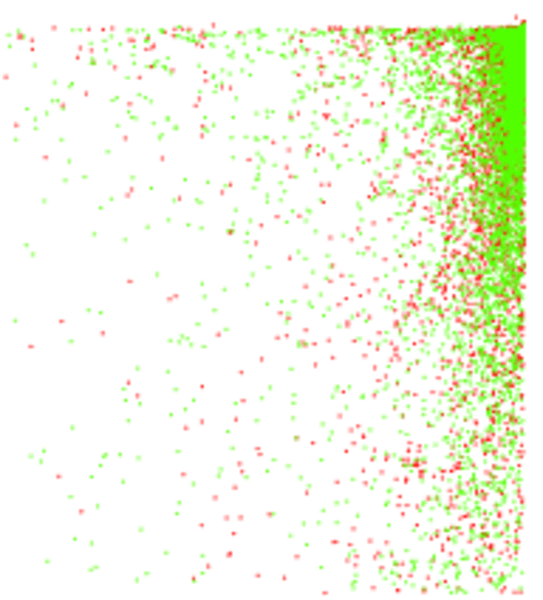
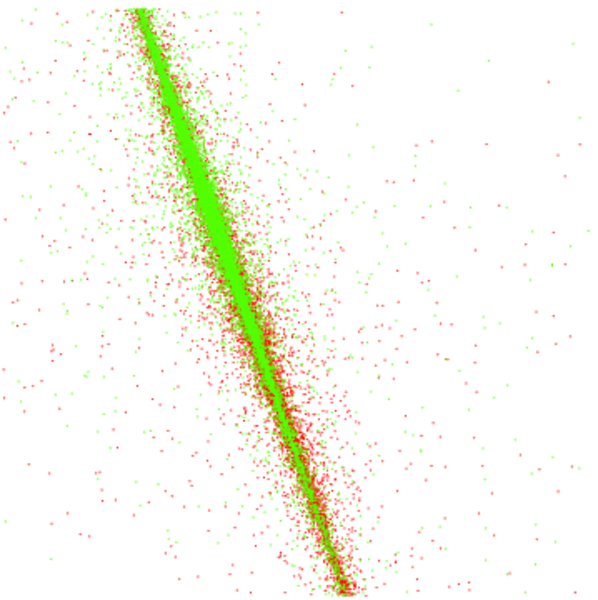
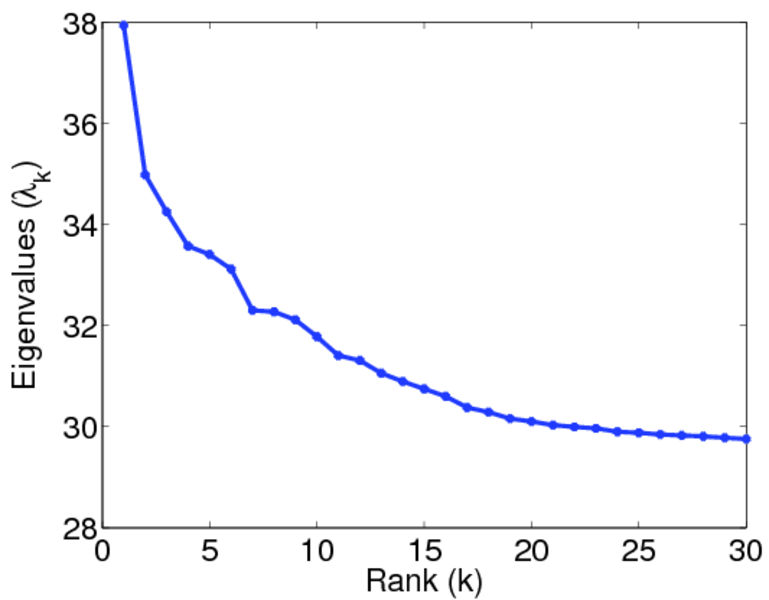
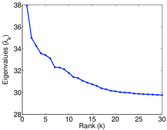
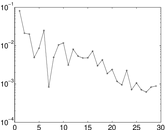
Matrix decompositions plots

Downloads
References
|
[1]
|
Jérôme Kunegis.
KONECT – The Koblenz Network Collection.
In Proc. Int. Conf. on World Wide Web Companion, pages
1343–1350, 2013.
[ http ]
|
|
[2]
|
Michael Ley.
The DBLP computer science bibliography: Evolution, research issues,
perspectives.
In Proc. Int. Symposium on String Process. and Inf. Retr.,
pages 1–10, 2002.
|
 KONECT ‣ Networks ‣
Buy Me a Coffee
KONECT ‣ Networks ‣
Buy Me a Coffee