Florida
This is the directed road network from the 9th DIMACS Implementation Challenge,
for the area "Florida".
Metadata
Statistics
| Size | n = | 1,070,376
|
| Volume | m = | 2,687,902
|
| Loop count | l = | 0
|
| Wedge count | s = | 2,519,132
|
| Claw count | z = | 18,454,440
|
| Cross count | x = | 17,451,504
|
| Triangle count | t = | 22,327
|
| Square count | q = | 110,893
|
| 4-Tour count | T4 = | 13,651,574
|
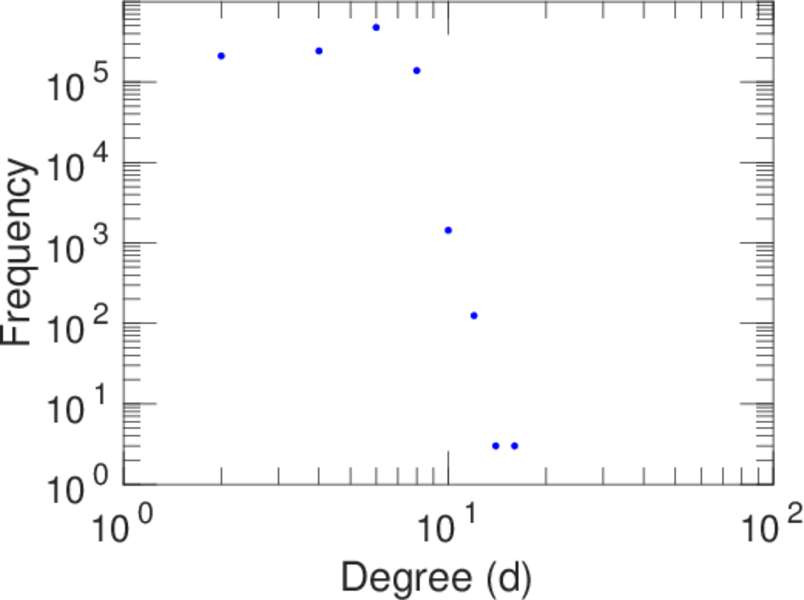
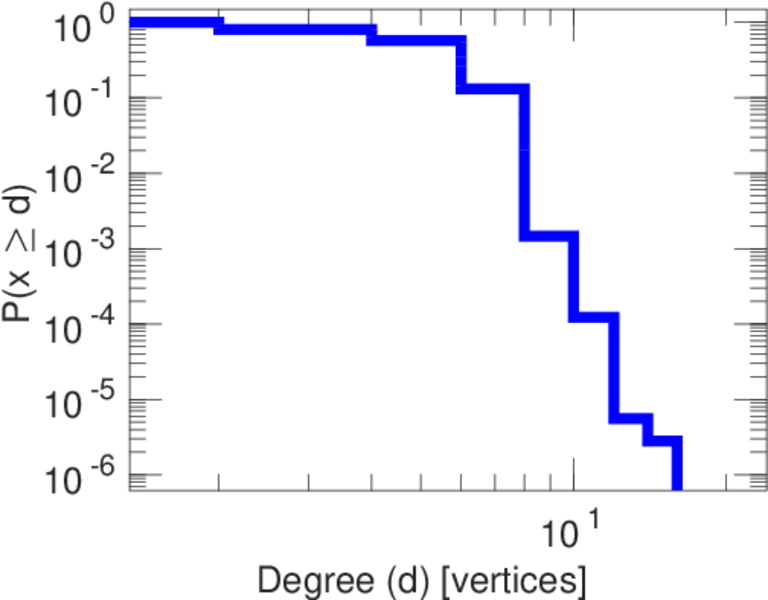
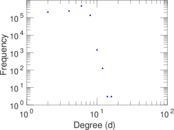
| Maximum degree | dmax = | 16
|
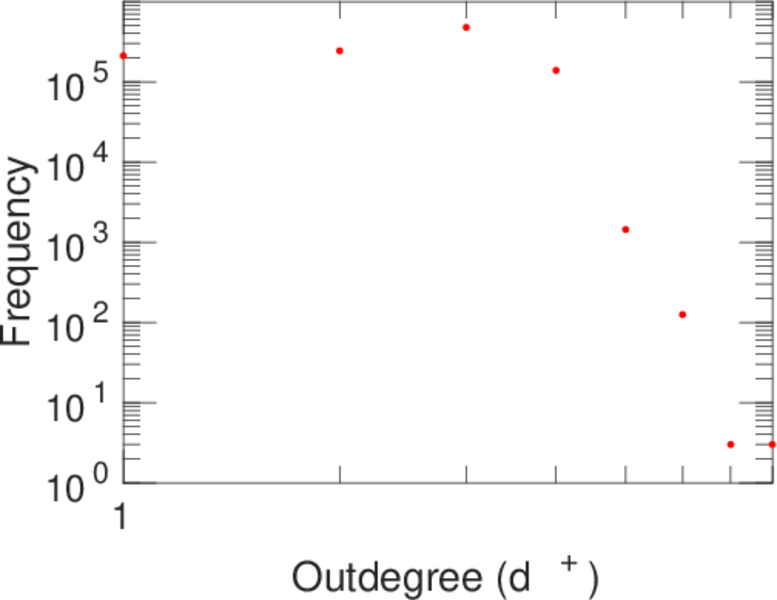
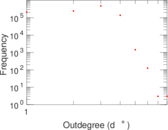
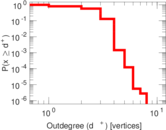
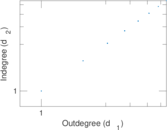
| Maximum outdegree | d+max = | 8
|
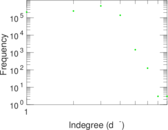
| Maximum indegree | d−max = | 8
|
| Average degree | d = | 5.022 35
|
| Fill | p = | 2.346 07 × 10−6
|
| Size of LCC | N = | 1,070,376
|
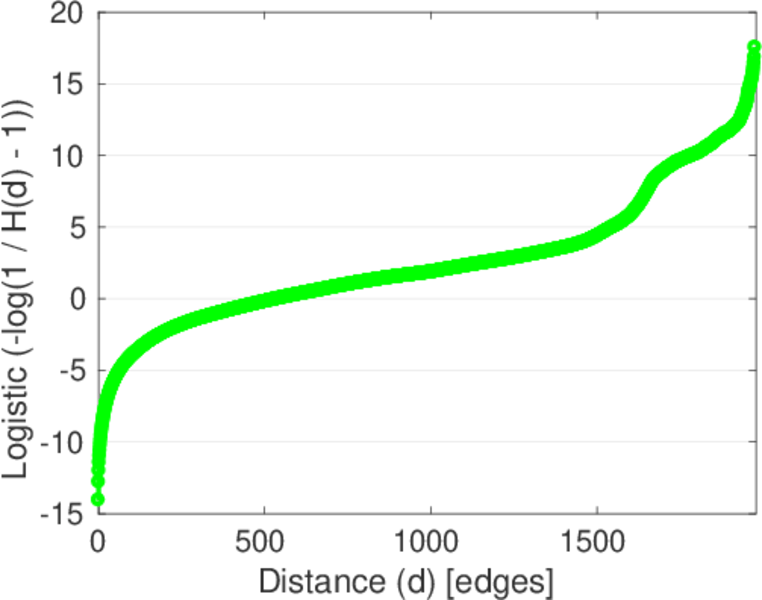
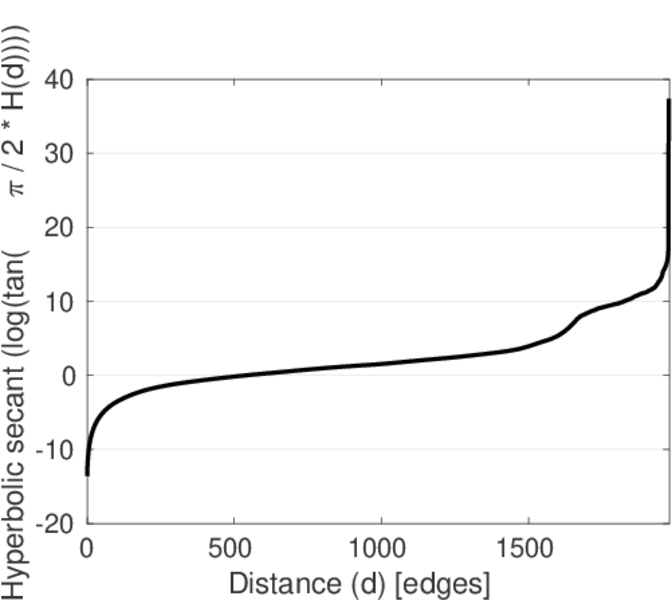
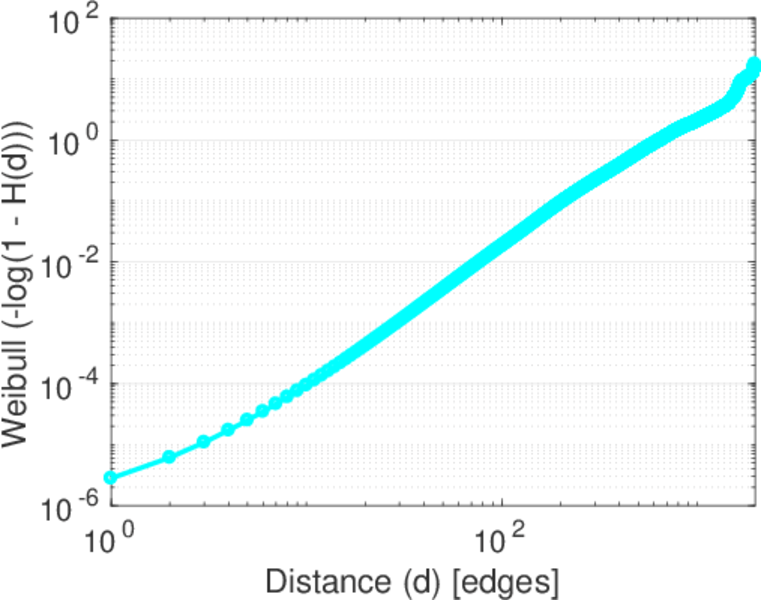
| Diameter | δ = | 2,058
|
| 50-Percentile effective diameter | δ0.5 = | 538.354
|
| 90-Percentile effective diameter | δ0.9 = | 1,082.86
|
| Median distance | δM = | 539
|
| Mean distance | δm = | 597.595
|
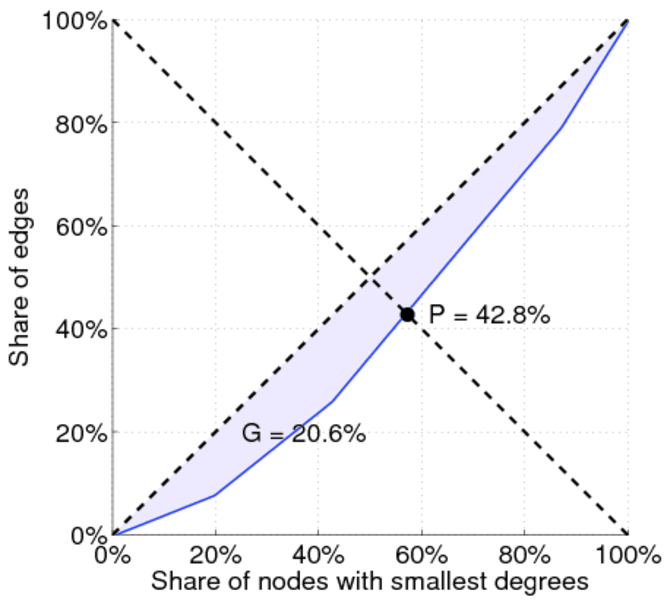
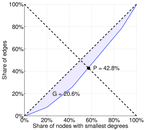
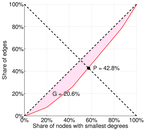
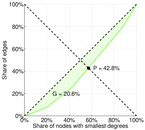
| Gini coefficient | G = | 0.206 181
|
| Balanced inequality ratio | P = | 0.427 587
|
| Outdegree balanced inequality ratio | P+ = | 0.427 587
|
| Indegree balanced inequality ratio | P− = | 0.427 587
|
| Relative edge distribution entropy | Her = | 0.994 300
|
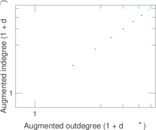
| Power law exponent | γ = | 2.207 68
|
| Tail power law exponent | γt = | 6.431 00
|
| Tail power law exponent with p | γ3 = | 6.431 00
|
| p-value | p = | 0.000 00
|
| Outdegree tail power law exponent with p | γ3,o = | 6.431 00
|
| Outdegree p-value | po = | 0.000 00
|
| Indegree tail power law exponent with p | γ3,i = | 6.431 00
|
| Indegree p-value | pi = | 0.000 00
|
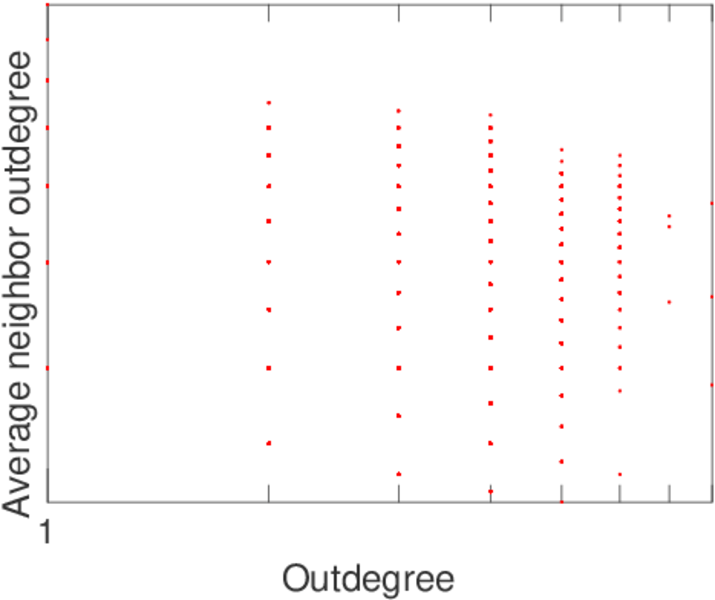
| Degree assortativity | ρ = | +0.080 160 6
|
| Degree assortativity p-value | pρ = | 0.000 00
|
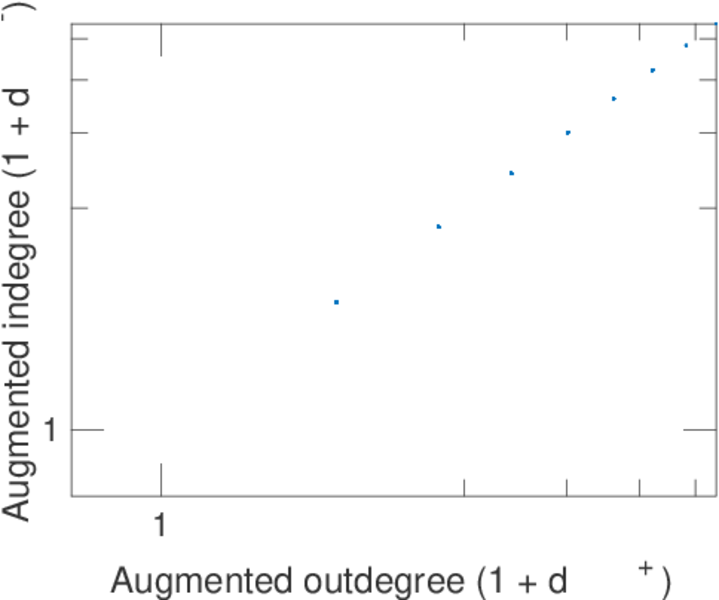
| In/outdegree correlation | ρ± = | +1.000 00
|
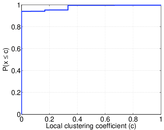
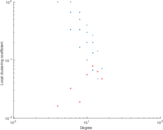
| Clustering coefficient | c = | 0.026 588 9
|
| Directed clustering coefficient | c± = | 0.026 588 9
|
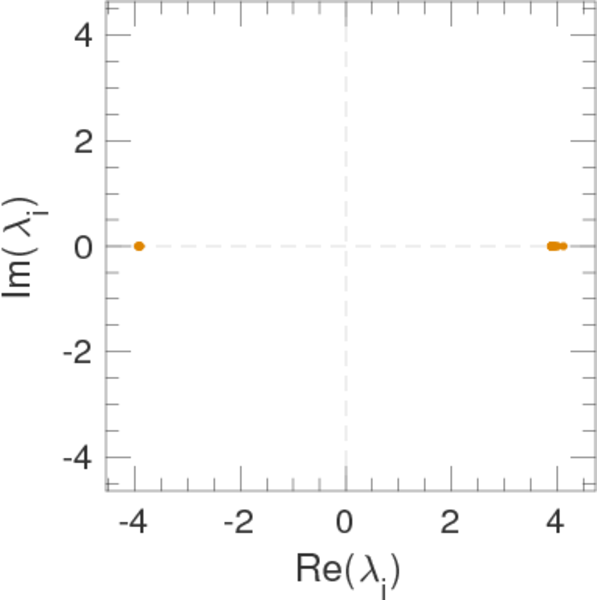
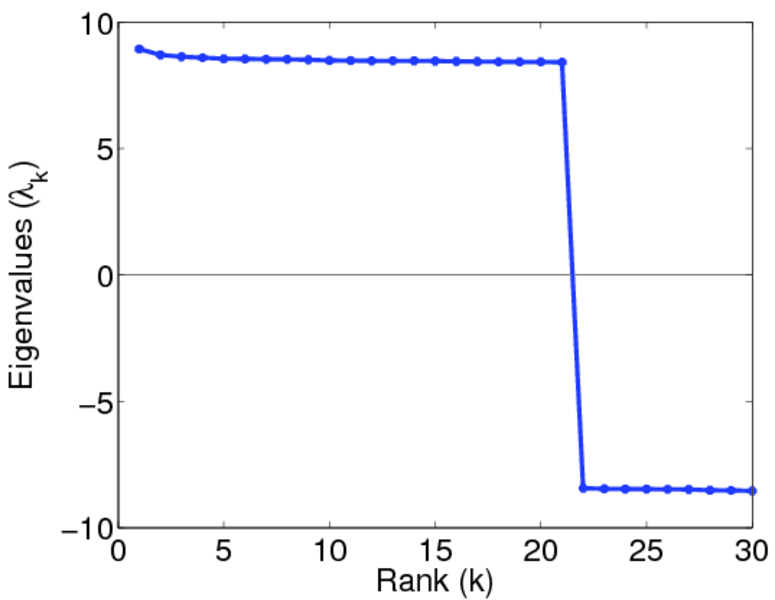
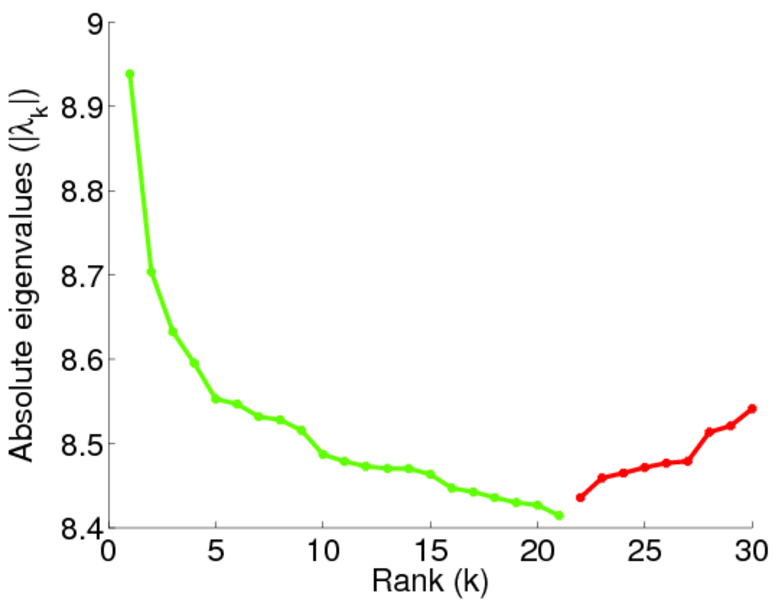
| Spectral norm | α = | 8.250 97
|
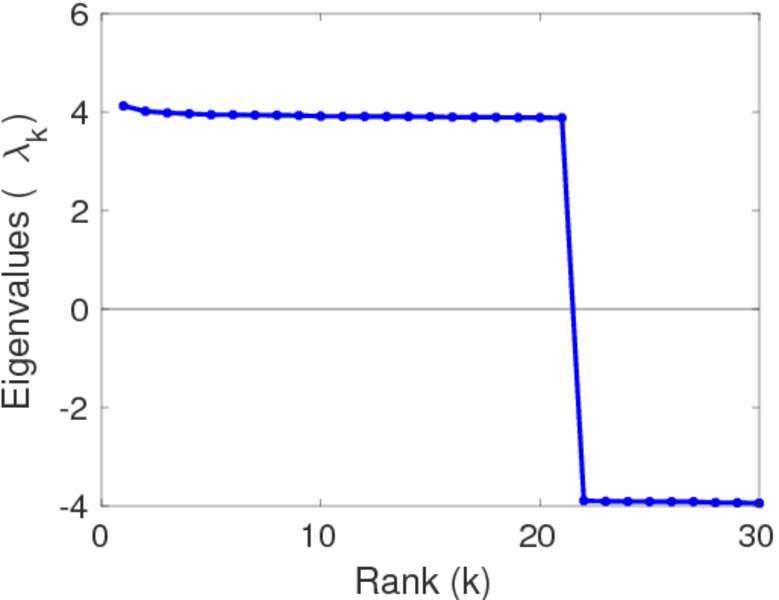
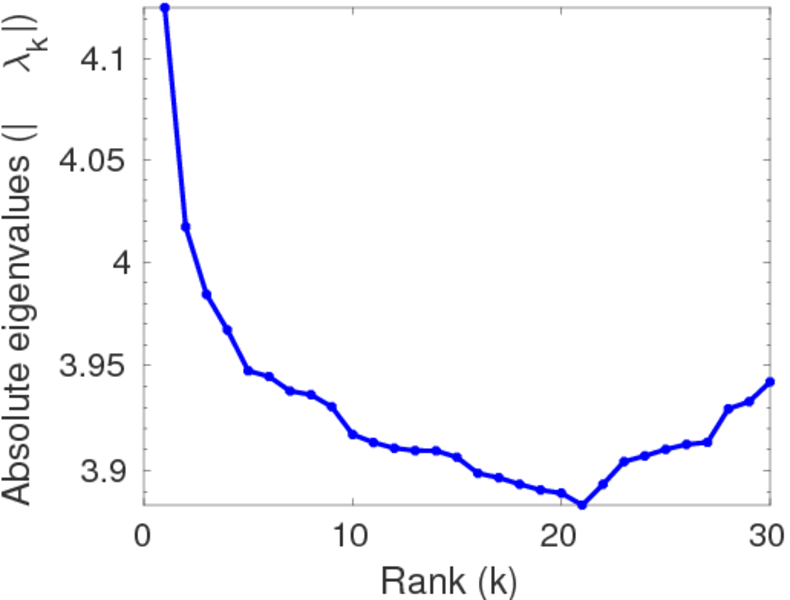
| Operator 2-norm | ν = | 4.125 49
|
| Cyclic eigenvalue | π = | 4.125 49
|
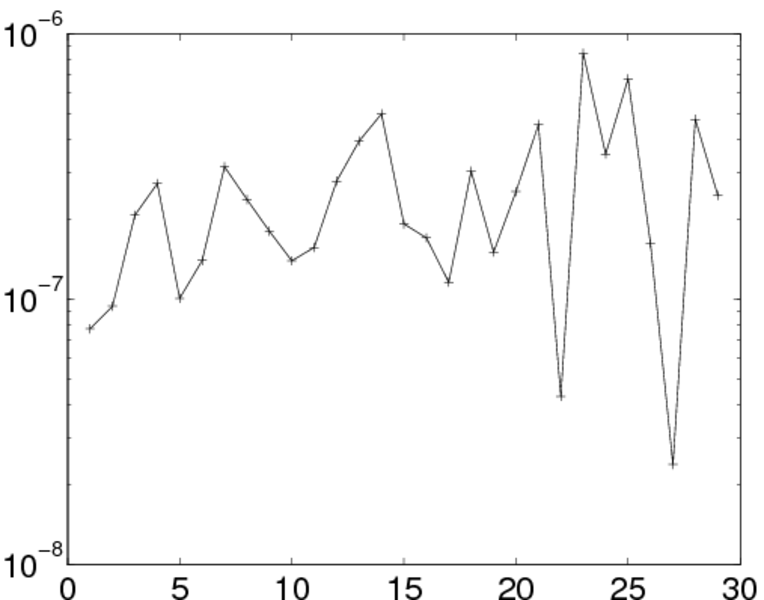
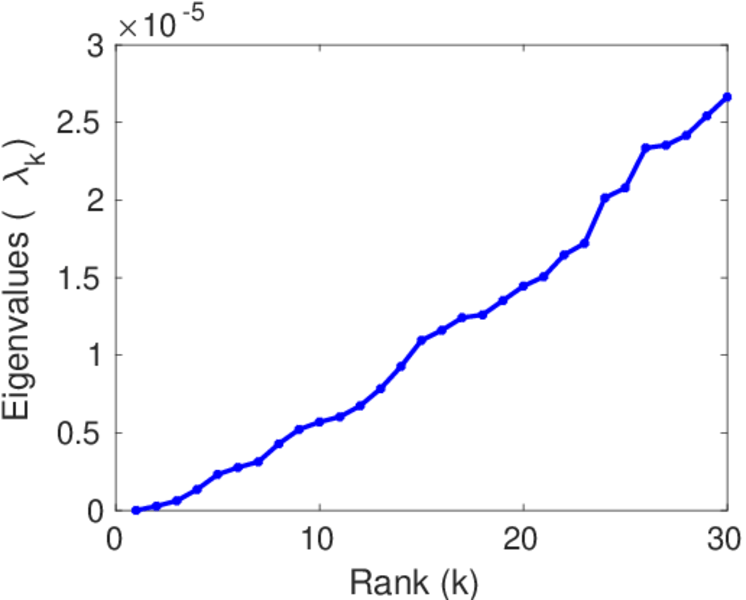
| Algebraic connectivity | a = | 3.856 63 × 10−7
|
| Non-bipartivity | bA = | 0.044 432 2
|
| Normalized non-bipartivity | bN = | 0.000 176 070
|
| Algebraic non-bipartivity | χ = | 0.000 350 119
|
| Spectral bipartite frustration | bK = | 3.485 61 × 10−5
|
| Controllability | C = | 106,647
|
| Relative controllability | Cr = | 0.099 635 1
|
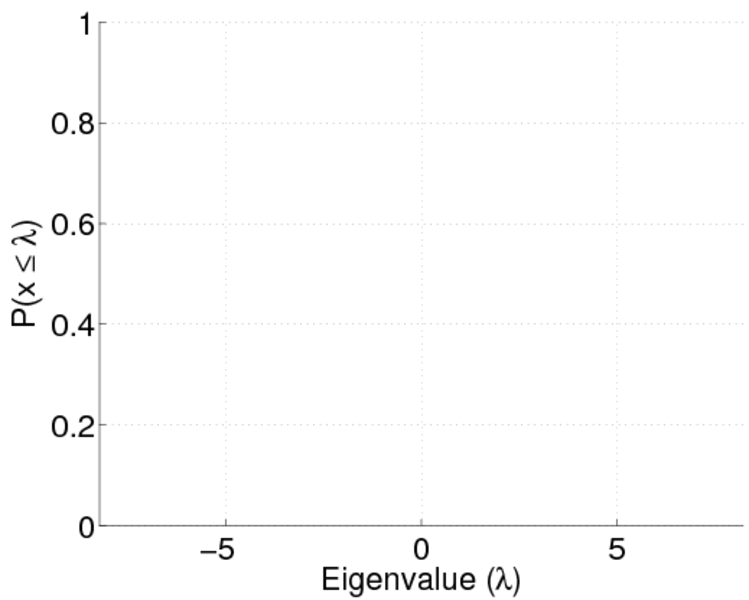
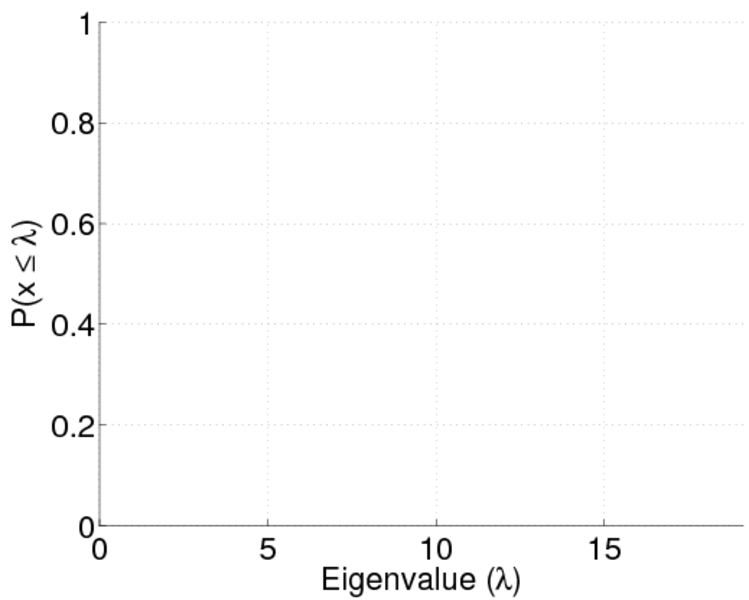
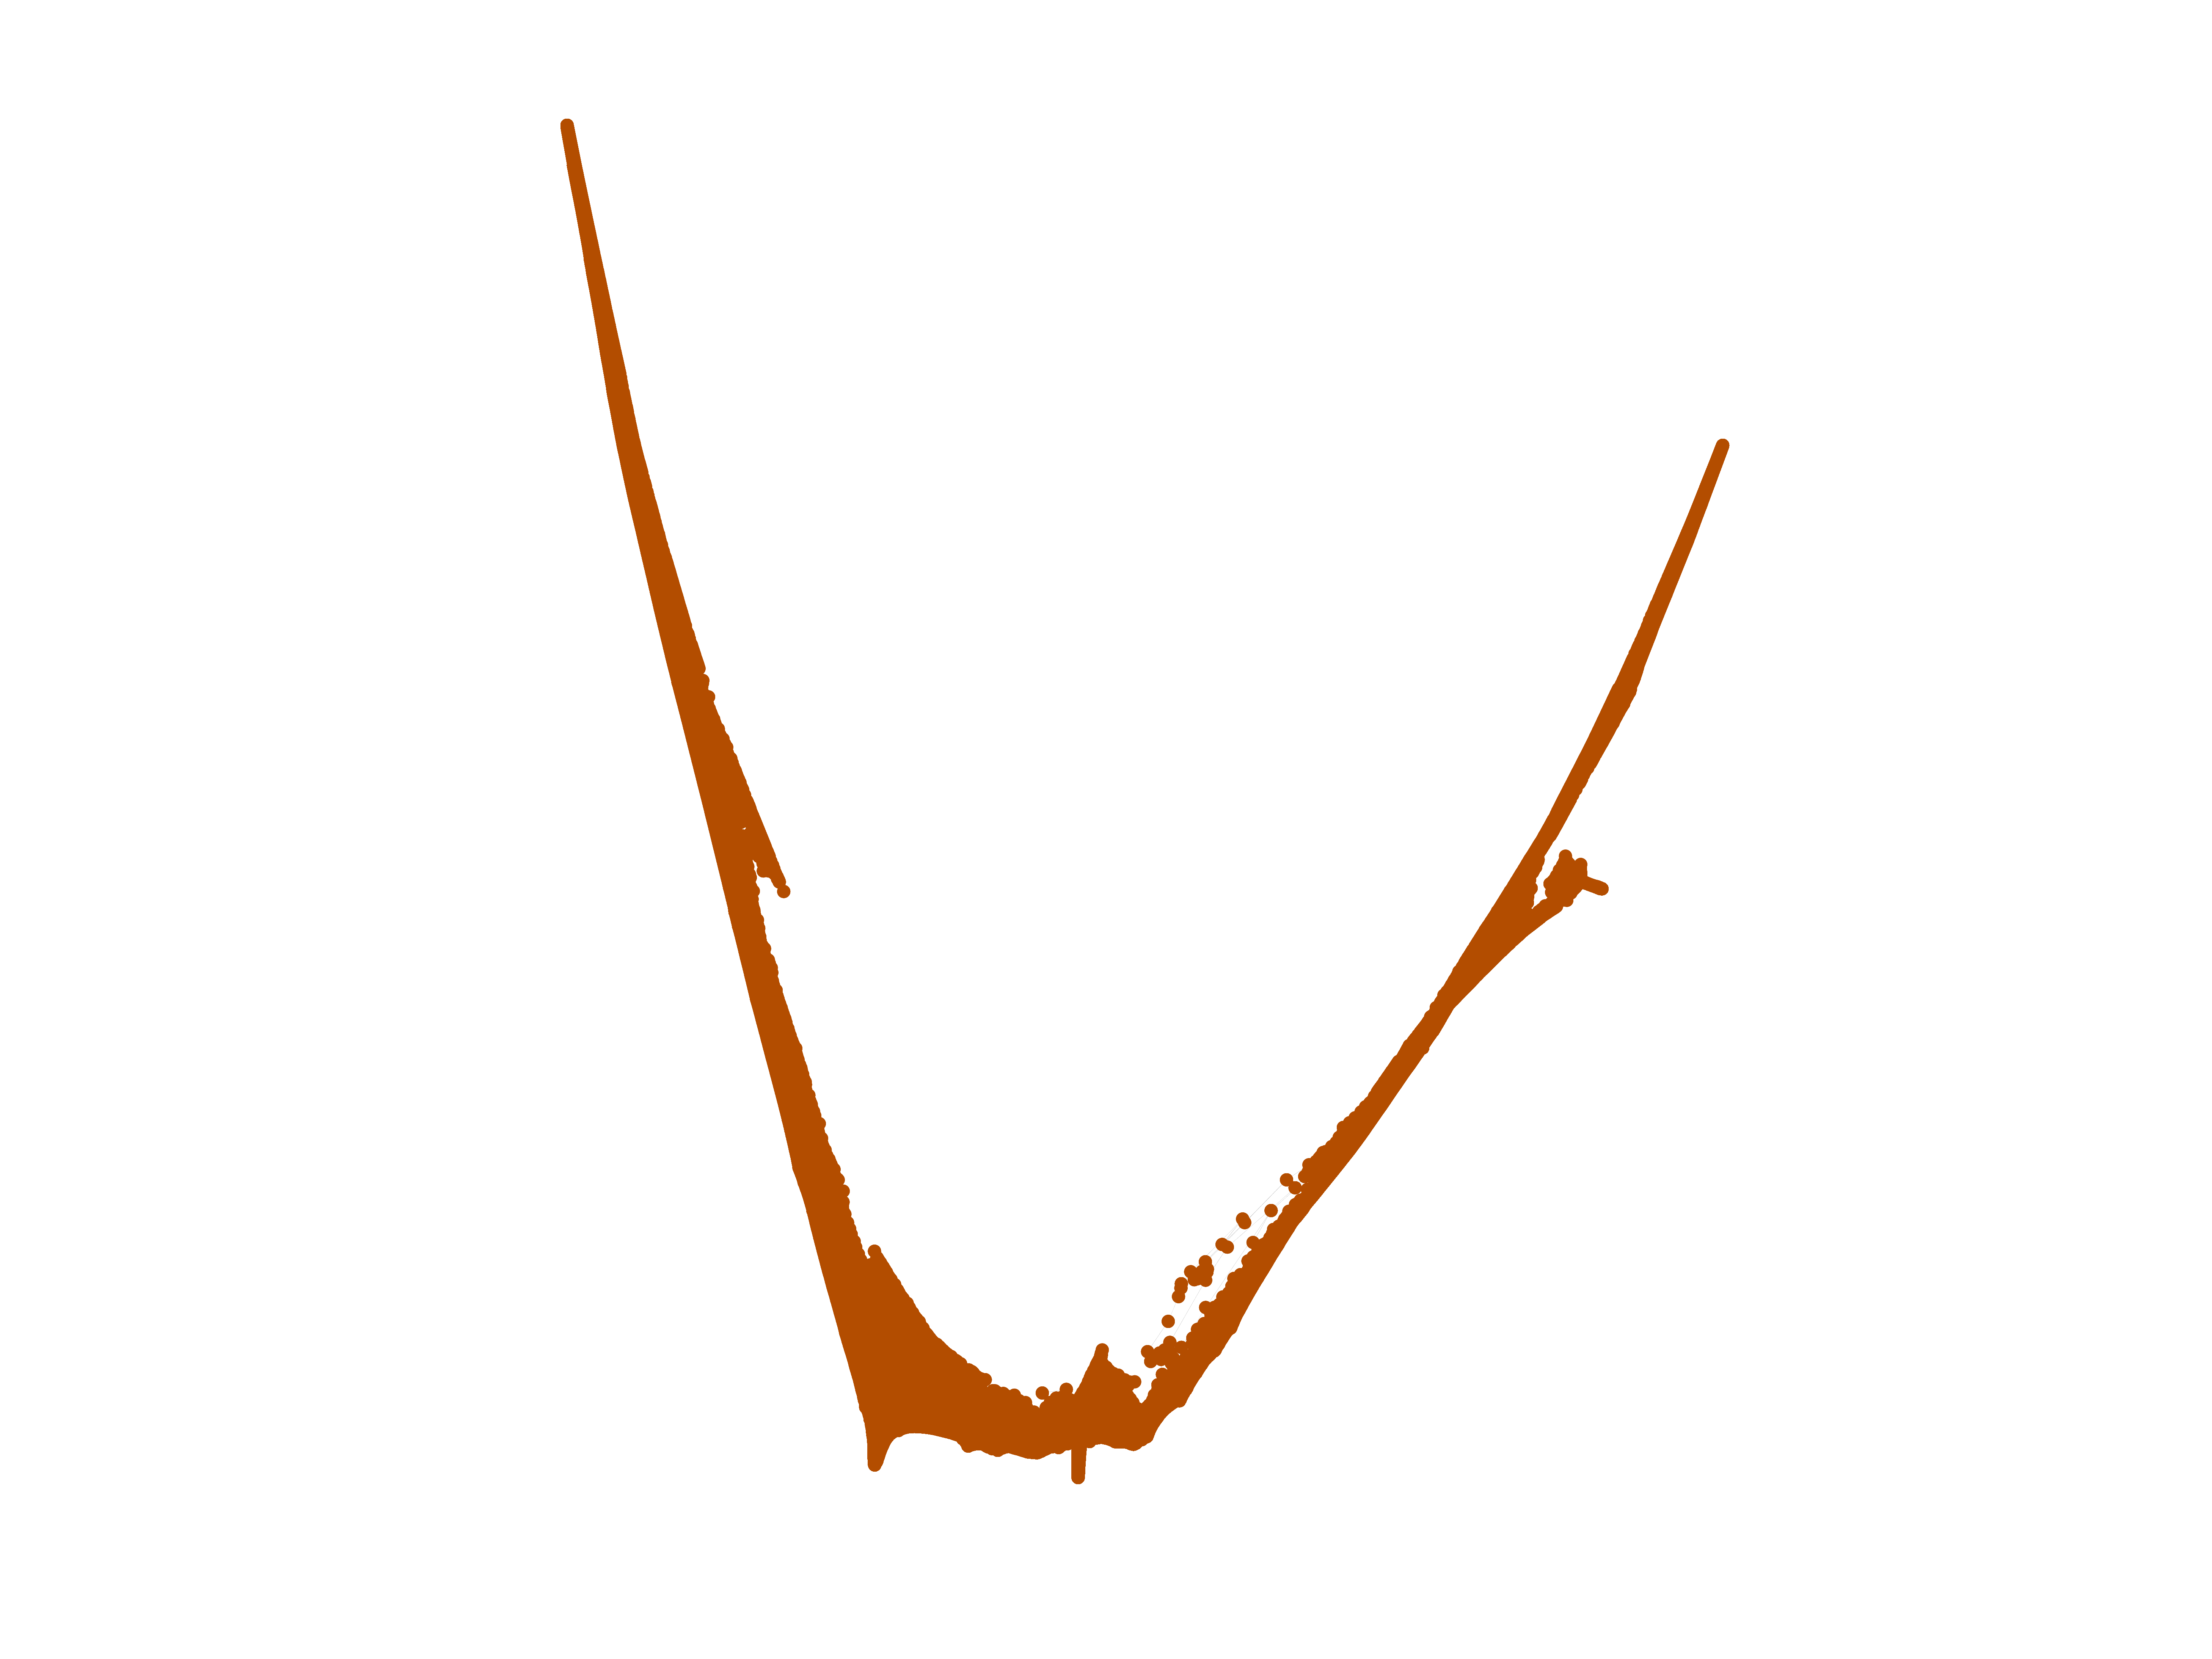
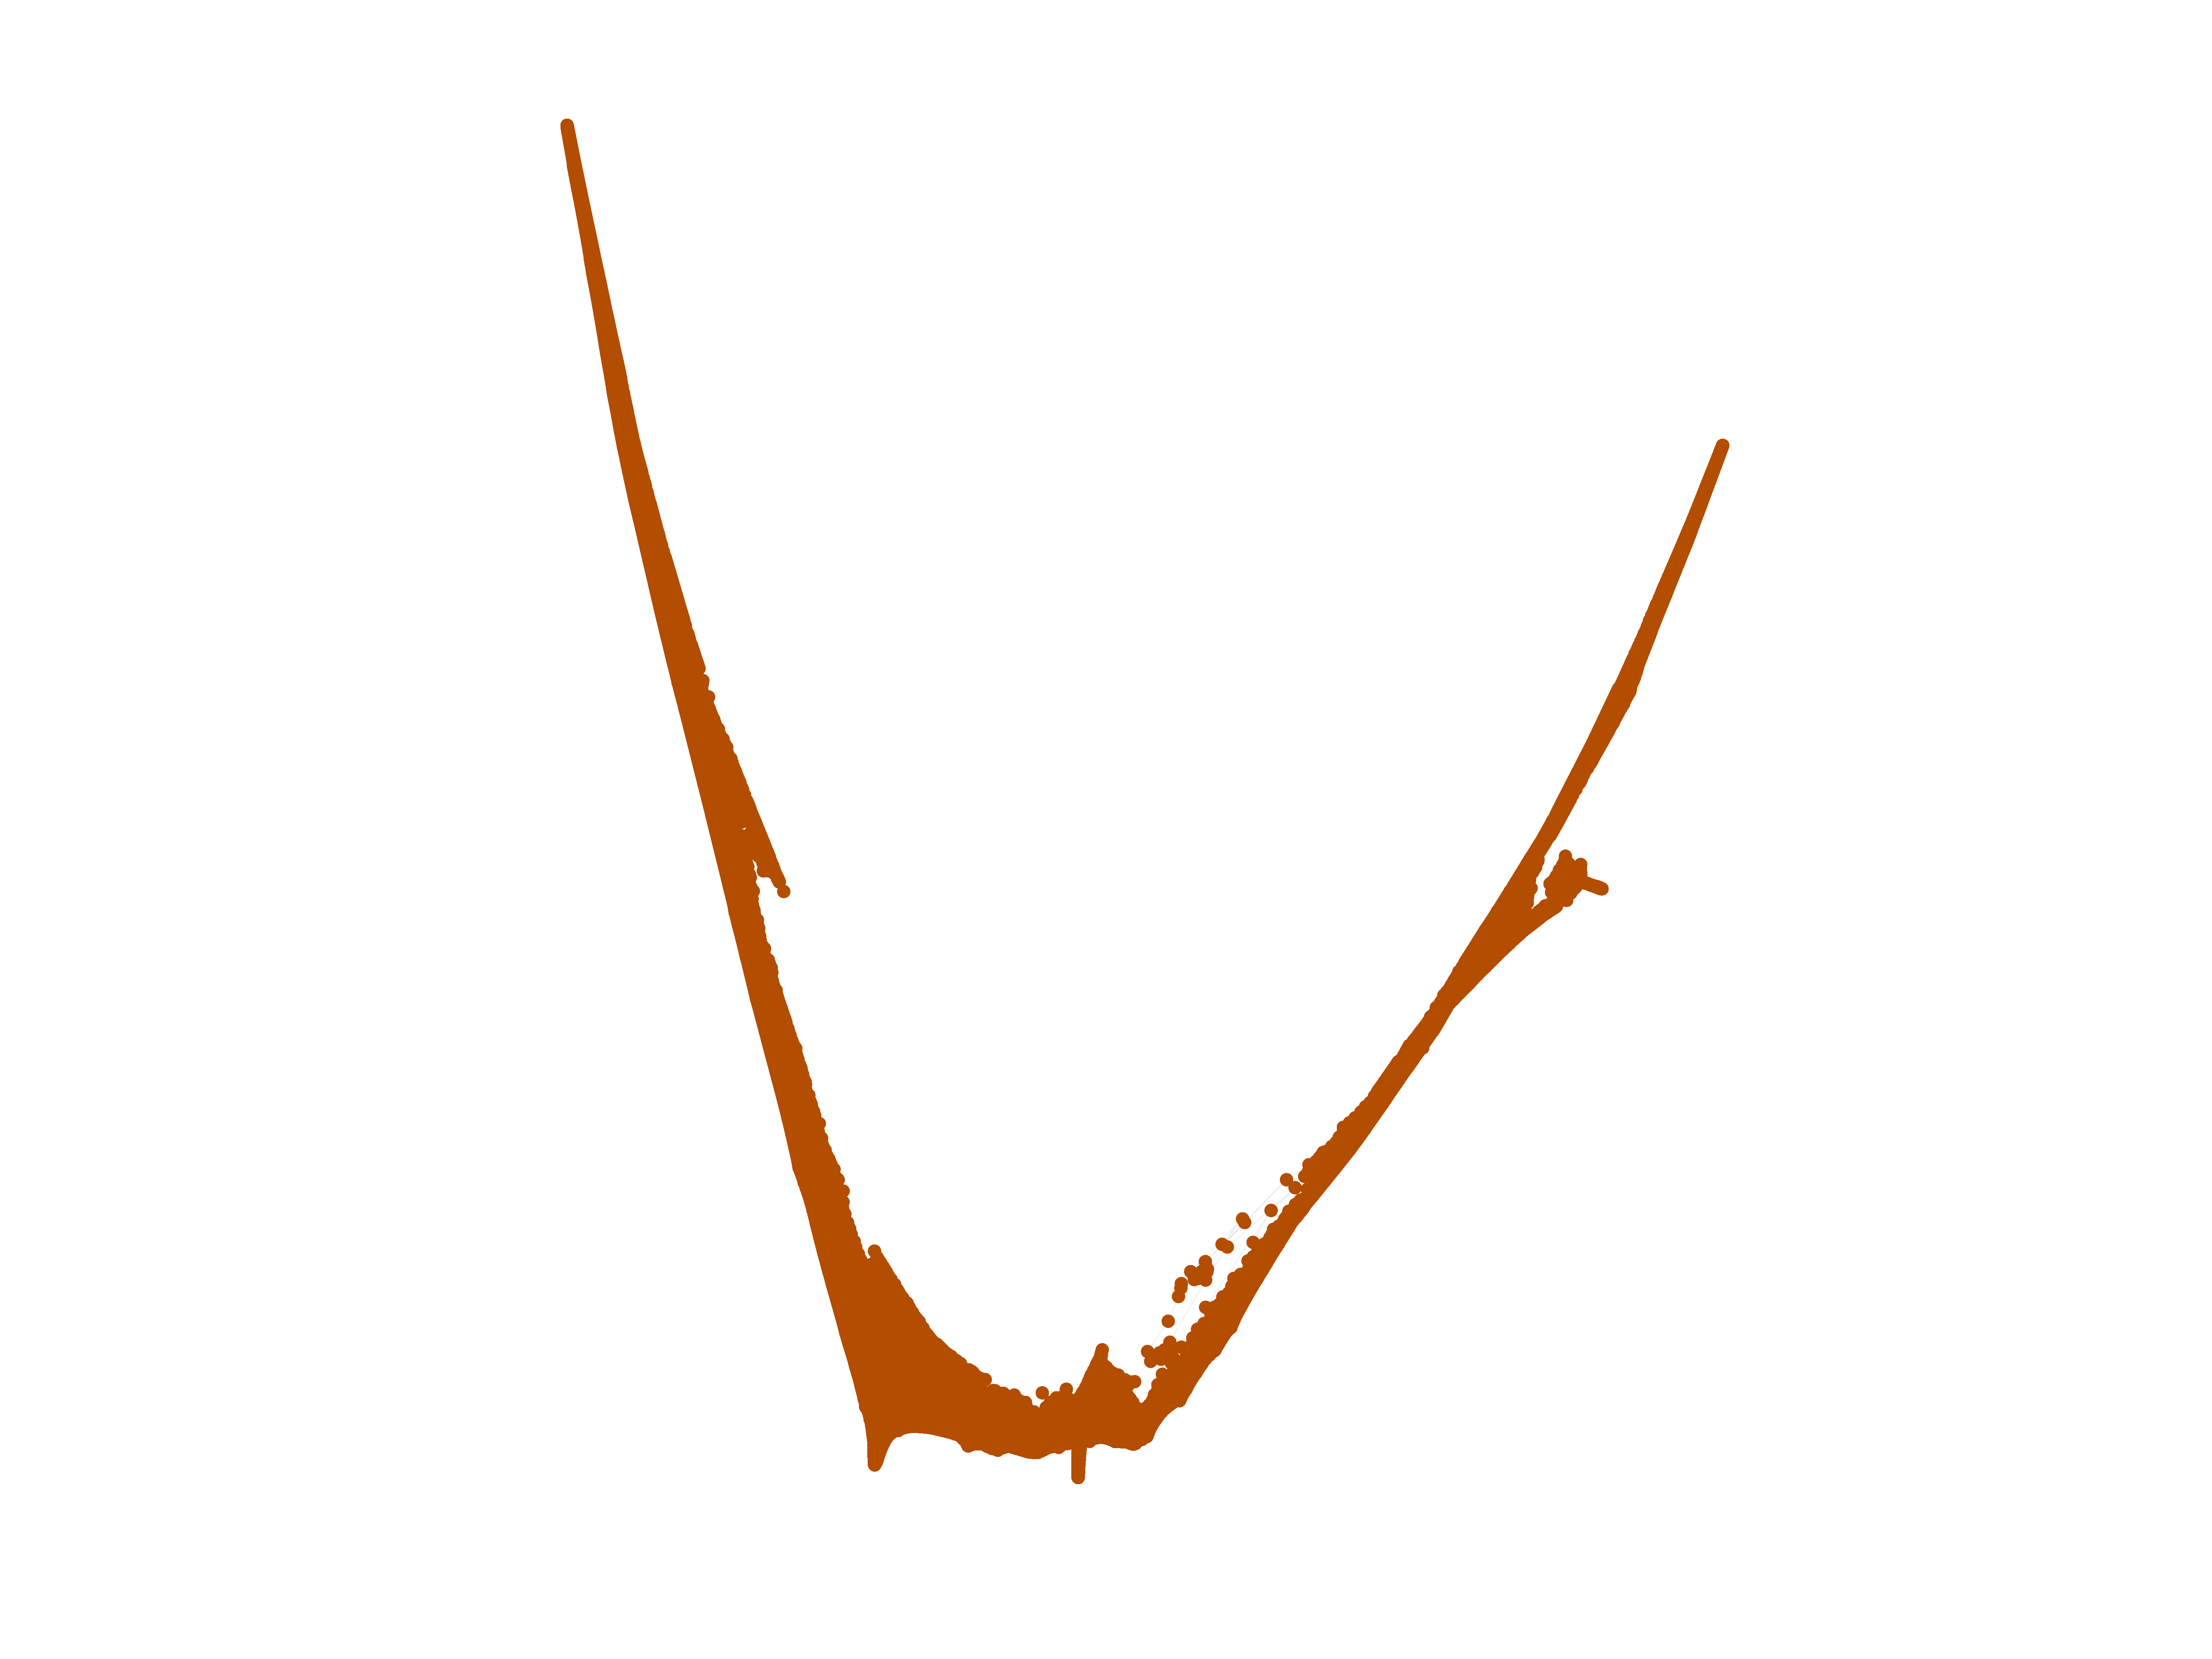
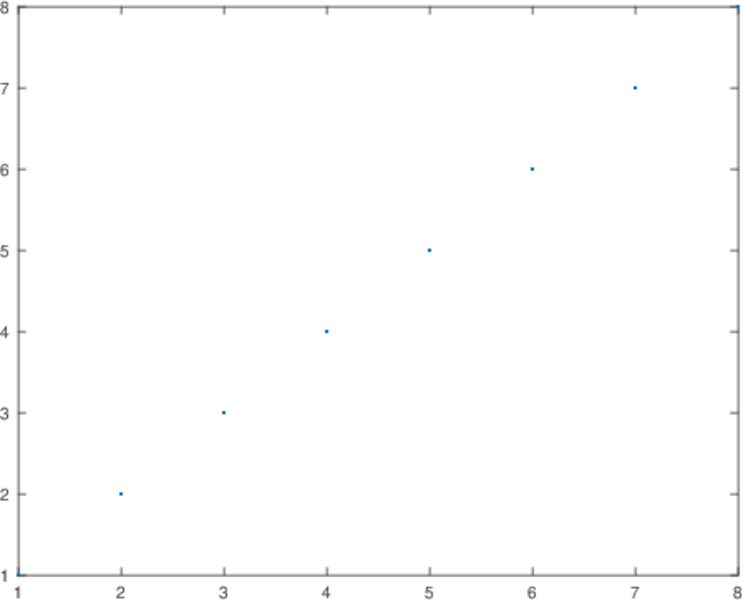
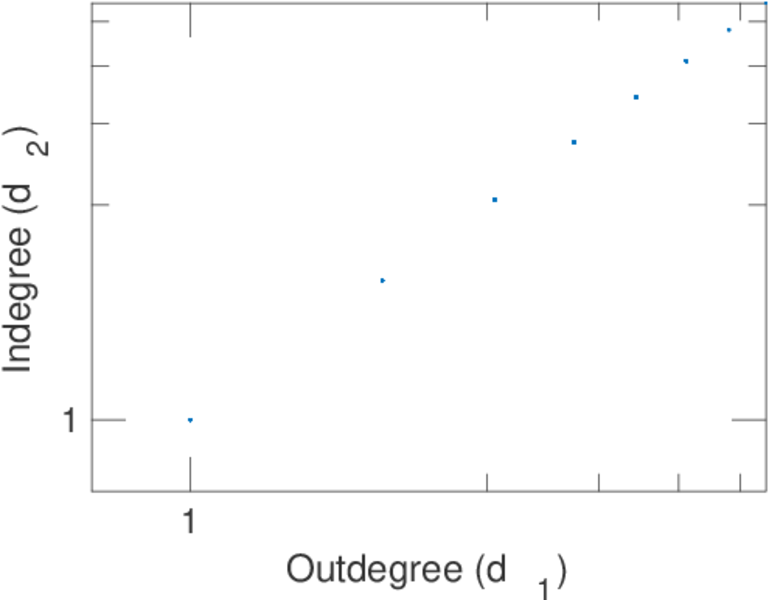
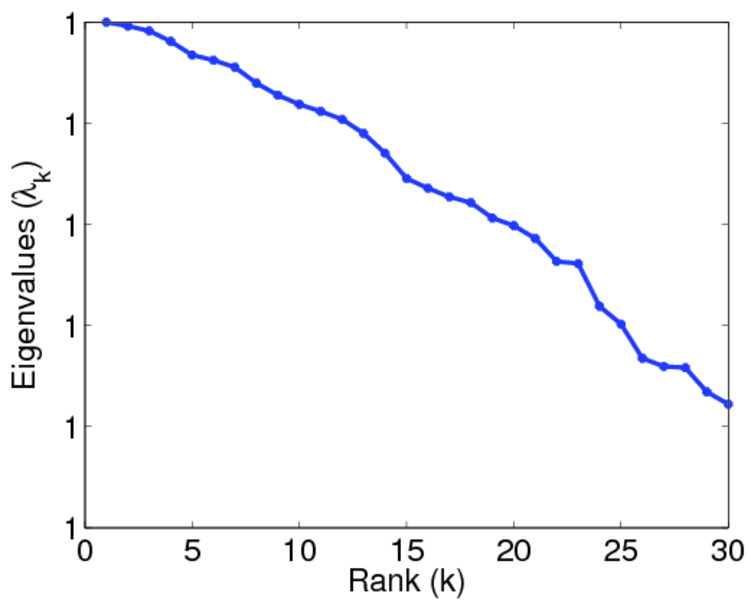
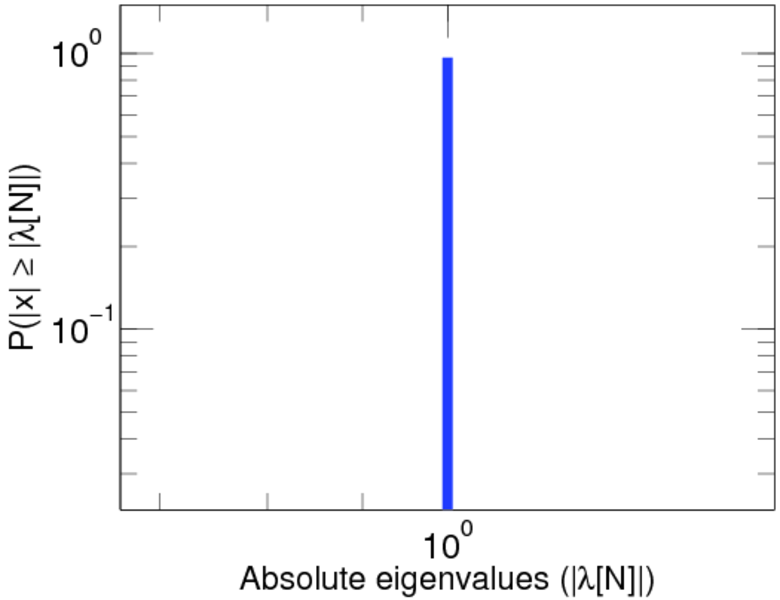
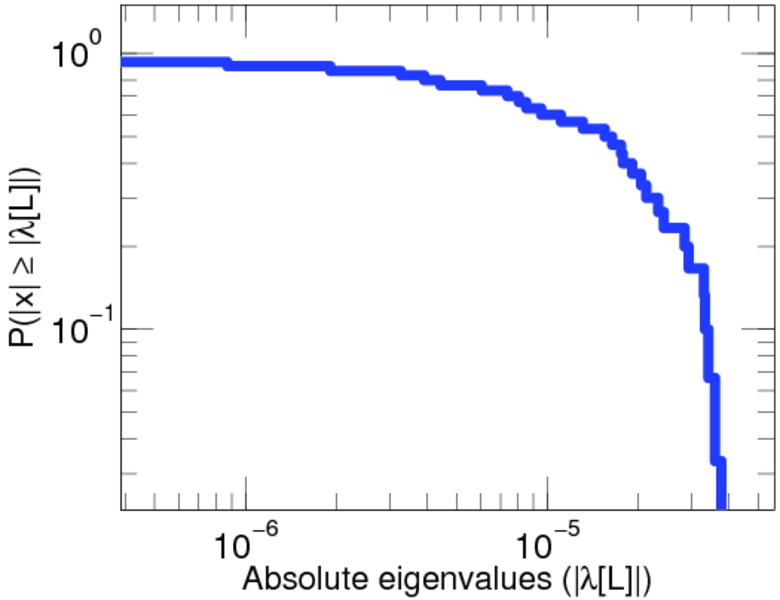
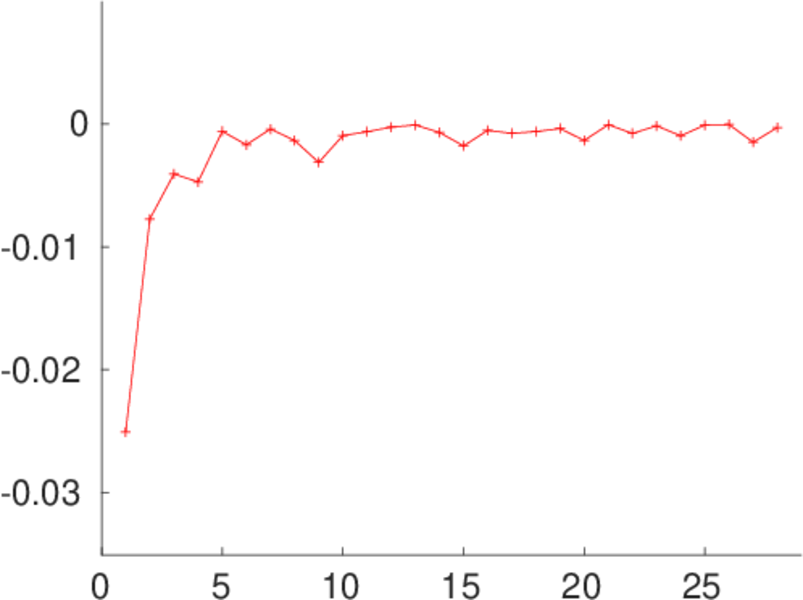
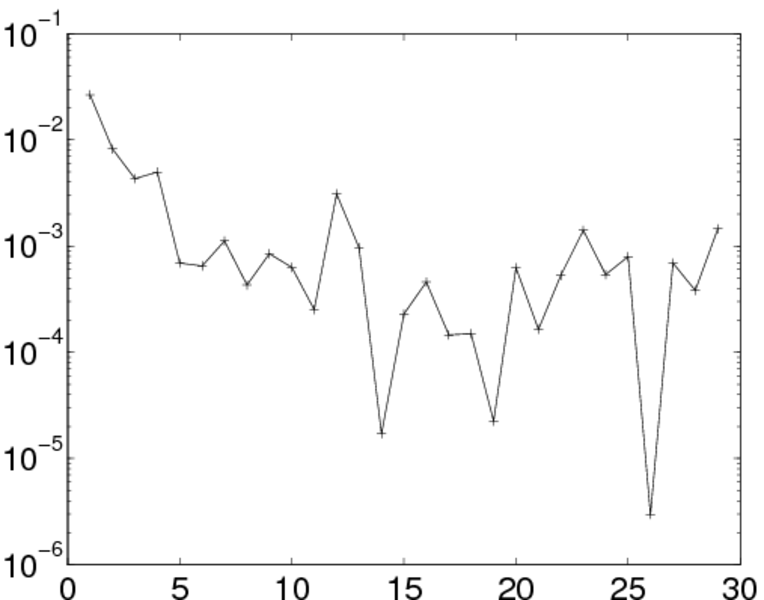
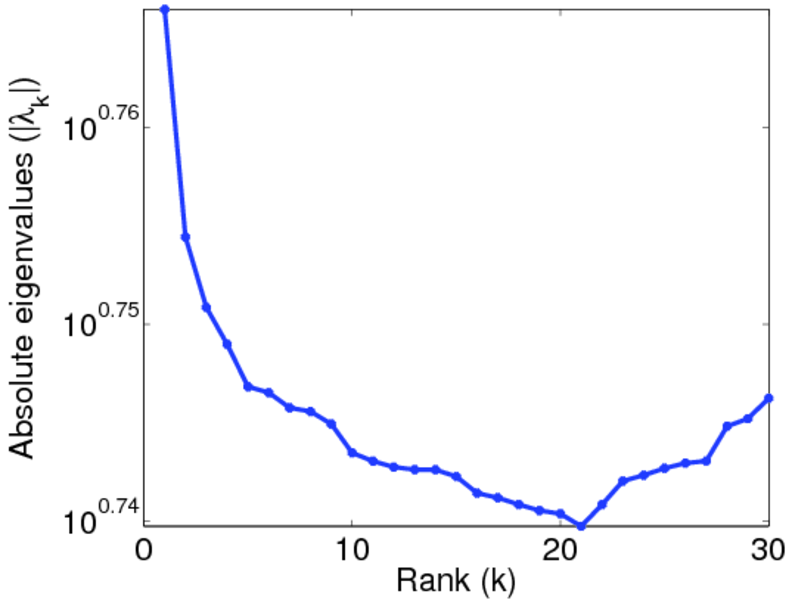
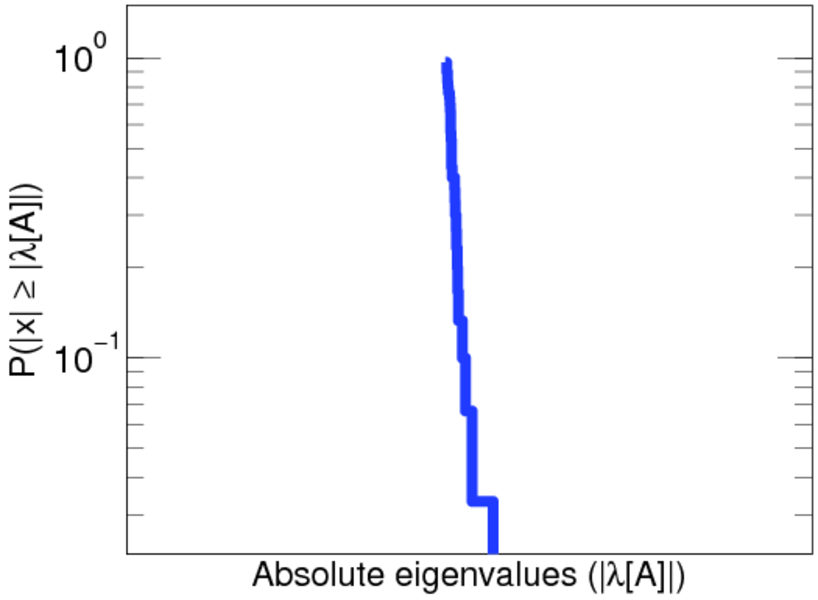
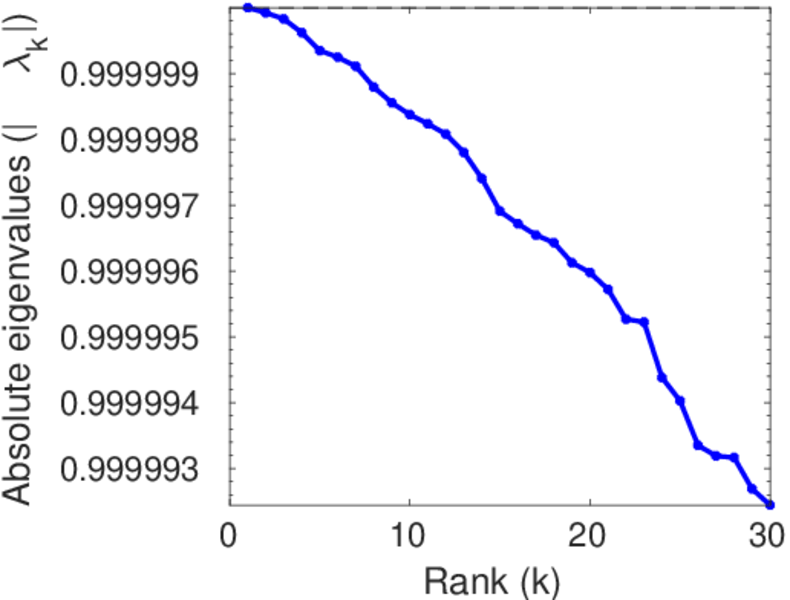
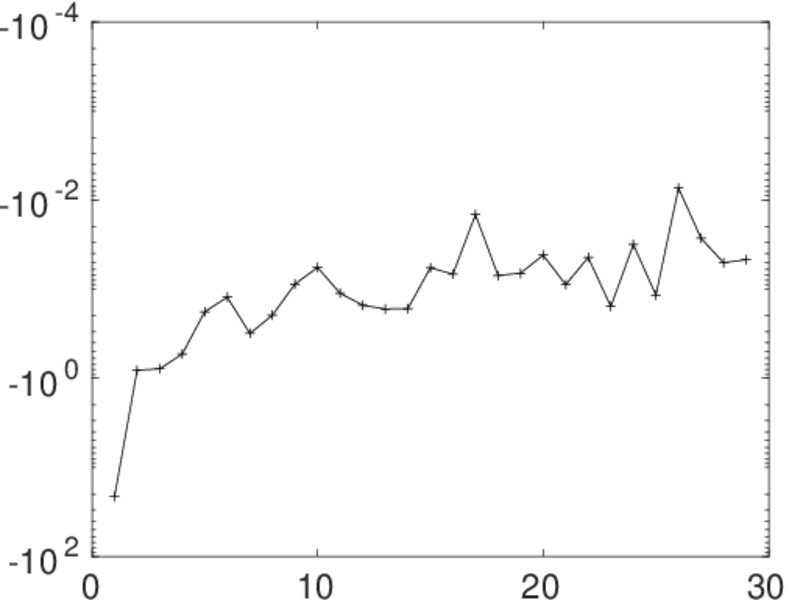
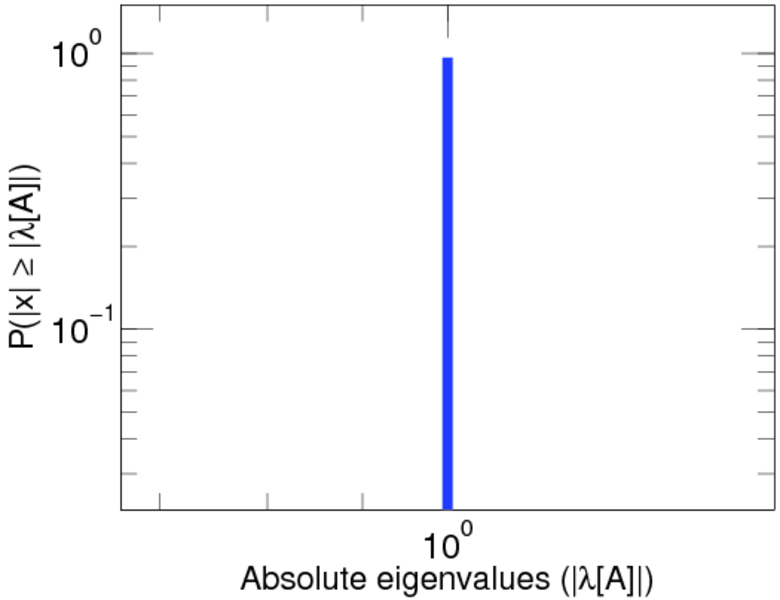
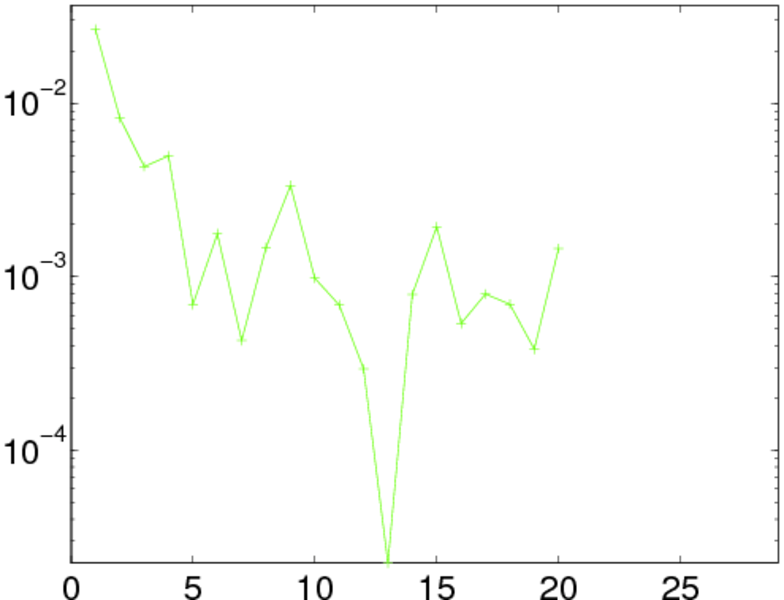
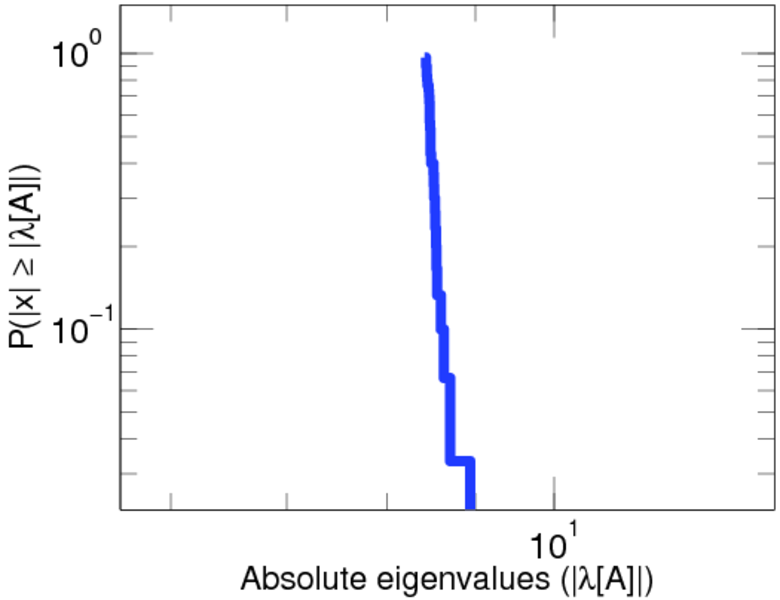
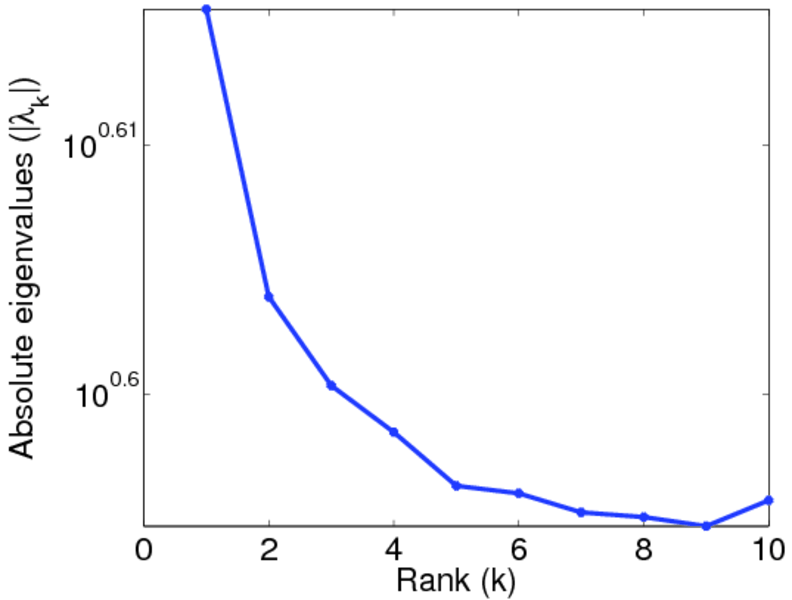
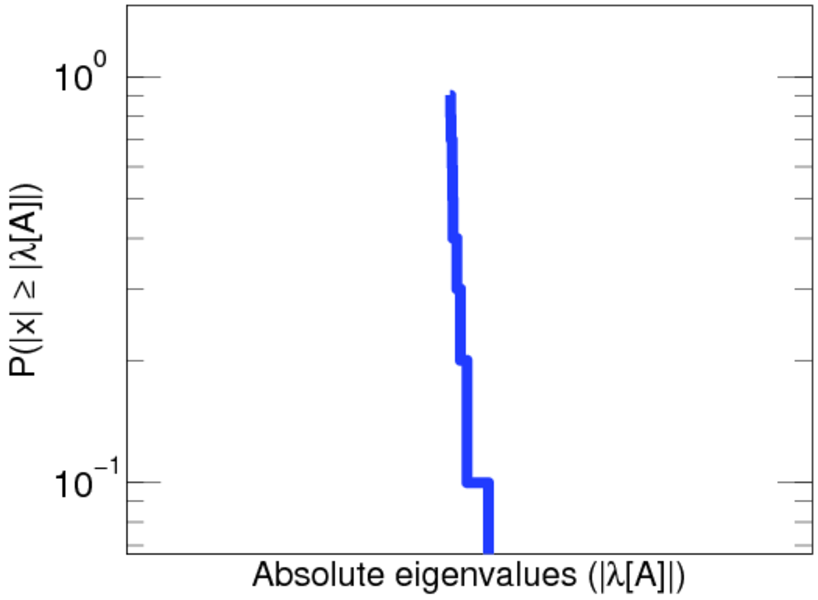
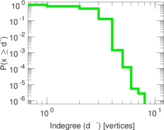
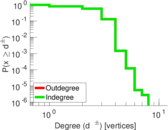
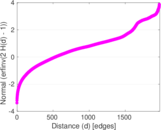
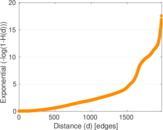
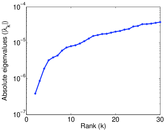
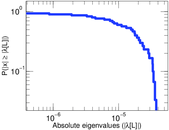
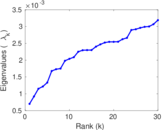
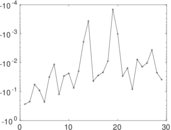
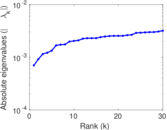
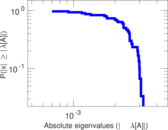
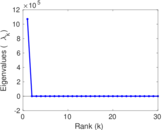
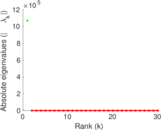
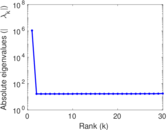
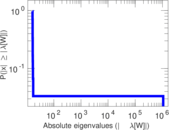
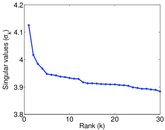
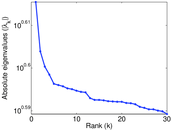
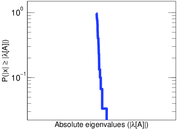
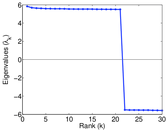
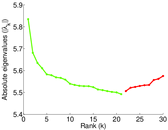
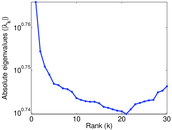
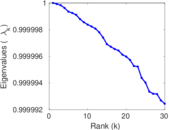
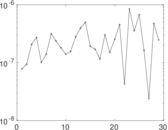
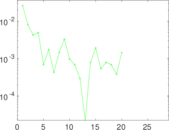
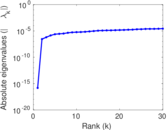
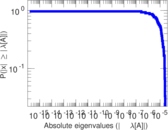
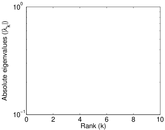
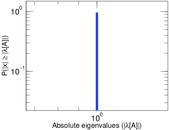
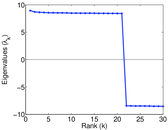
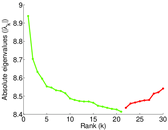
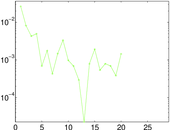
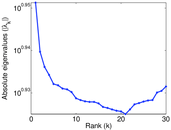
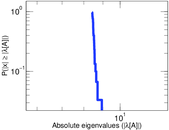
Plots


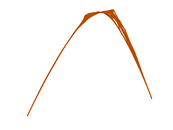

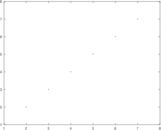
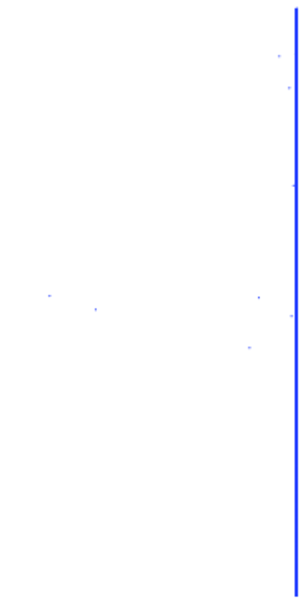
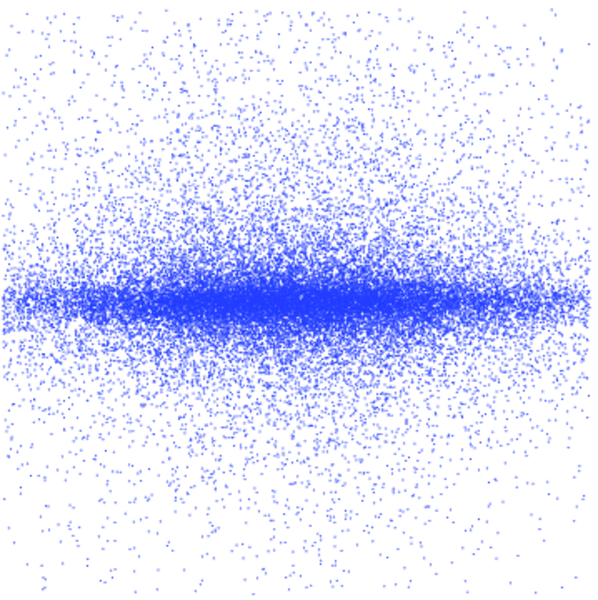
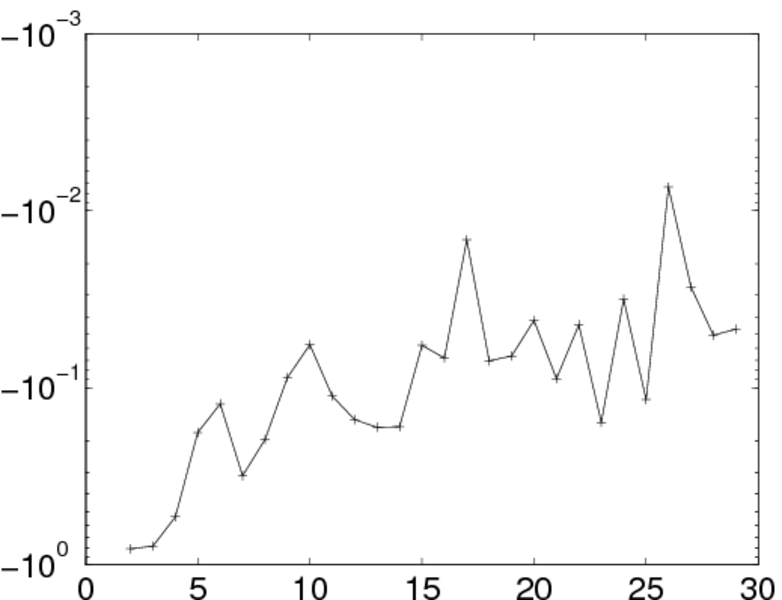
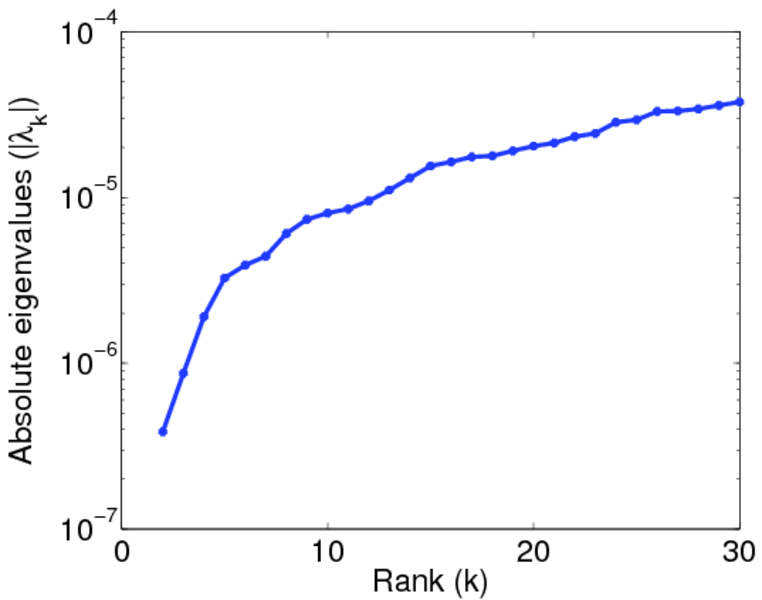
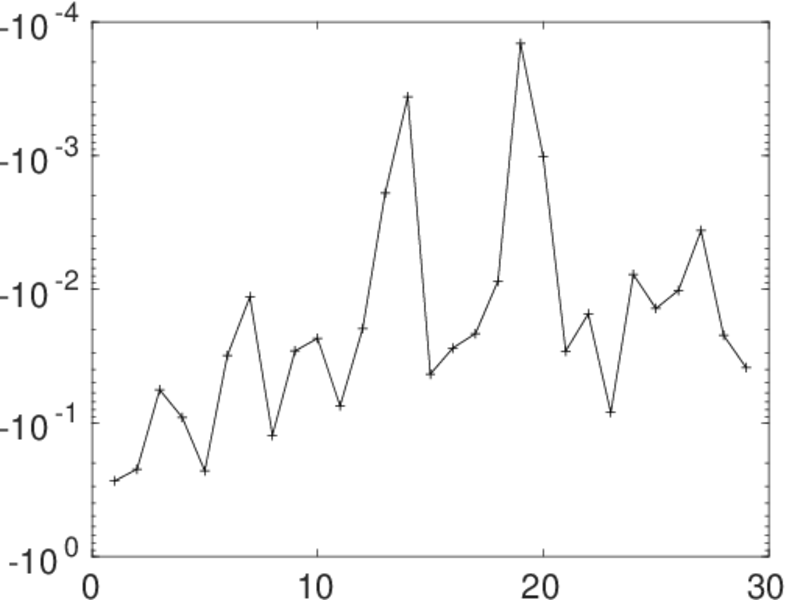
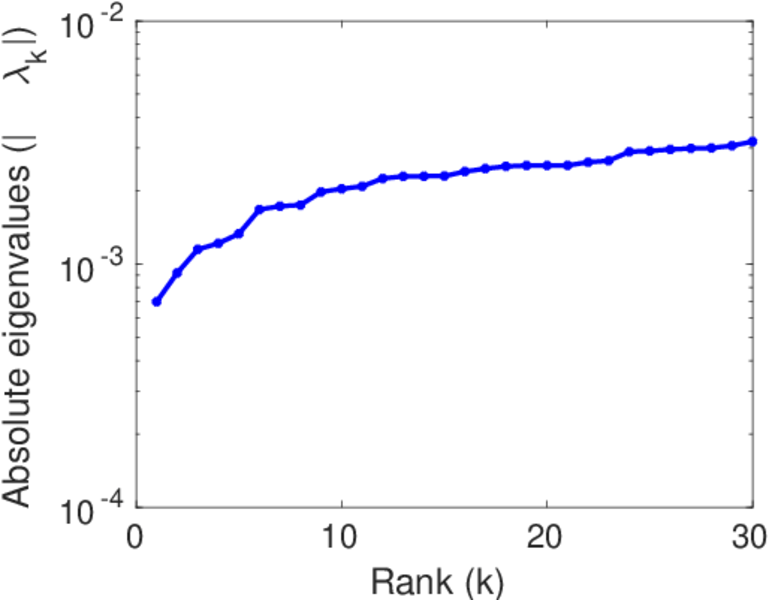
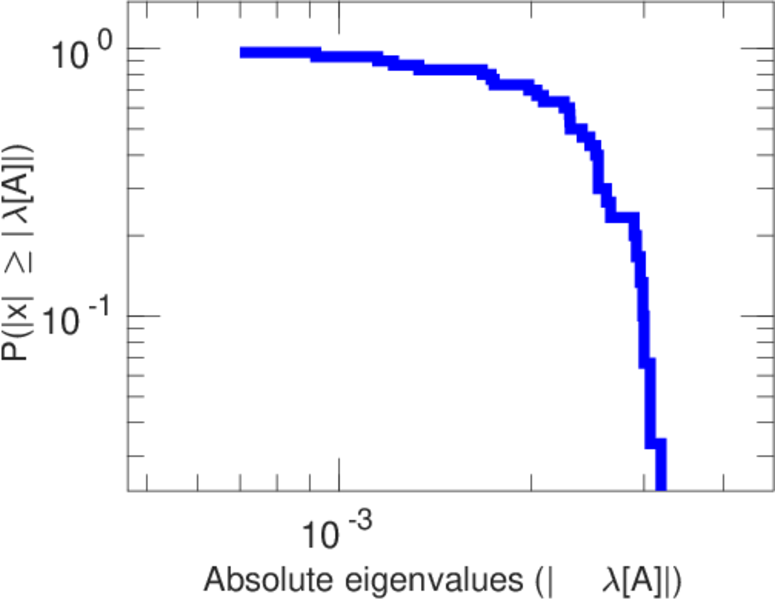
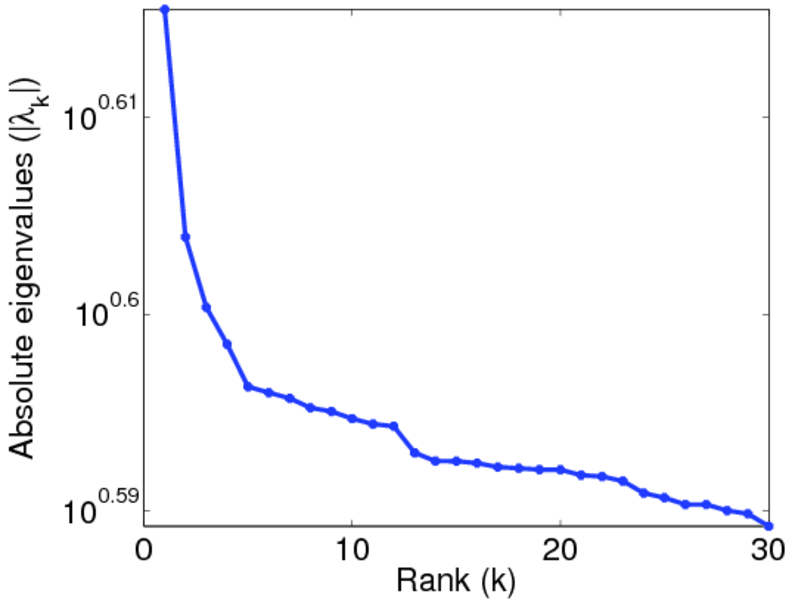
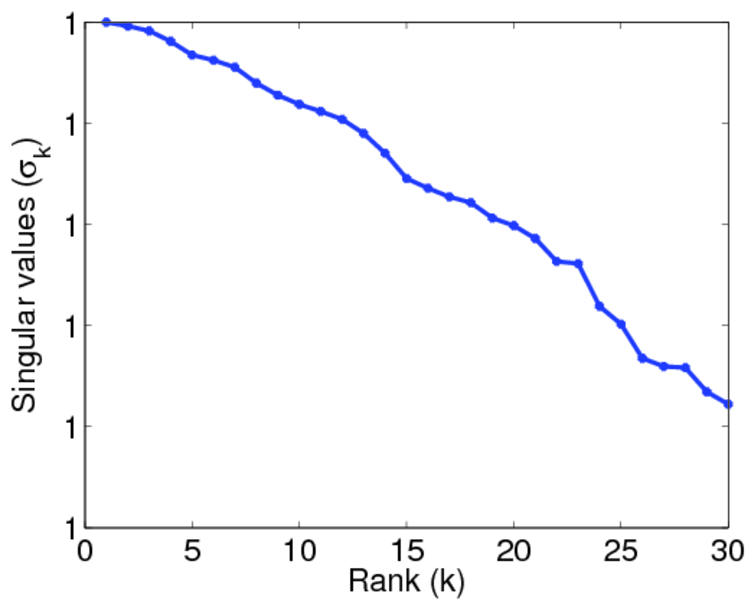
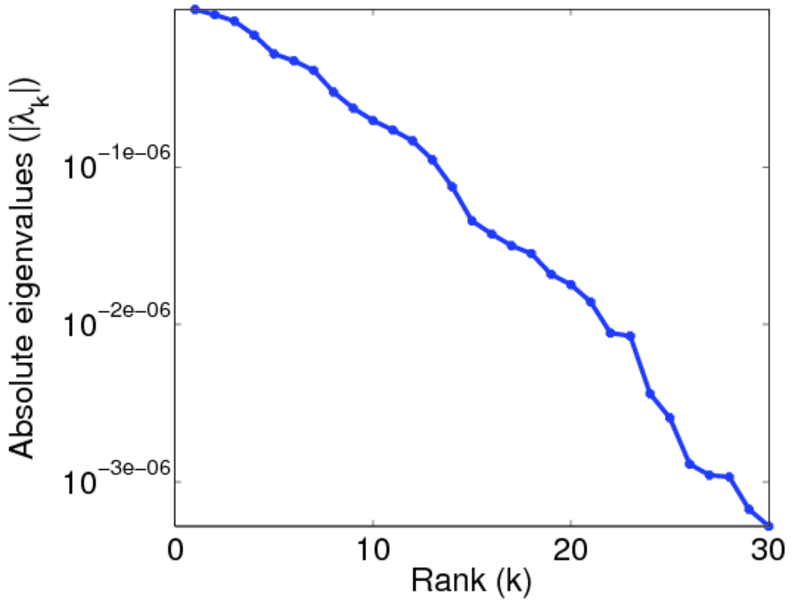
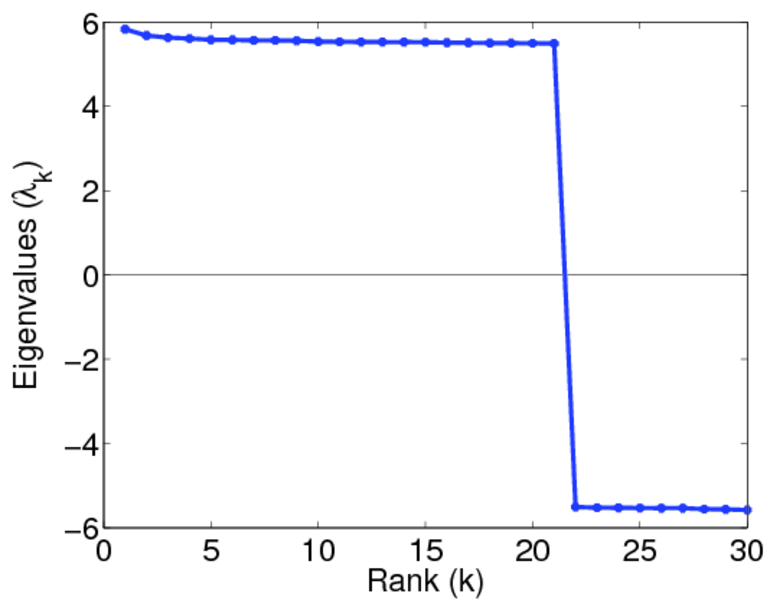
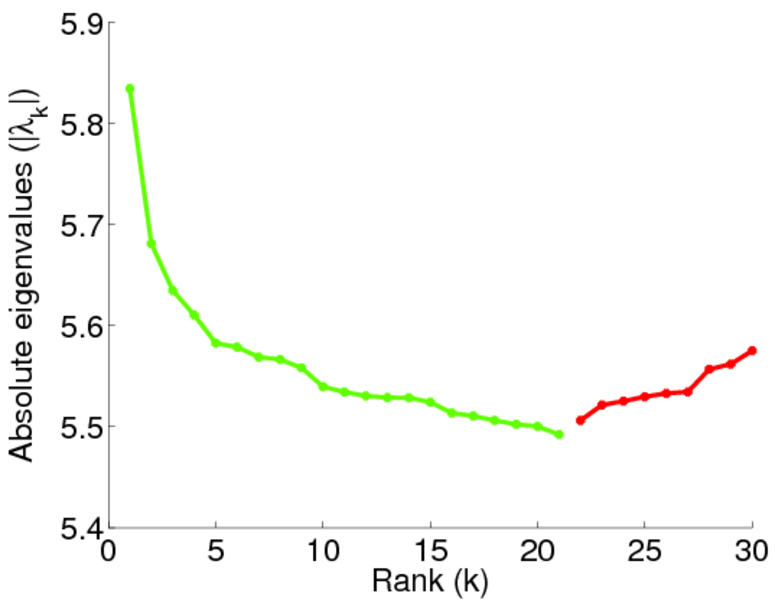
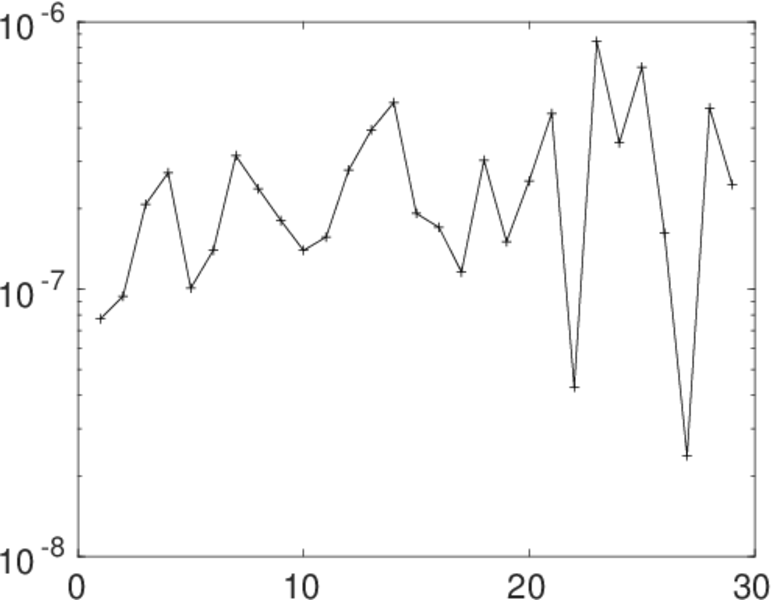
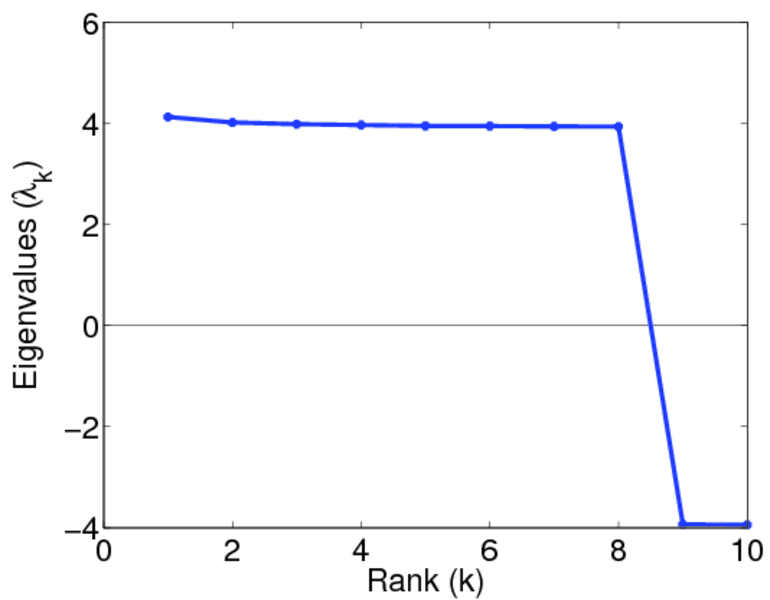
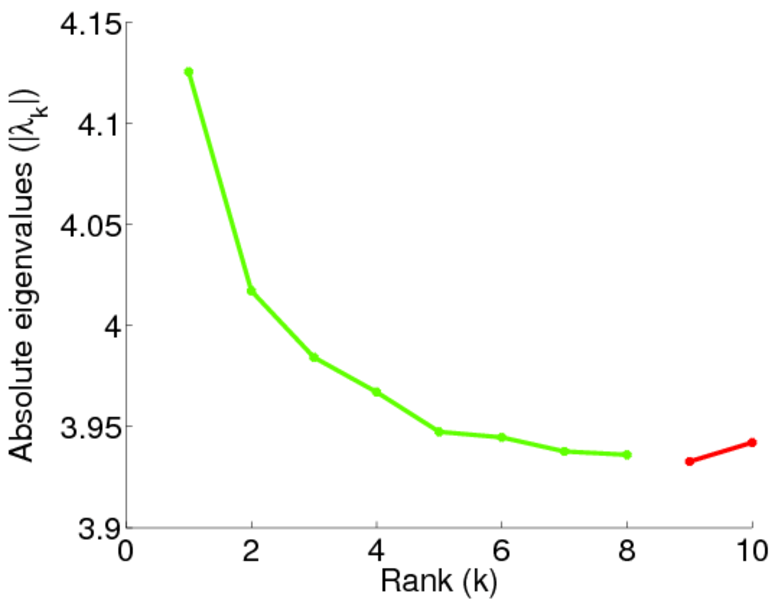
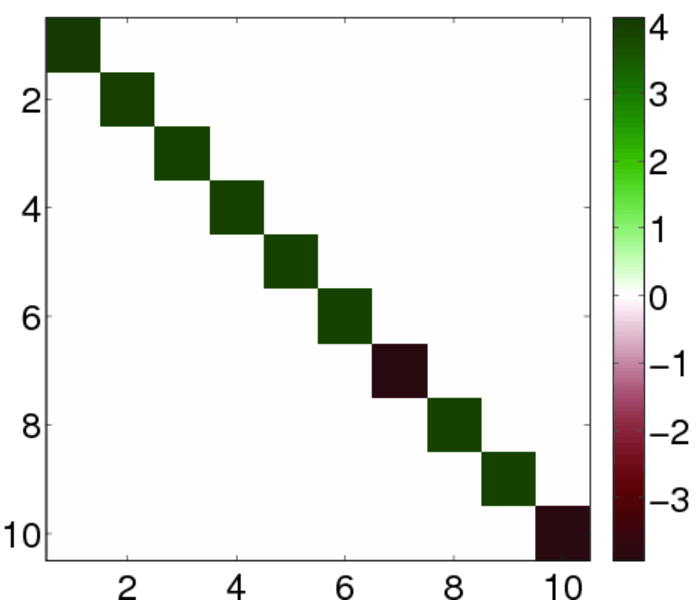
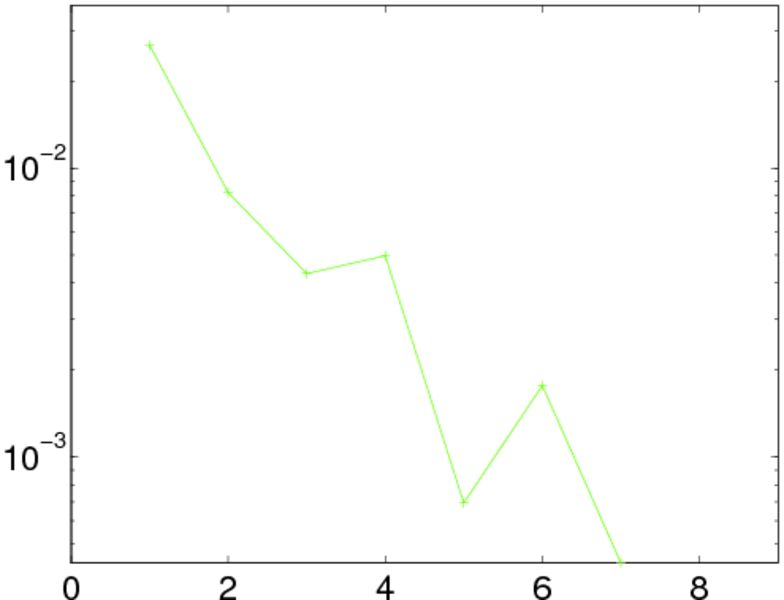
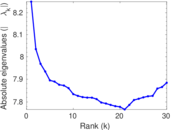
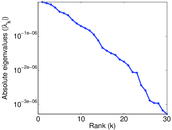
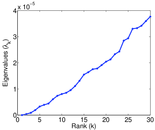
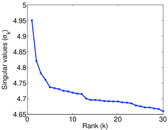
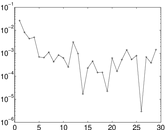
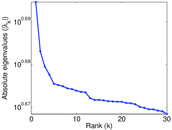
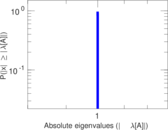
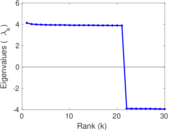
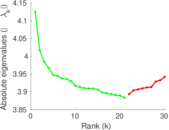
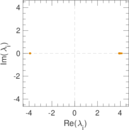
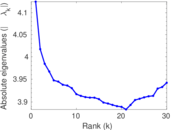
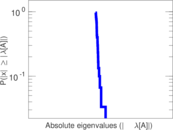
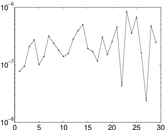
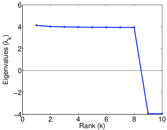
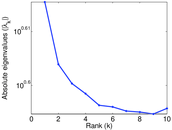
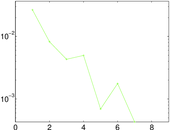
Matrix decompositions plots


Downloads
References
|
[1]
|
Jérôme Kunegis.
KONECT – The Koblenz Network Collection.
In Proc. Int. Conf. on World Wide Web Companion, pages
1343–1350, 2013.
[ http ]
|
 KONECT ‣ Networks ‣
Buy Me a Coffee
KONECT ‣ Networks ‣
Buy Me a Coffee