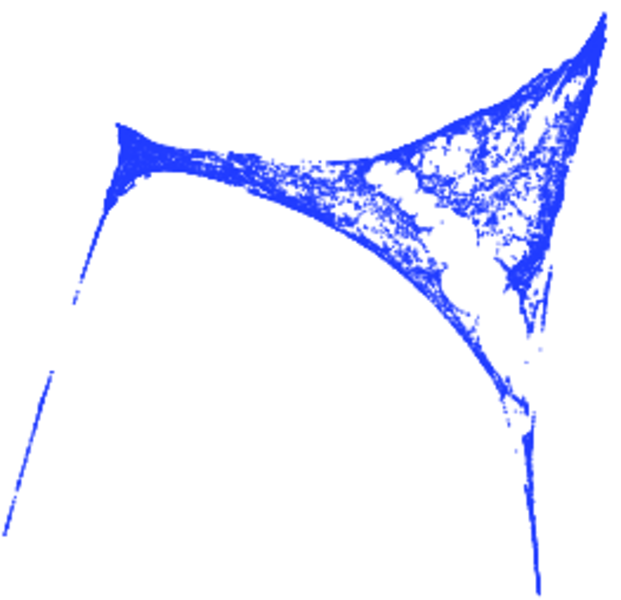
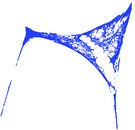
Northeast USA
This is the directed road network from the 9th DIMACS Implementation Challenge,
for the area "Northeast USA".
Metadata
Statistics
| Size | n = | 1,524,453
|
| Volume | m = | 3,868,020
|
| Loop count | l = | 0
|
| Wedge count | s = | 3,662,100
|
| Claw count | z = | 26,925,368
|
| Cross count | x = | 25,629,408
|
| Triangle count | t = | 37,012
|
| Square count | q = | 148,092
|
| 4-Tour count | T4 = | 19,701,156
|
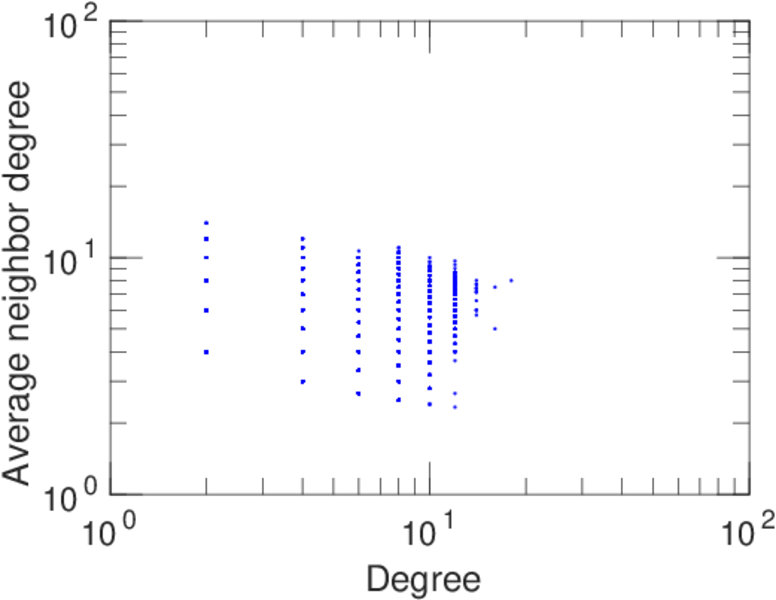
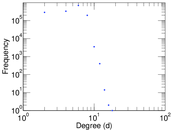
| Maximum degree | dmax = | 18
|
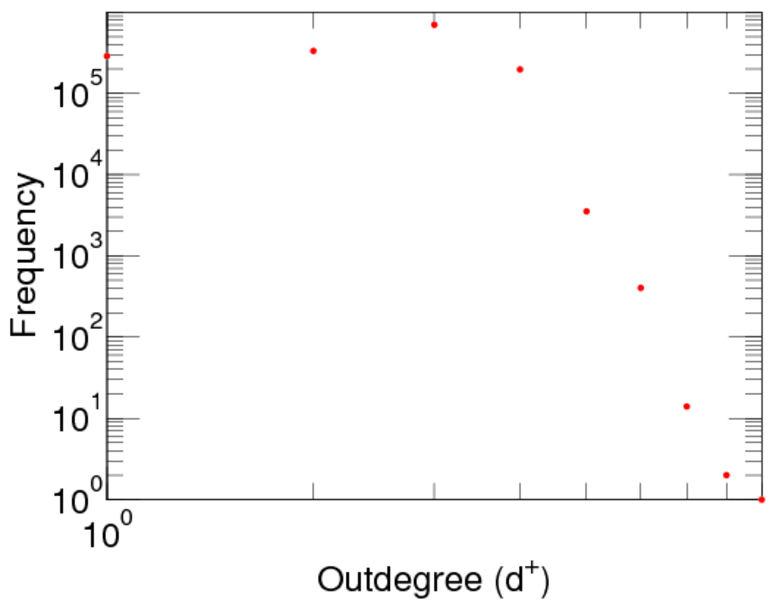
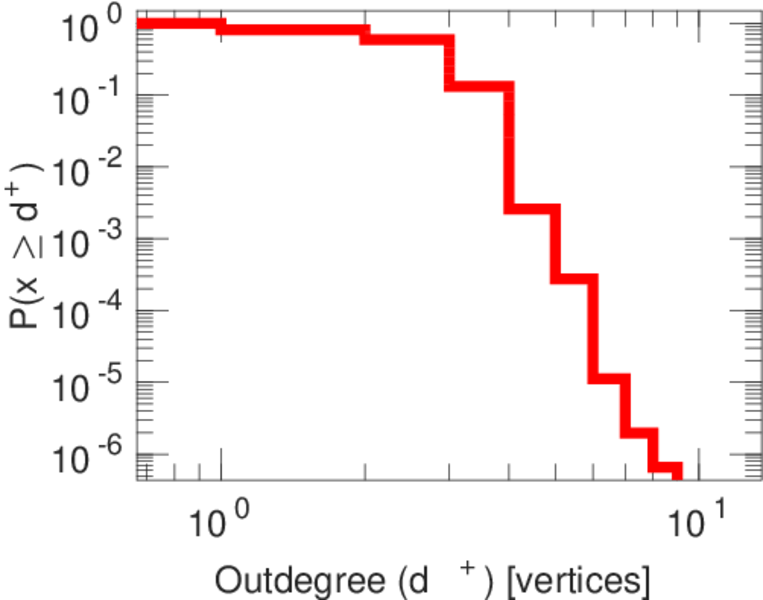
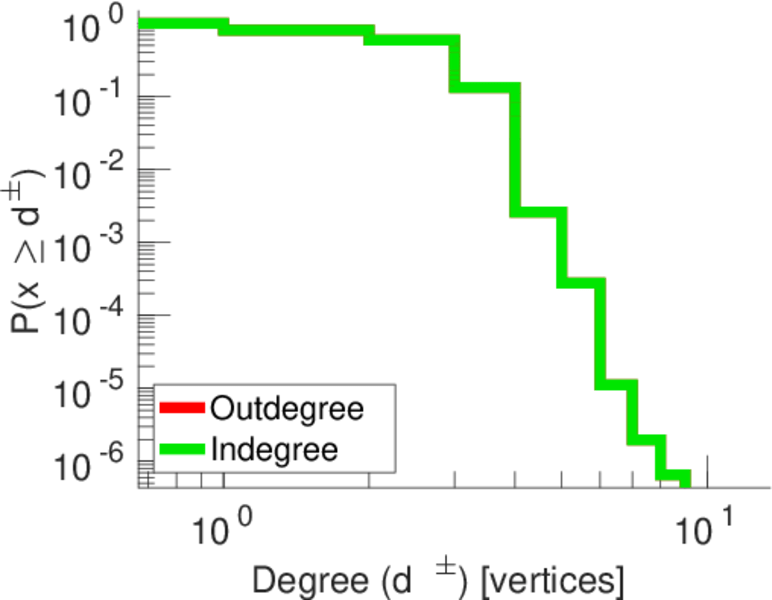
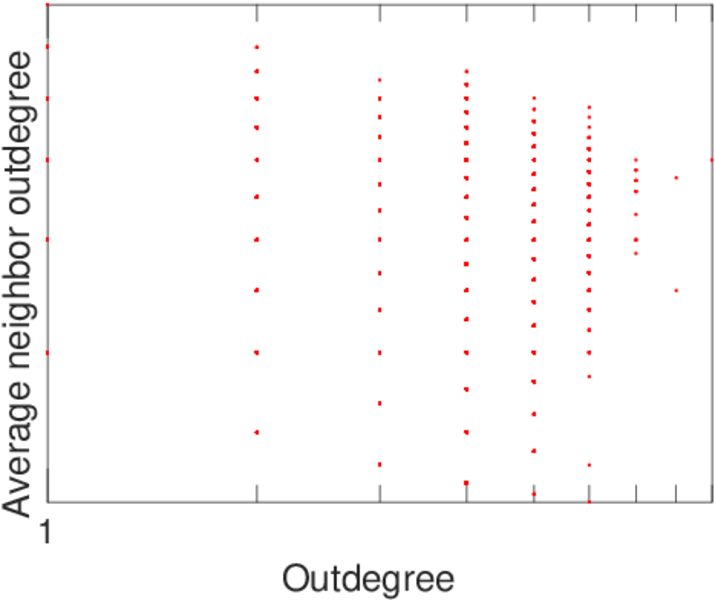
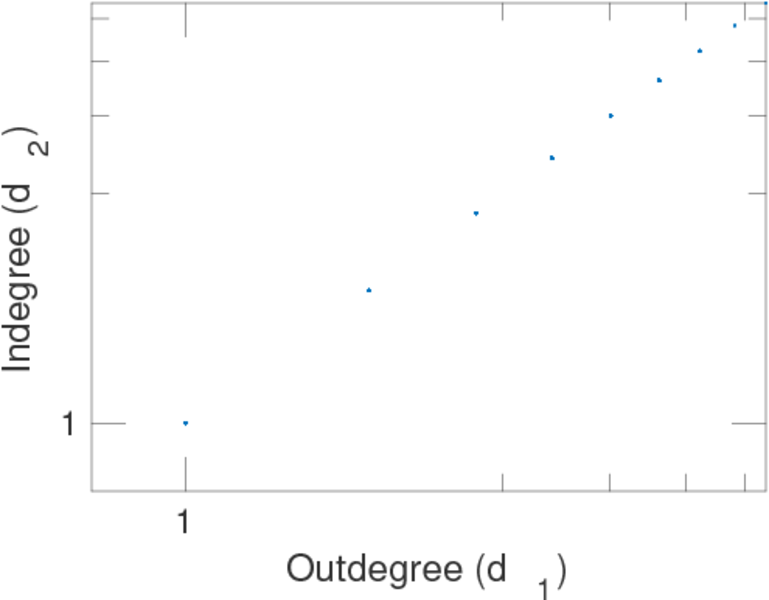
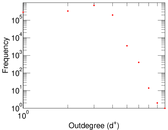
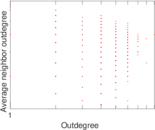
| Maximum outdegree | d+max = | 9
|
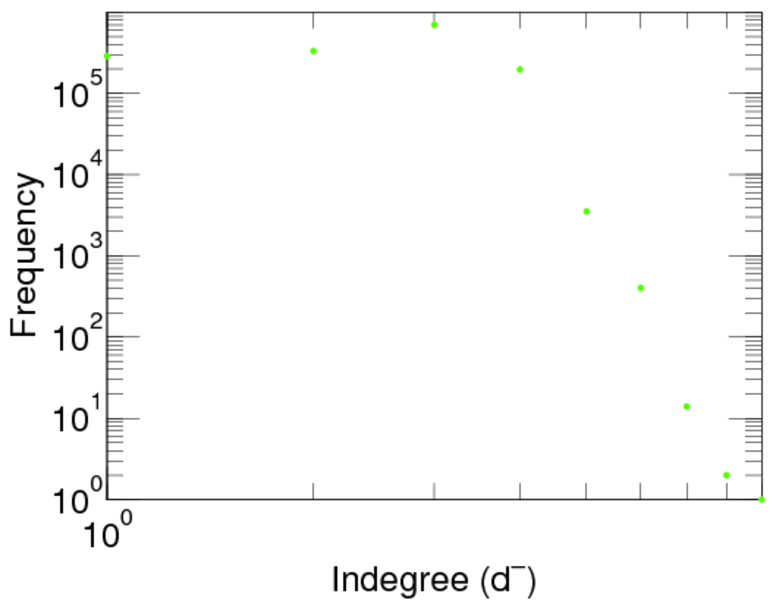
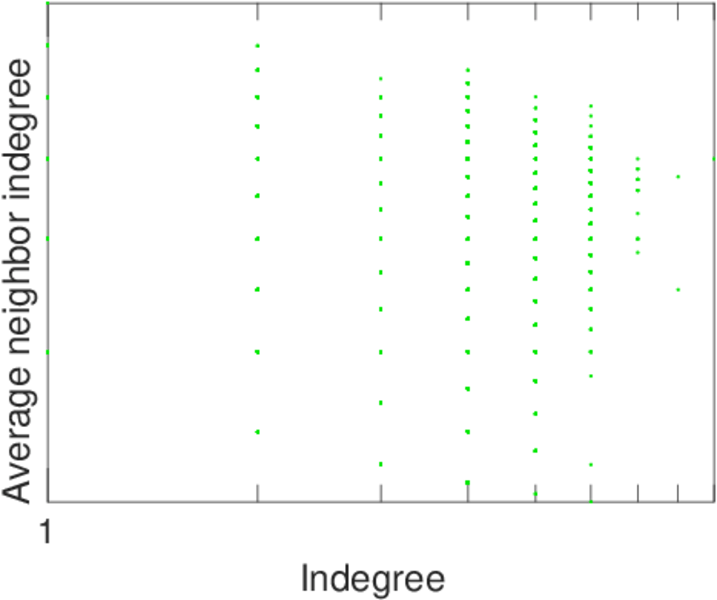
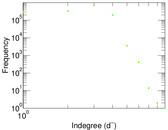
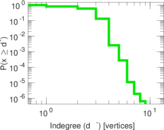
| Maximum indegree | d−max = | 9
|
| Average degree | d = | 5.074 63
|
| Fill | p = | 1.664 41 × 10−6
|
| Size of LCC | N = | 1,524,453
|
| Size of LSCC | Ns = | 1,524,453
|
| Relative size of LSCC | Nrs = | 1.000 00
|
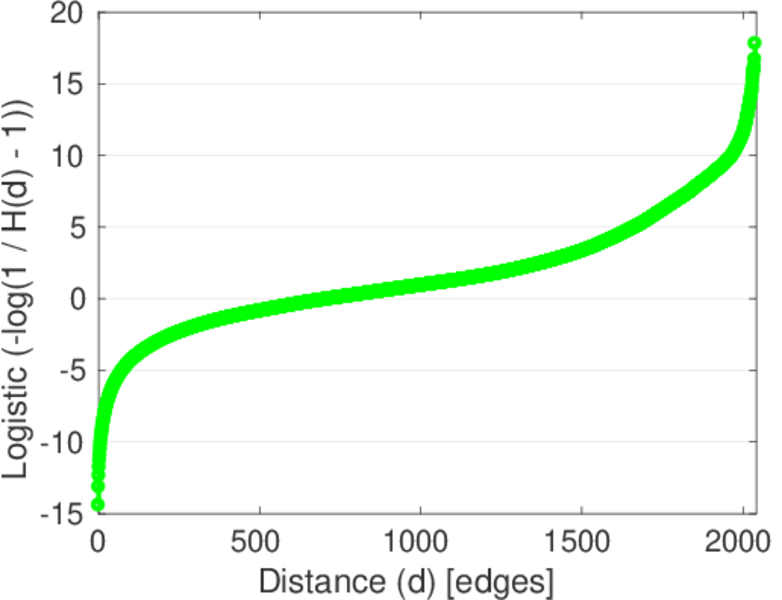
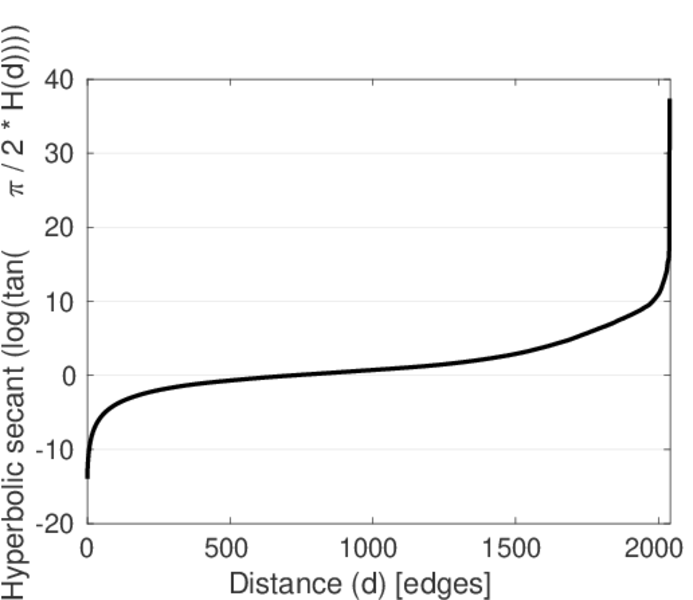
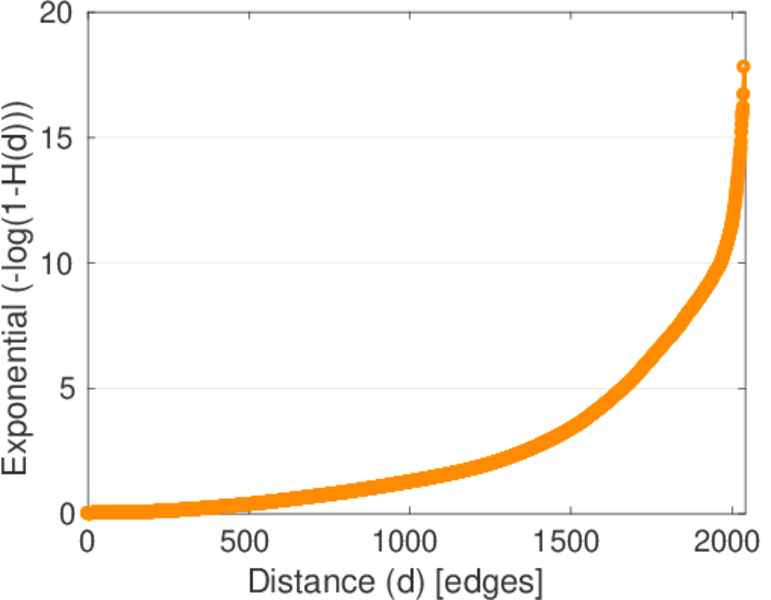
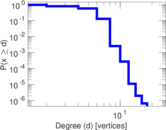
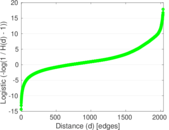
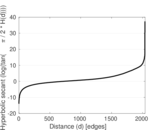
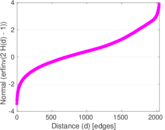
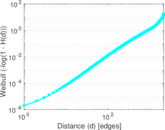
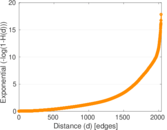
| Diameter | δ = | 2,098
|
| 50-Percentile effective diameter | δ0.5 = | 720.652
|
| 90-Percentile effective diameter | δ0.9 = | 1,327.23
|
| Median distance | δM = | 721
|
| Mean distance | δm = | 764.448
|
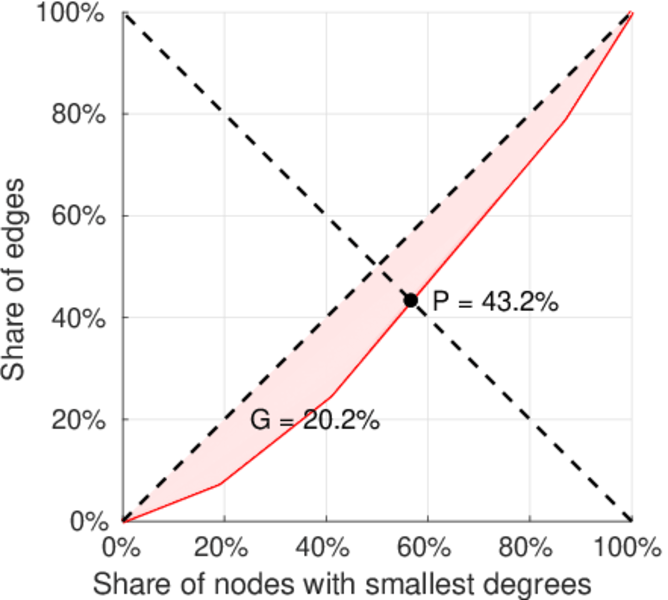
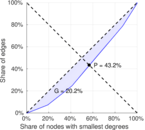
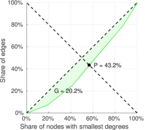
| Gini coefficient | G = | 0.202 056
|
| Balanced inequality ratio | P = | 0.432 455
|
| Outdegree balanced inequality ratio | P+ = | 0.432 455
|
| Indegree balanced inequality ratio | P− = | 0.432 455
|
| Relative edge distribution entropy | Her = | 0.994 586
|
| Power law exponent | γ = | 2.189 87
|
| Tail power law exponent | γt = | 6.461 00
|
| Tail power law exponent with p | γ3 = | 6.461 00
|
| p-value | p = | 0.000 00
|
| Outdegree tail power law exponent with p | γ3,o = | 6.461 00
|
| Outdegree p-value | po = | 0.000 00
|
| Indegree tail power law exponent with p | γ3,i = | 6.461 00
|
| Indegree p-value | pi = | 0.000 00
|
| Degree assortativity | ρ = | +0.105 737
|
| Degree assortativity p-value | pρ = | 0.000 00
|
| In/outdegree correlation | ρ± = | +1.000 00
|
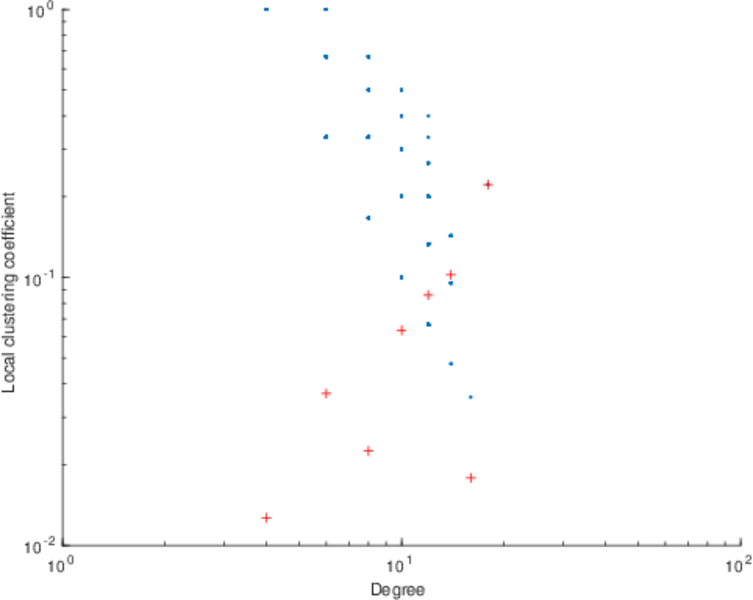
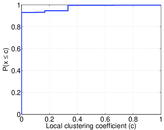
| Clustering coefficient | c = | 0.030 320 3
|
| Directed clustering coefficient | c± = | 0.030 320 3
|
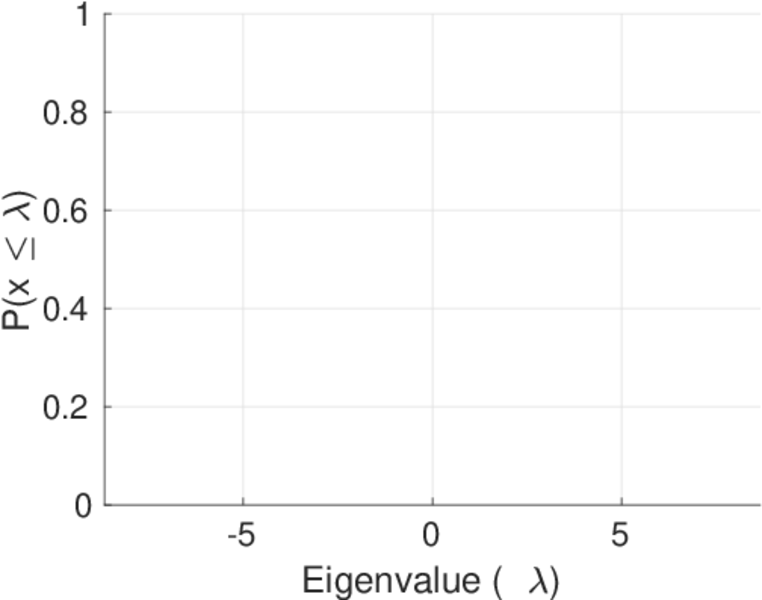
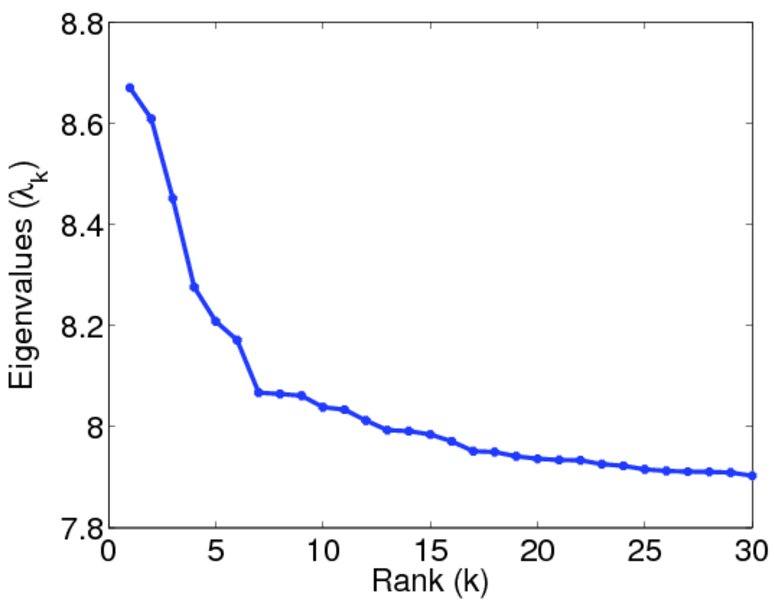
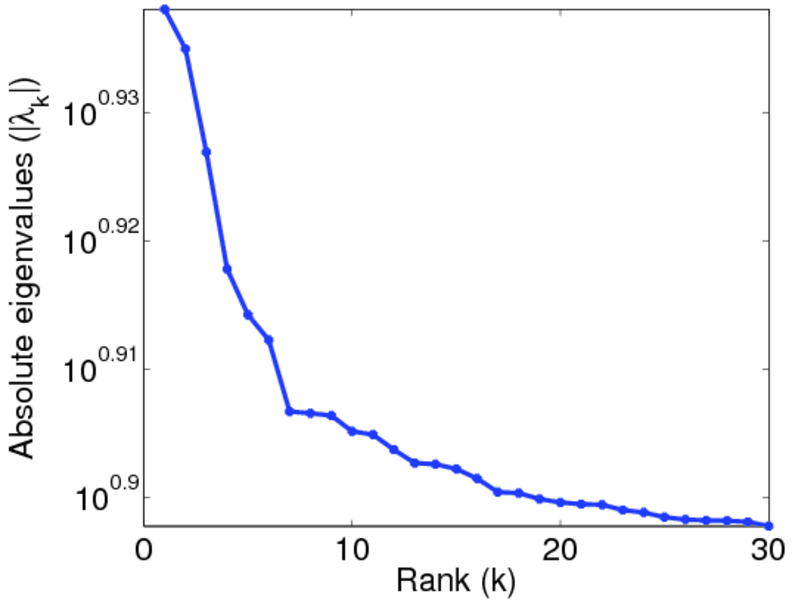
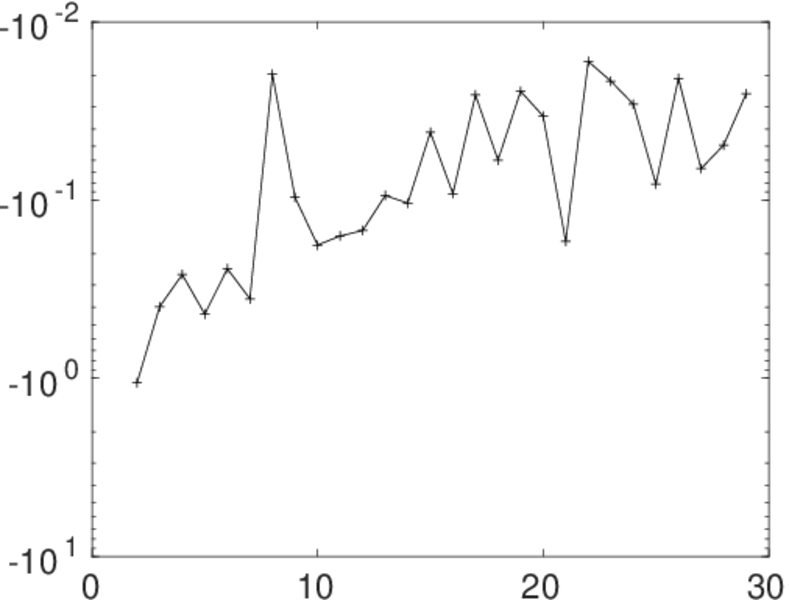
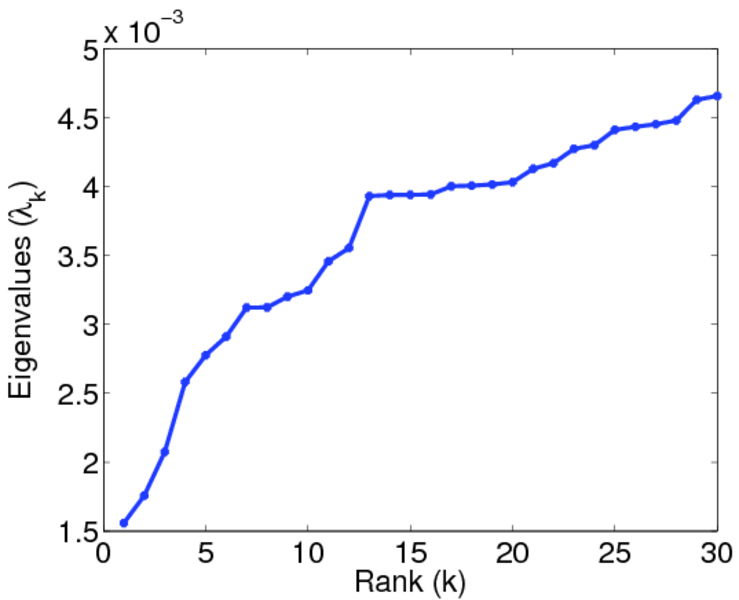
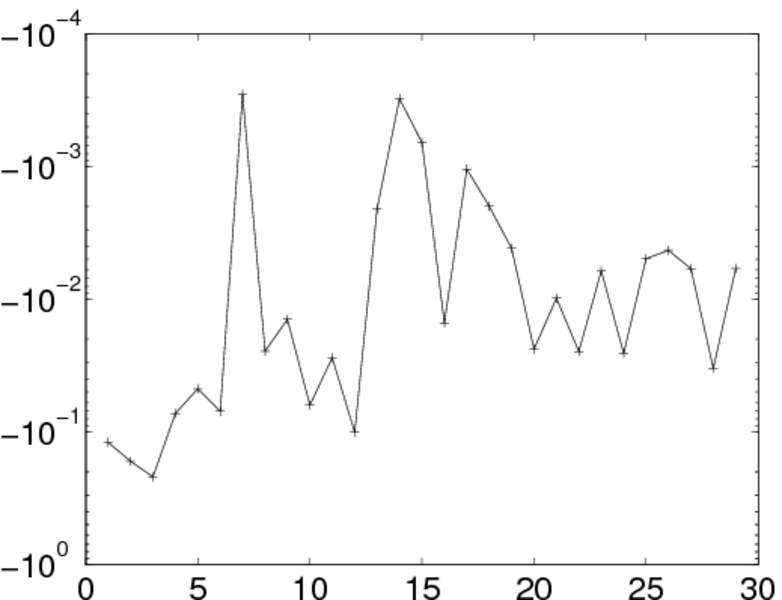
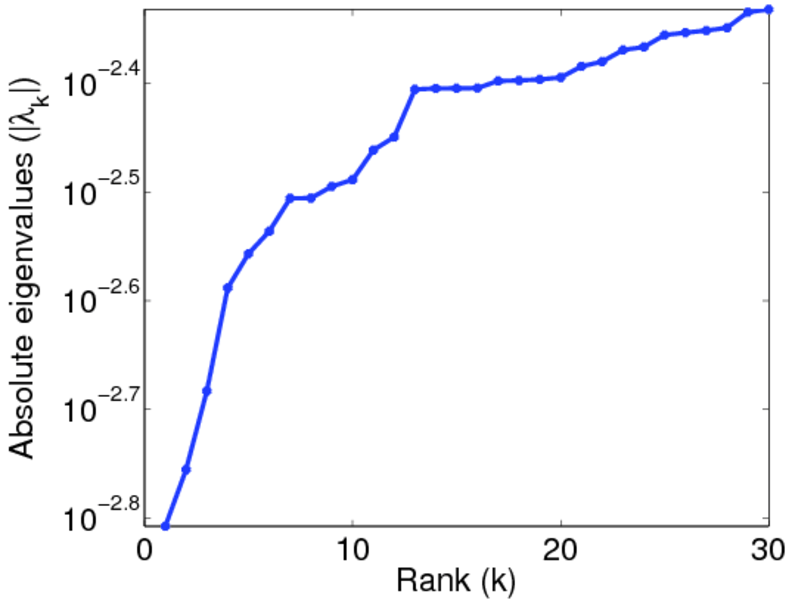
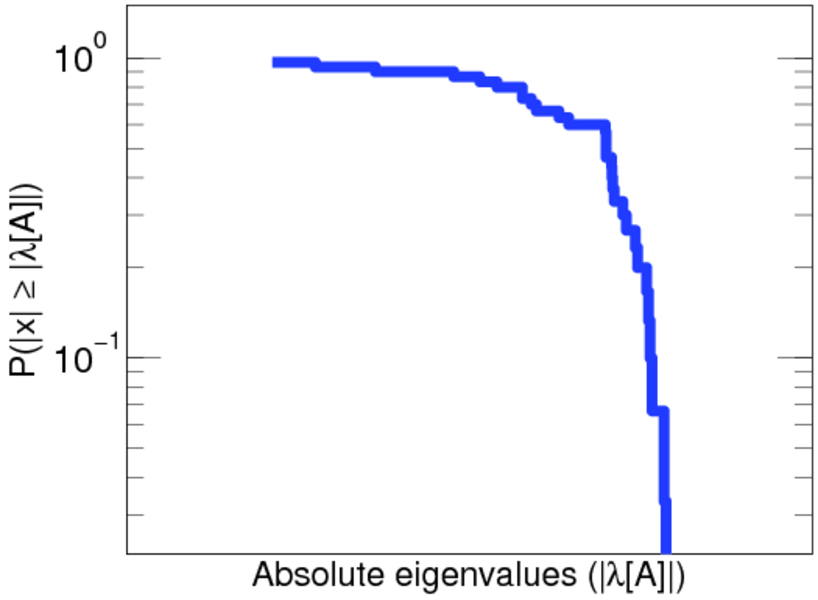
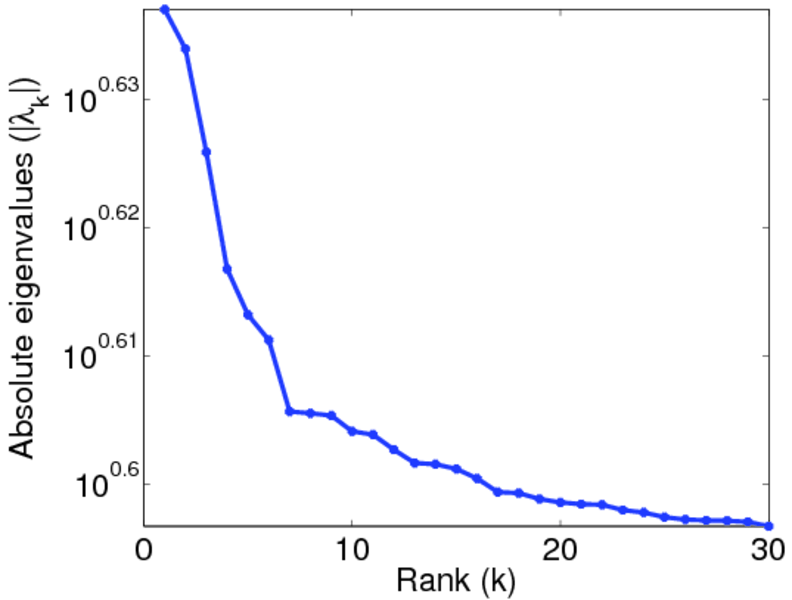
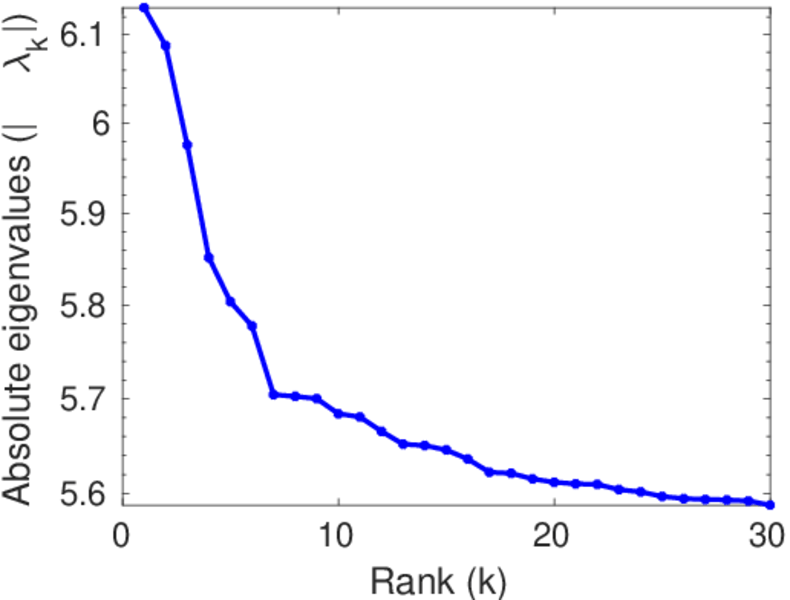
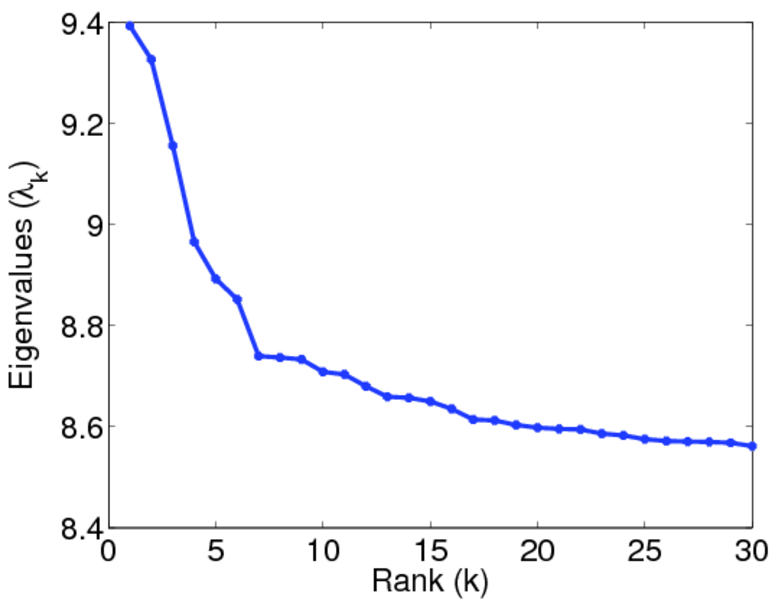
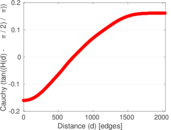
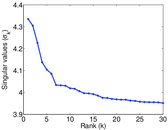
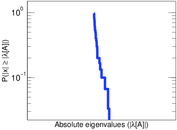
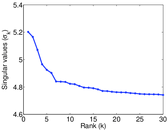
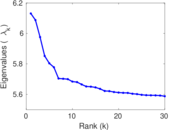
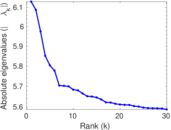
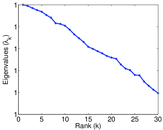
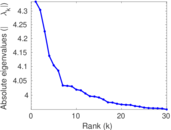
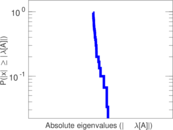
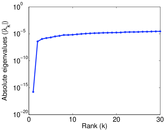
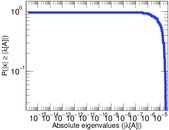
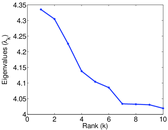
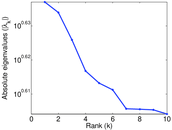
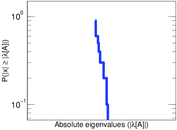
| Spectral norm | α = | 8.670 33
|
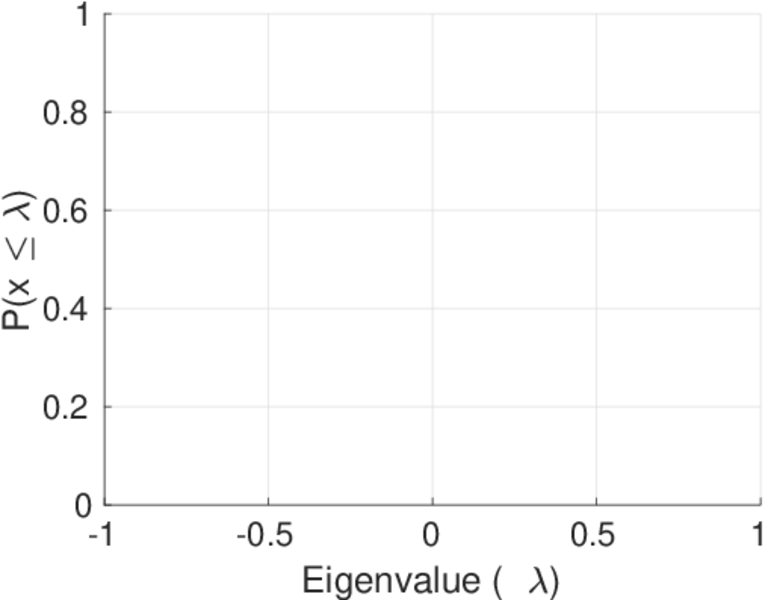
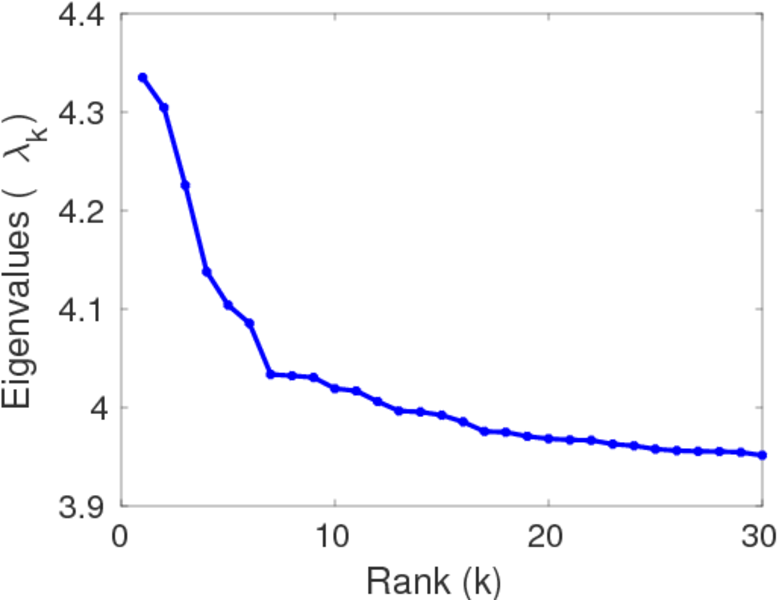
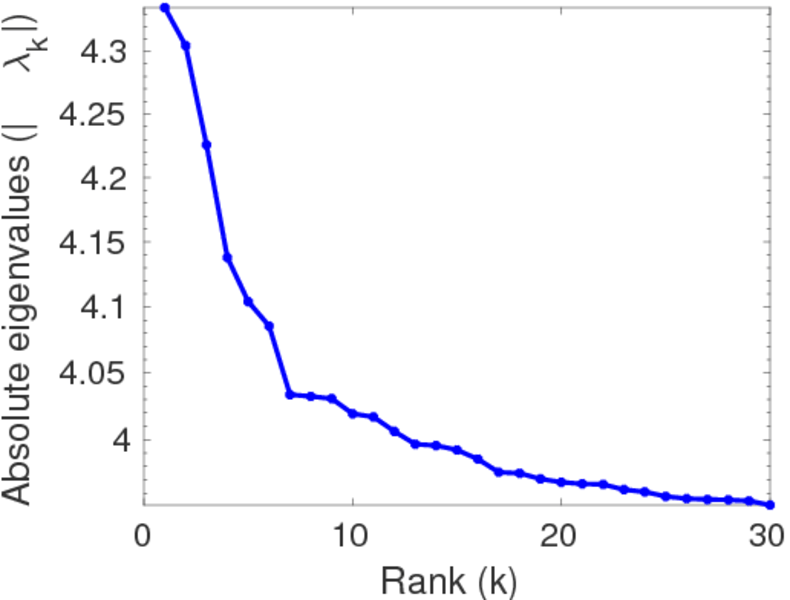
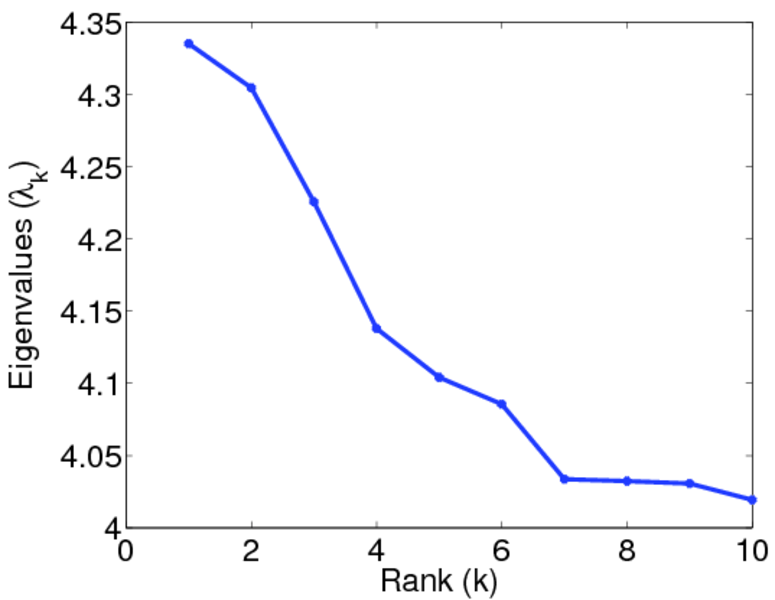
| Operator 2-norm | ν = | 4.335 17
|
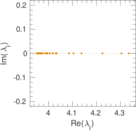
| Cyclic eigenvalue | π = | 4.335 17
|
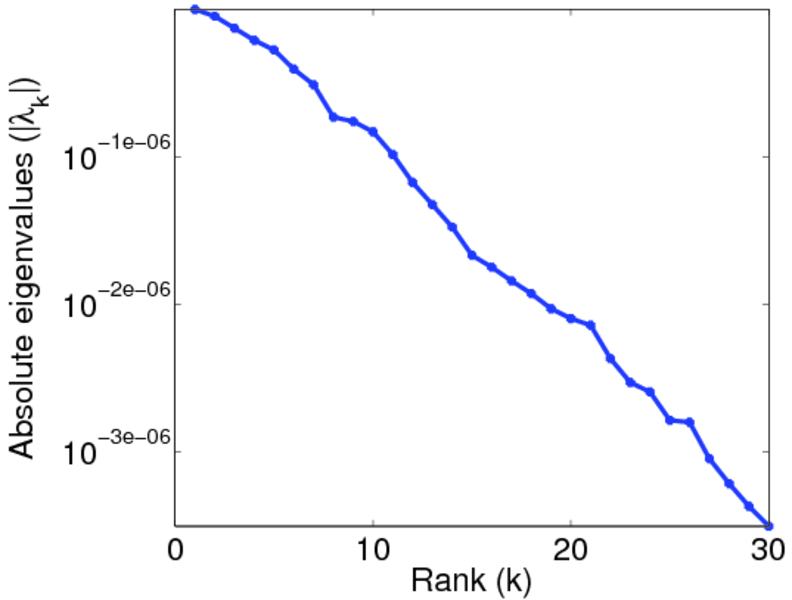
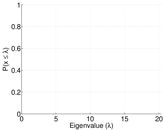
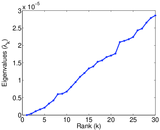
| Algebraic connectivity | a = | 5.380 07 × 10−7
|
| Non-bipartivity | bA = | 0.091 415 7
|
| Normalized non-bipartivity | bN = | 0.000 394 322
|
| Algebraic non-bipartivity | χ = | 0.000 779 372
|
| Spectral bipartite frustration | bK = | 7.679 10 × 10−5
|
| Controllability | C = | 148,359
|
| Relative controllability | Cr = | 0.097 319 5
|
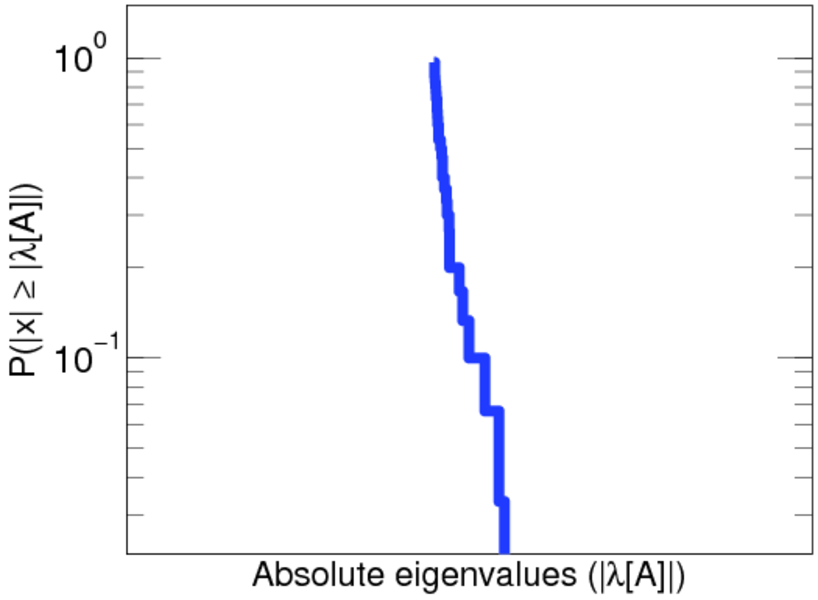
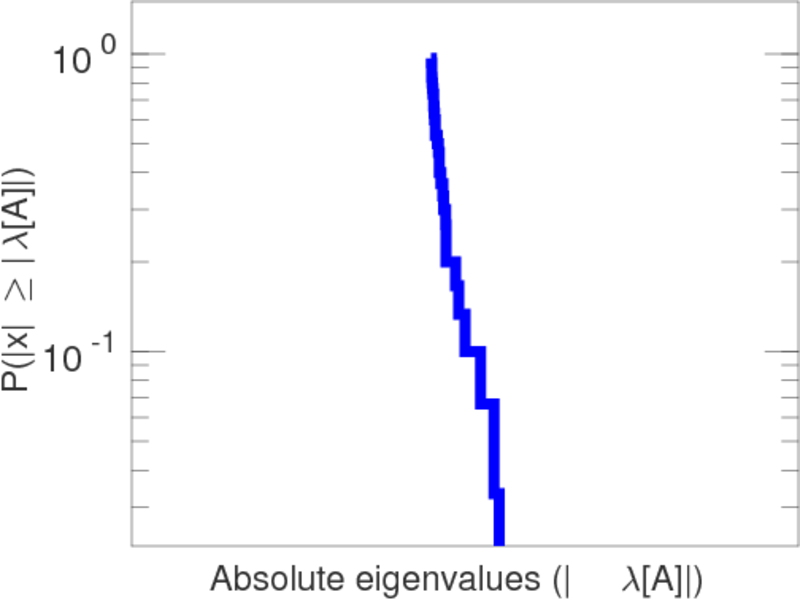
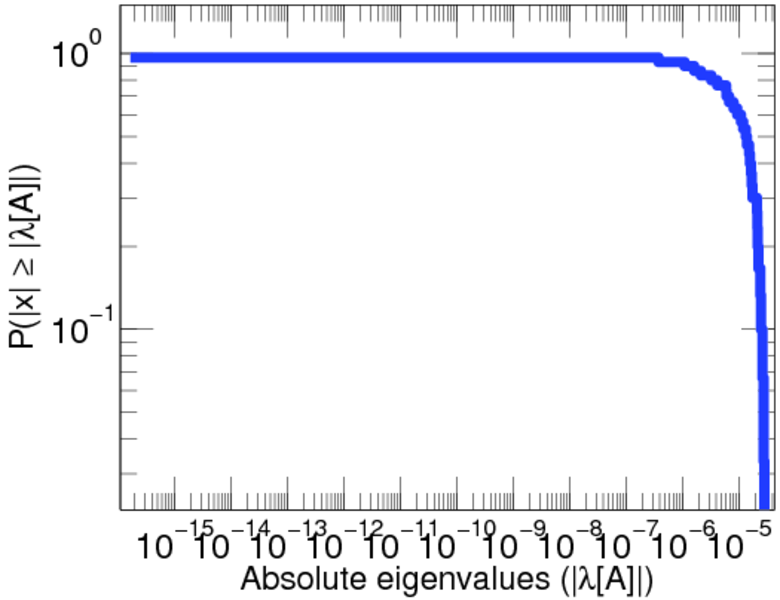
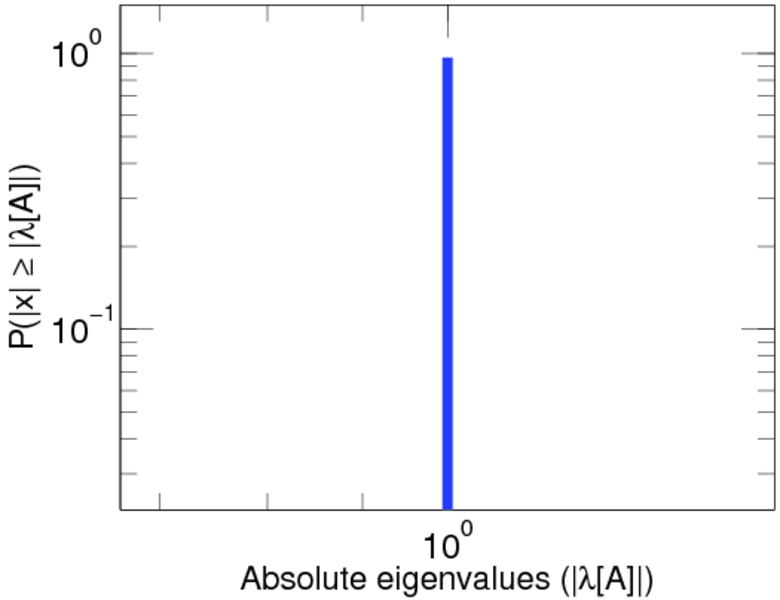
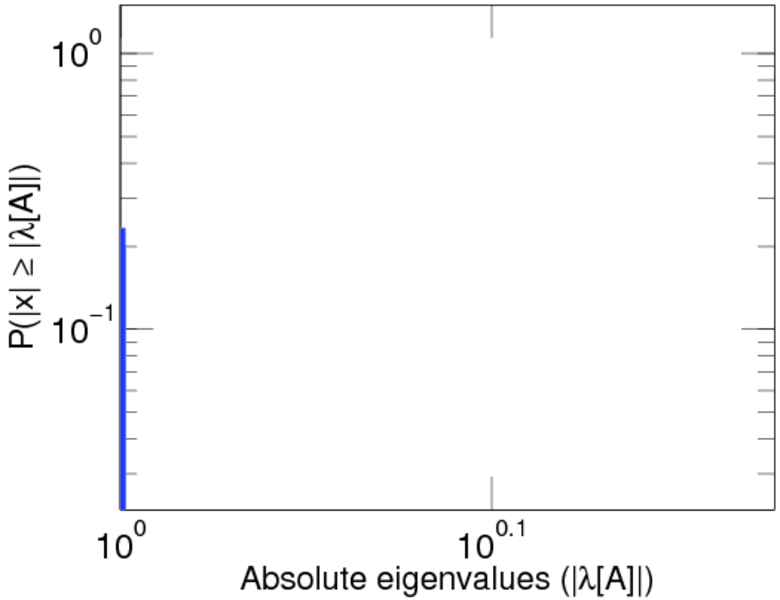
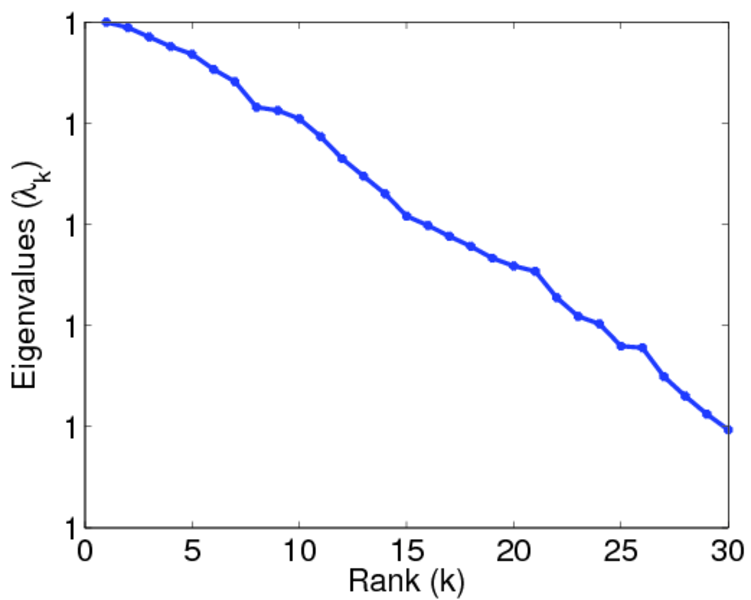
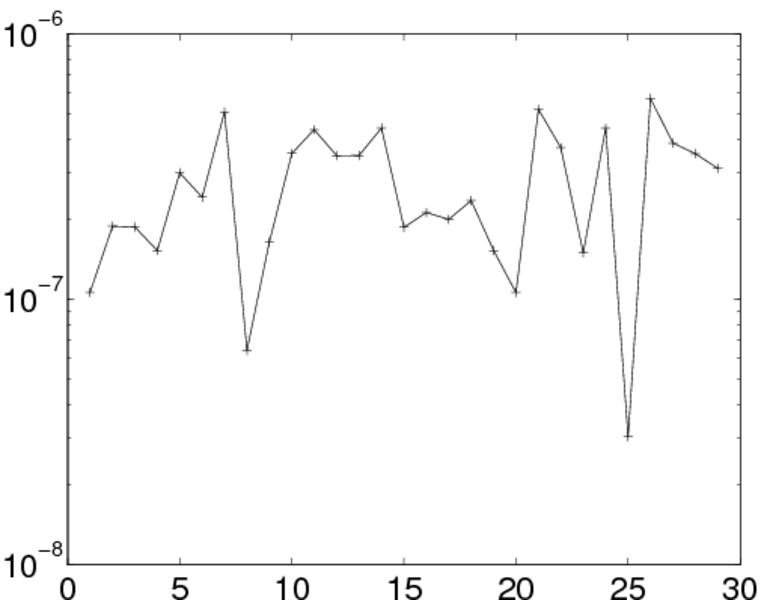
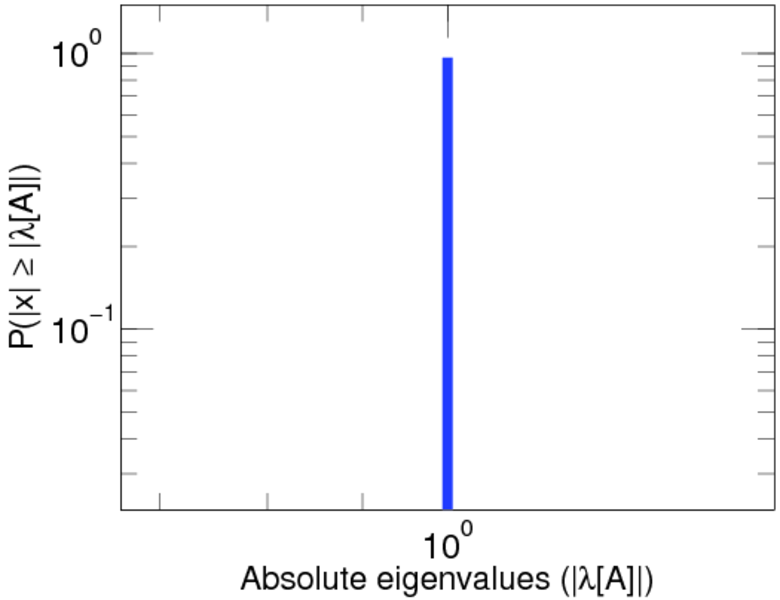
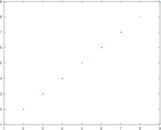
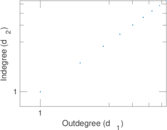
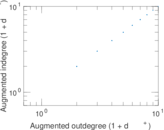
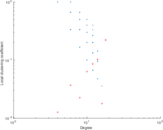
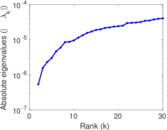
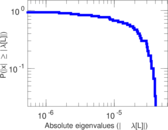
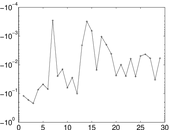
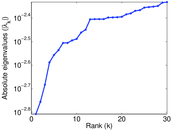
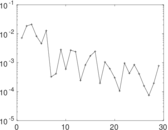
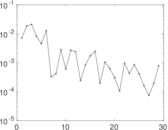
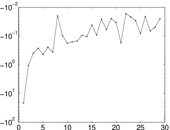
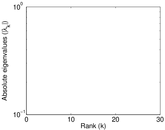
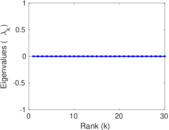
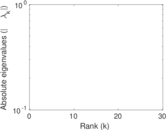
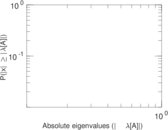
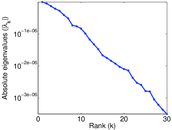
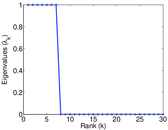
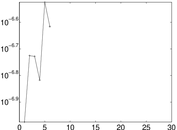
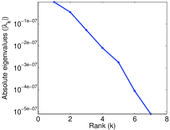
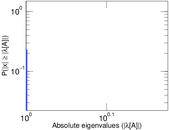
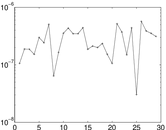
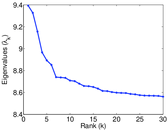
Plots


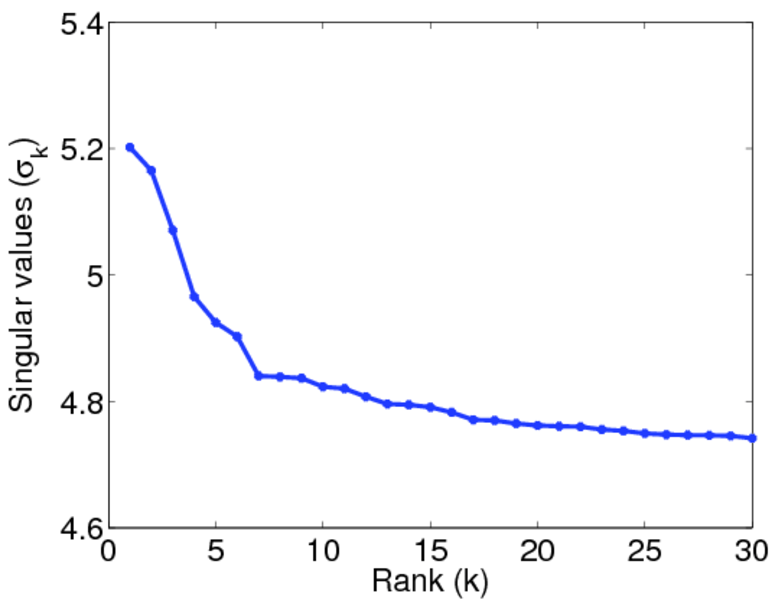
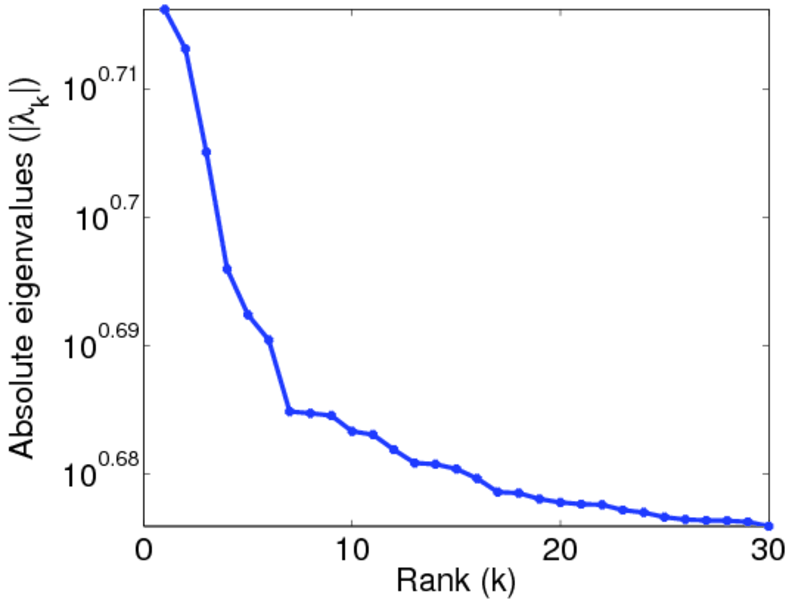
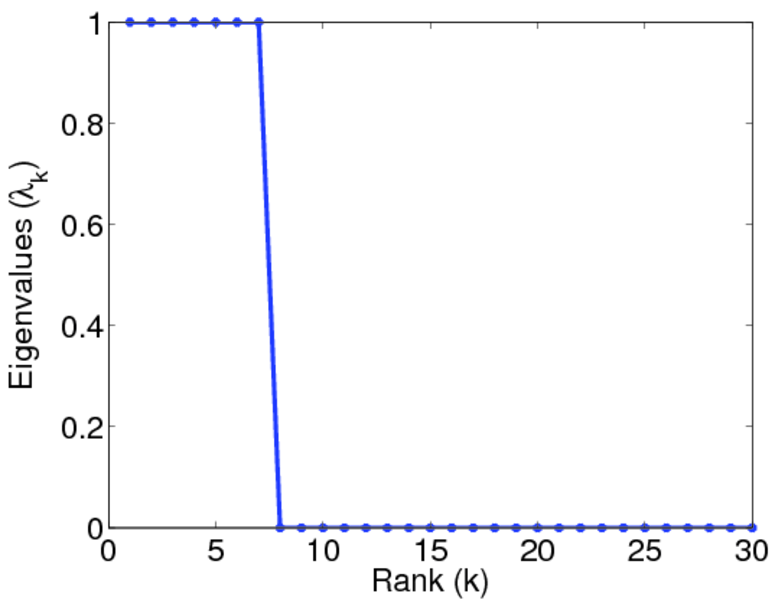
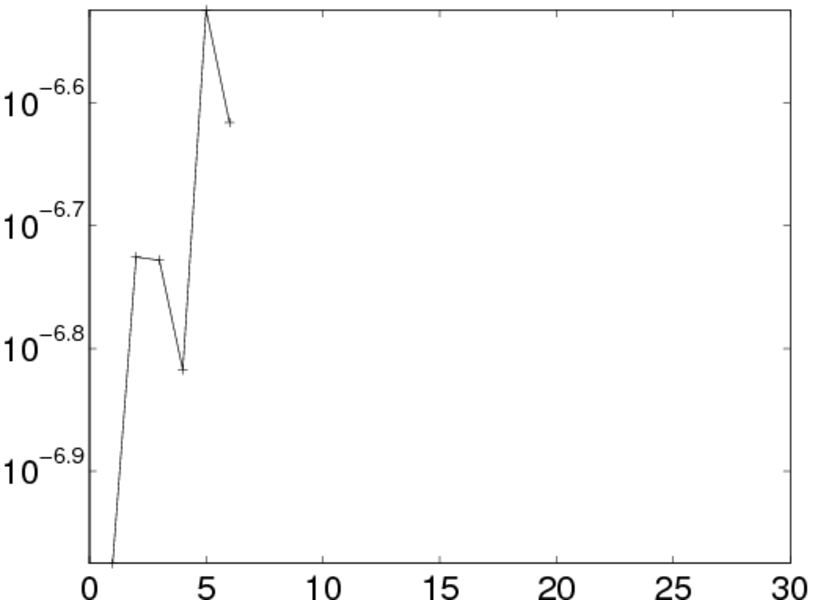
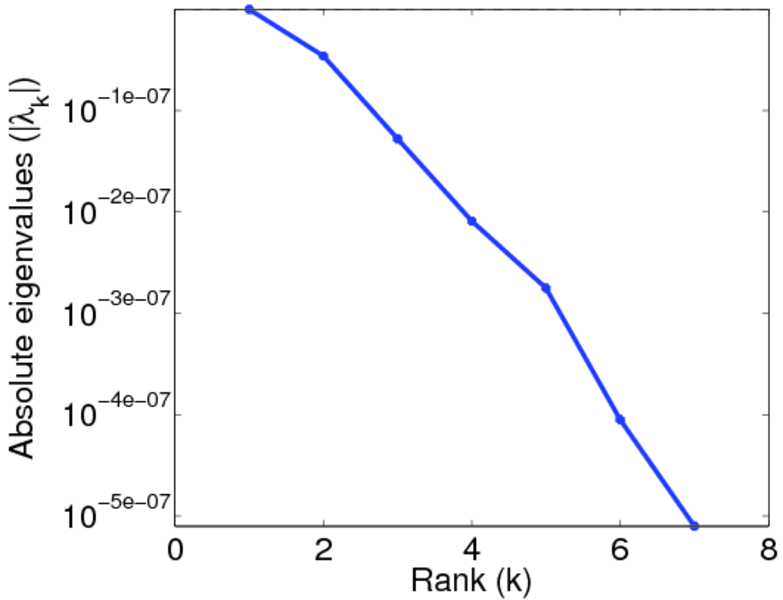
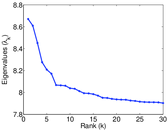
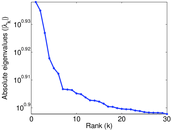
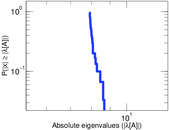
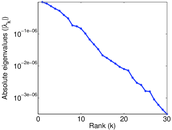
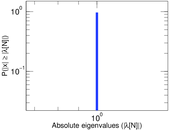
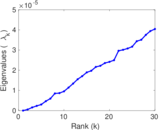
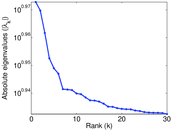
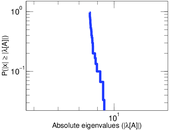
Matrix decompositions plots


Downloads
References
|
[1]
|
Jérôme Kunegis.
KONECT – The Koblenz Network Collection.
In Proc. Int. Conf. on World Wide Web Companion, pages
1343–1350, 2013.
[ http ]
|
 KONECT ‣ Networks ‣
Buy Me a Coffee
KONECT ‣ Networks ‣
Buy Me a Coffee