Full USA
This is the directed road network from the 9th DIMACS Implementation Challenge,
for the area "Full USA".
Metadata
Statistics
| Size | n = | 23,947,347
|
| Volume | m = | 57,708,624
|
| Loop count | l = | 0
|
| Wedge count | s = | 51,012,721
|
| Claw count | z = | 363,785,540
|
| Cross count | x = | 334,751,617
|
| Triangle count | t = | 438,804
|
| Square count | q = | 1,607,203
|
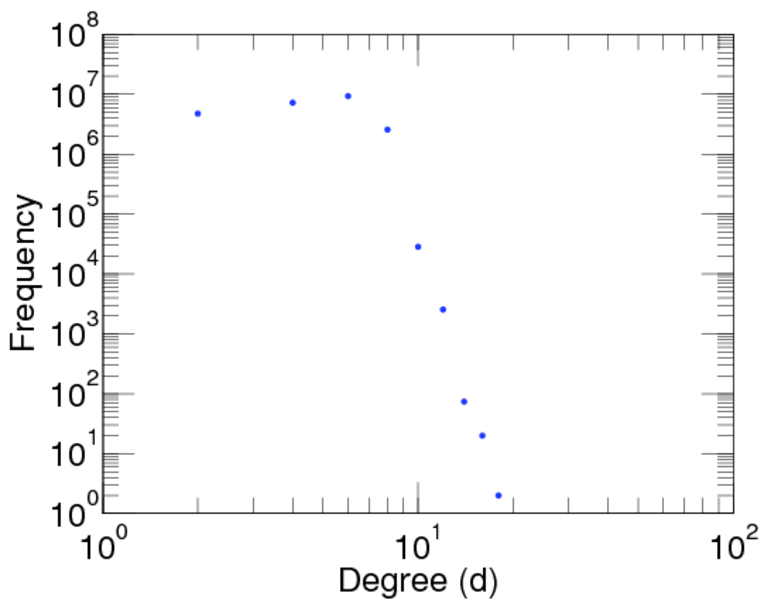
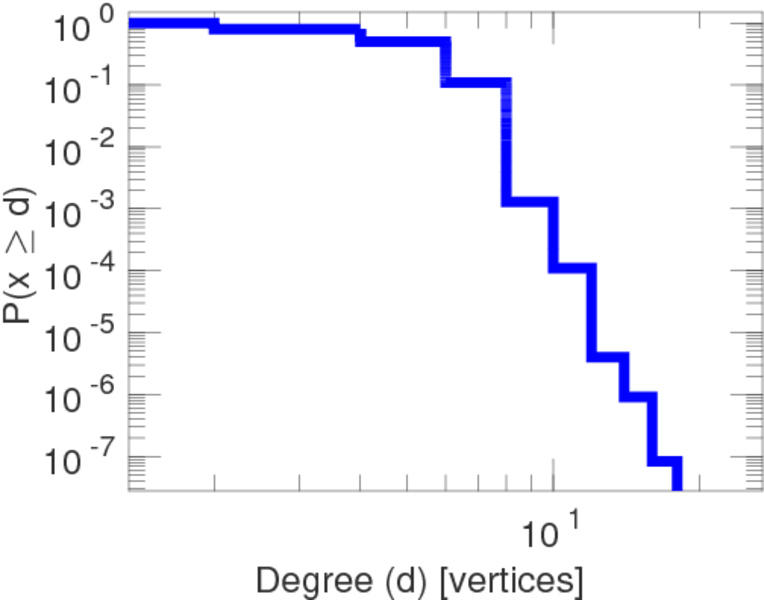
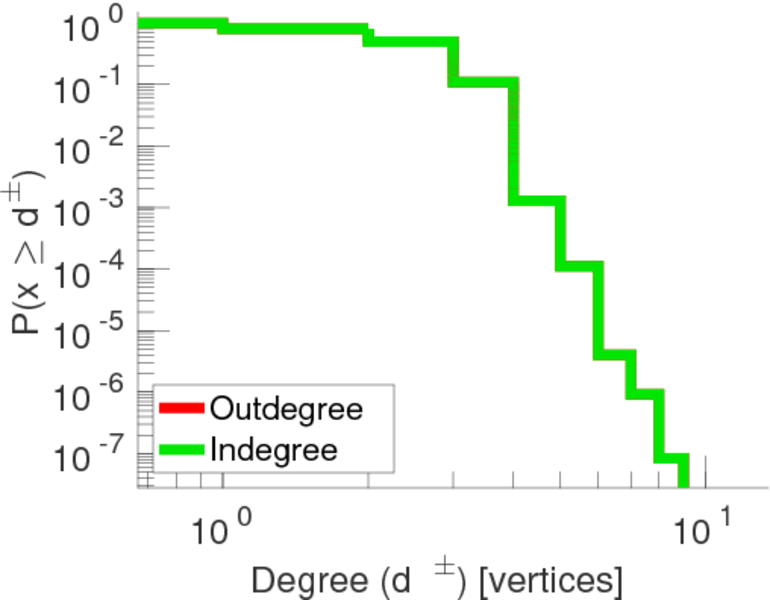
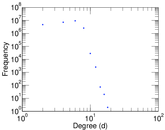
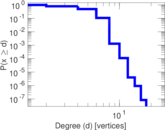
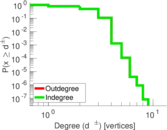
| Maximum degree | dmax = | 18
|
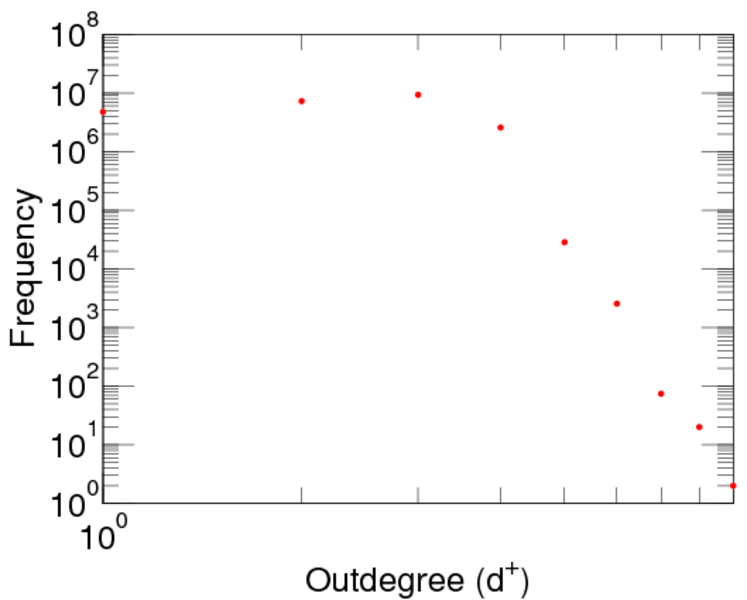
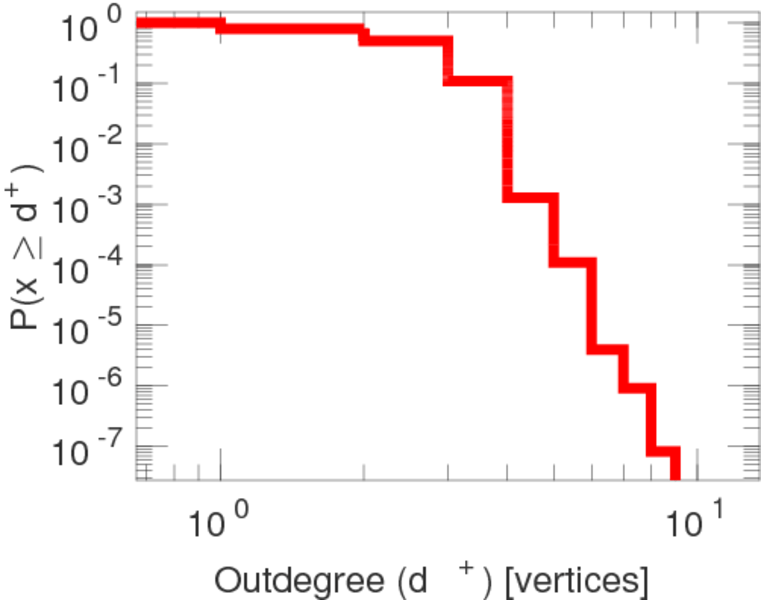
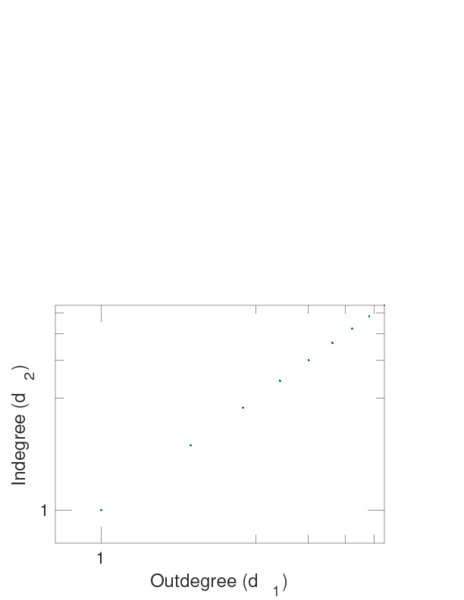
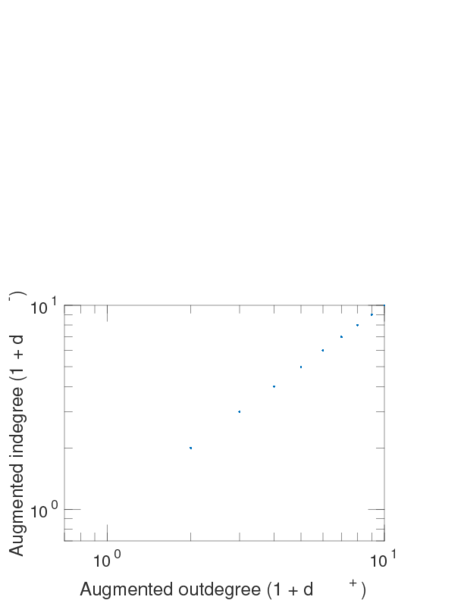
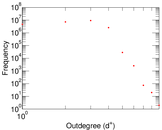
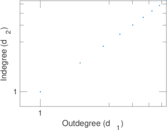
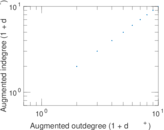
| Maximum outdegree | d+max = | 9
|
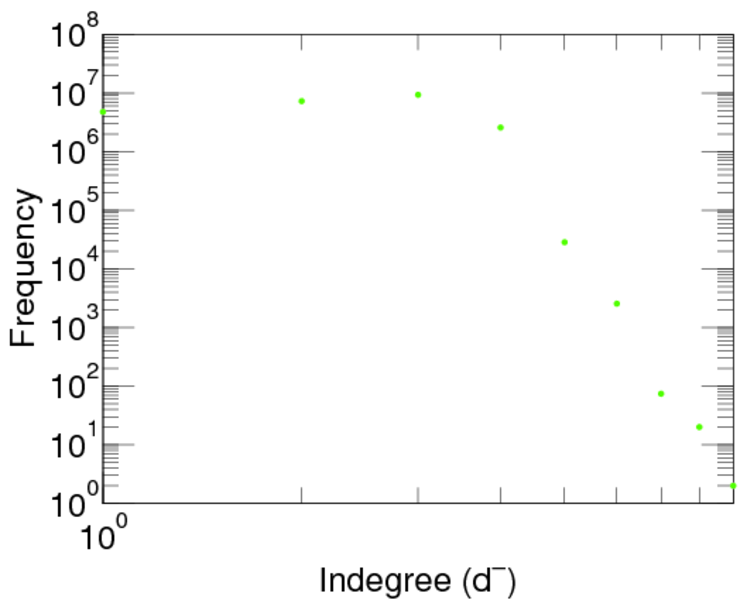
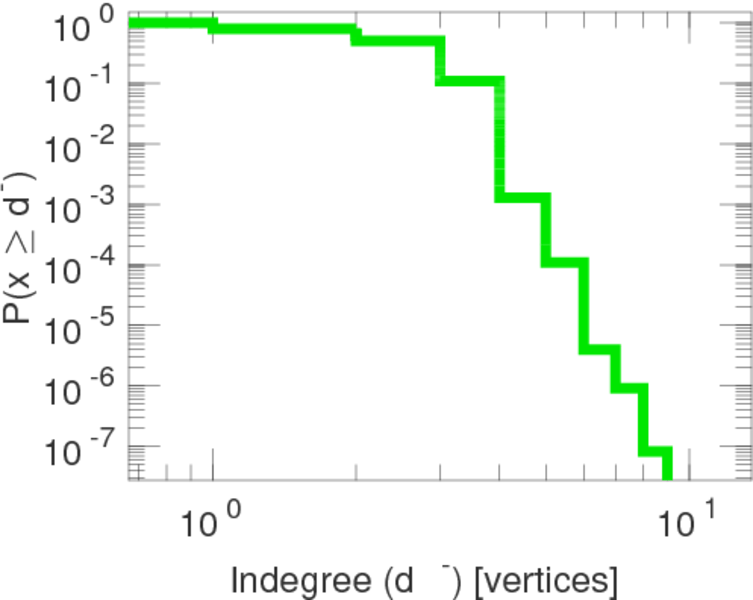
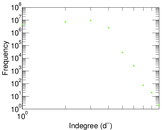
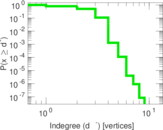
| Maximum indegree | d−max = | 9
|
| Average degree | d = | 4.819 63
|
| Fill | p = | 1.006 30 × 10−7
|
| Size of LCC | N = | 23,947,347
|
| Size of LSCC | Ns = | 23,947,347
|
| Relative size of LSCC | Nrs = | 1.000 00
|
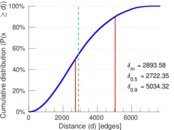
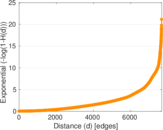
| Diameter | δ = | 8,440
|
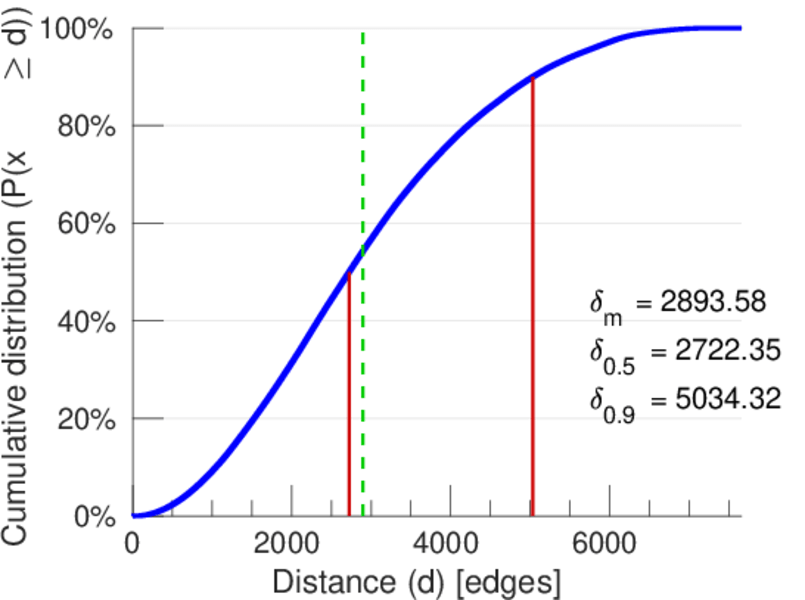
| 50-Percentile effective diameter | δ0.5 = | 2,722.35
|
| 90-Percentile effective diameter | δ0.9 = | 5,034.32
|
| Median distance | δM = | 2,723
|
| Mean distance | δm = | 2,893.58
|
| Balanced inequality ratio | P = | 0.418 964
|
| Outdegree balanced inequality ratio | P+ = | 0.418 964
|
| Indegree balanced inequality ratio | P− = | 0.418 964
|
| Tail power law exponent with p | γ3 = | 6.541 00
|
| p-value | p = | 0.000 00
|
| Outdegree tail power law exponent with p | γ3,o = | 6.541 00
|
| Outdegree p-value | po = | 0.000 00
|
| Indegree tail power law exponent with p | γ3,i = | 6.541 00
|
| Indegree p-value | pi = | 0.000 00
|
| Degree assortativity | ρ = | +0.067 358 4
|
| Degree assortativity p-value | pρ = | 0.000 00
|
| Clustering coefficient | c = | 0.025 805 6
|
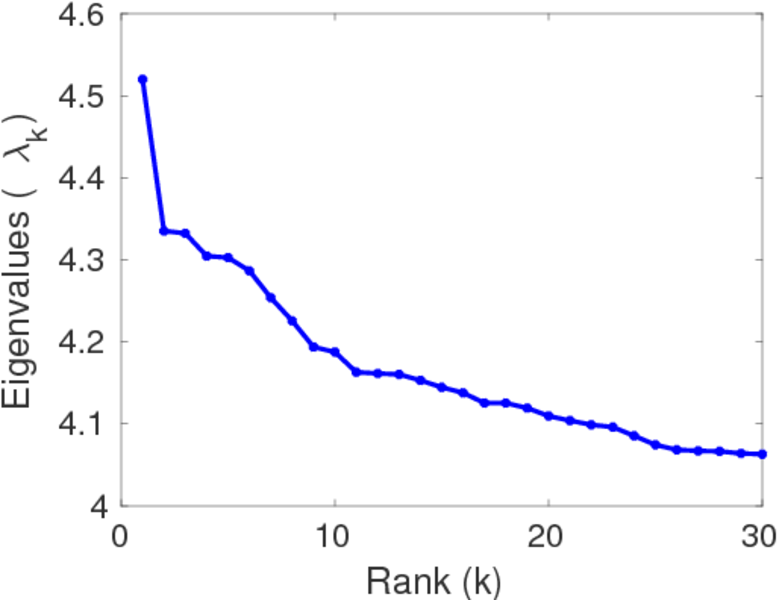
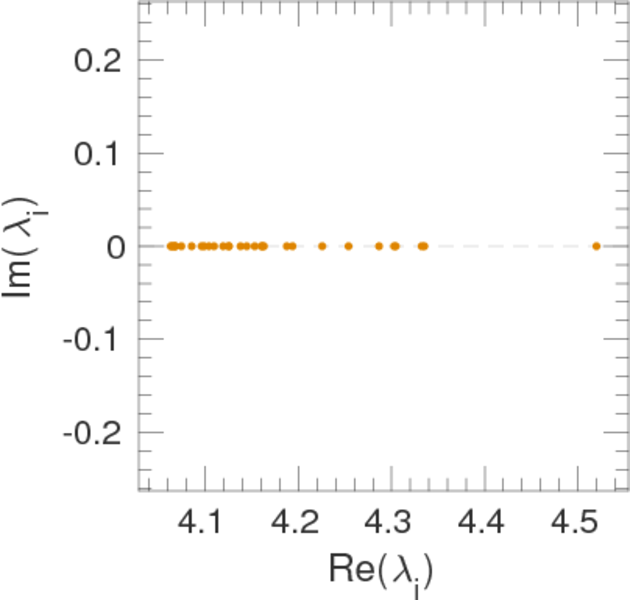
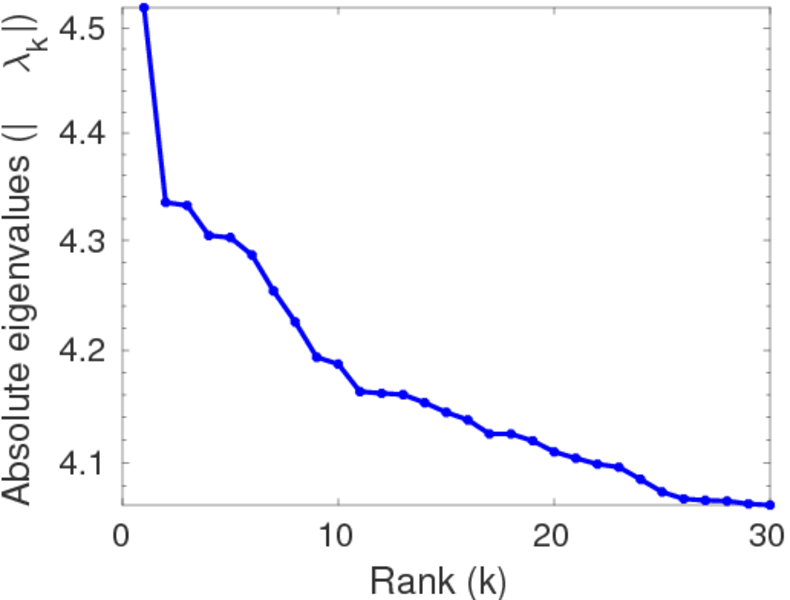
| Operator 2-norm | ν = | 4.519 83
|
| Algebraic connectivity | a = | 3.028 22 × 10−8
|
| Reciprocity | y = | 1.000 00
|
| Non-bipartivity | bA = | 0.125 732
|
| Normalized non-bipartivity | bN = | 6.231 10 × 10−5
|
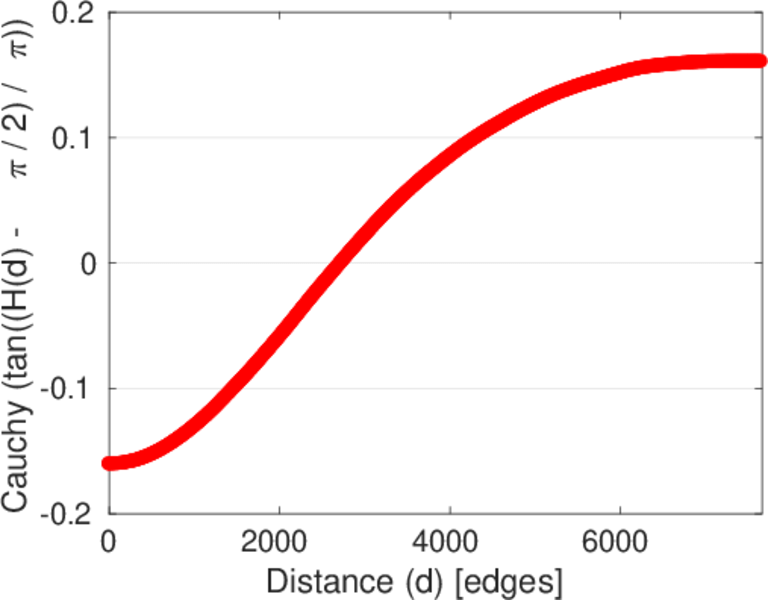
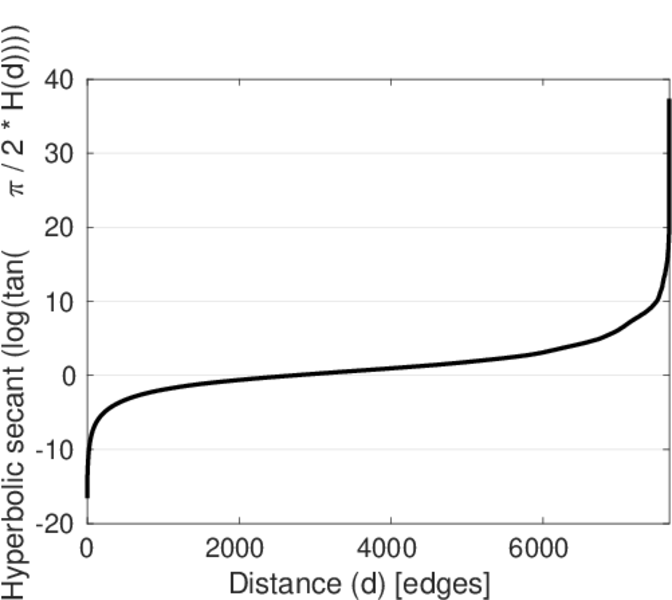
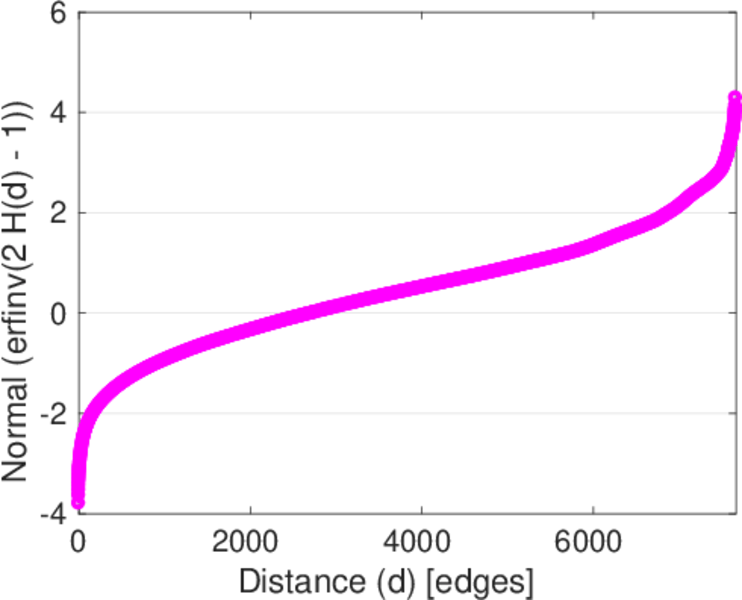
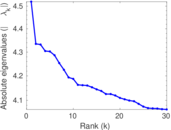
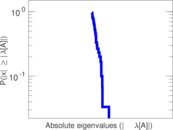
Plots


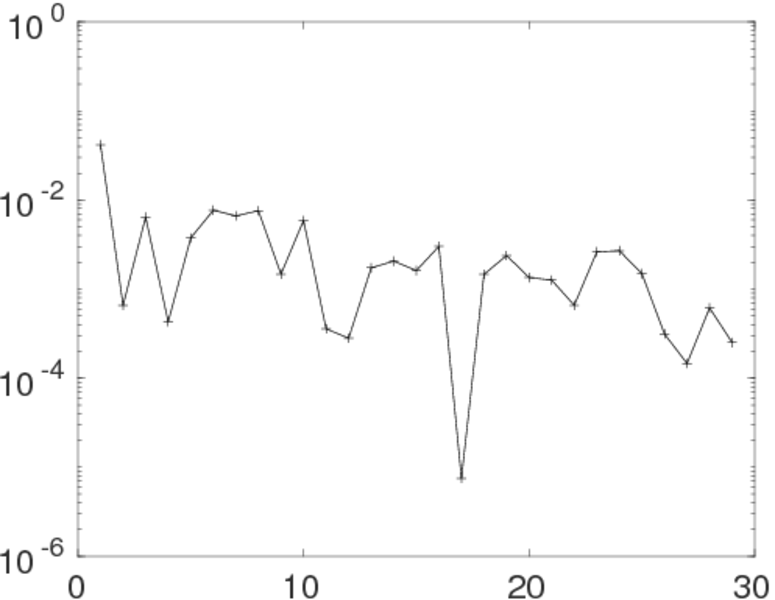
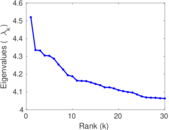
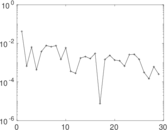
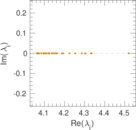
Matrix decompositions plots
Downloads
References
|
[1]
|
Jérôme Kunegis.
KONECT – The Koblenz Network Collection.
In Proc. Int. Conf. on World Wide Web Companion, pages
1343–1350, 2013.
[ http ]
|
 KONECT ‣ Networks ‣
Buy Me a Coffee
KONECT ‣ Networks ‣
Buy Me a Coffee