Yahoo advertisers
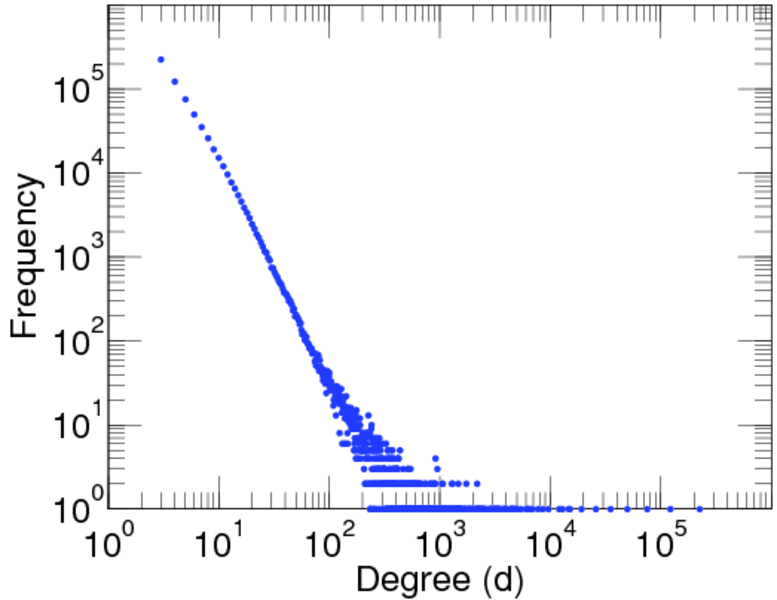
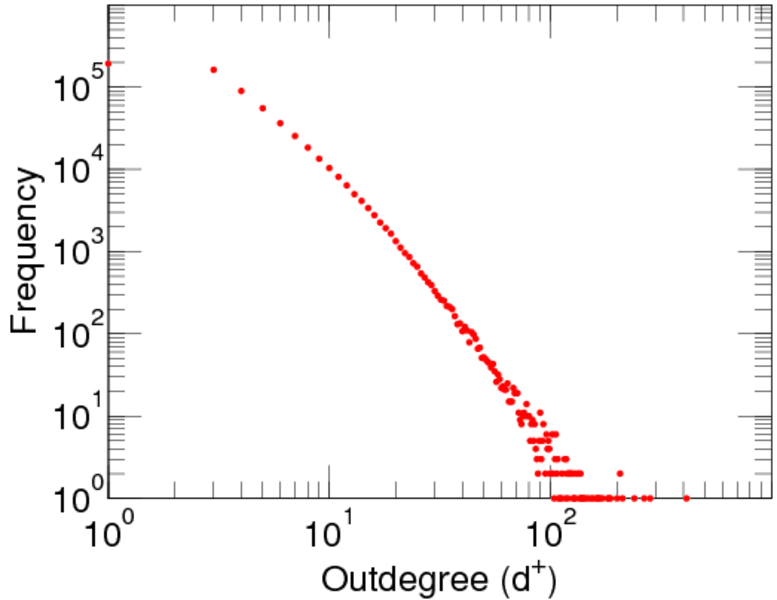
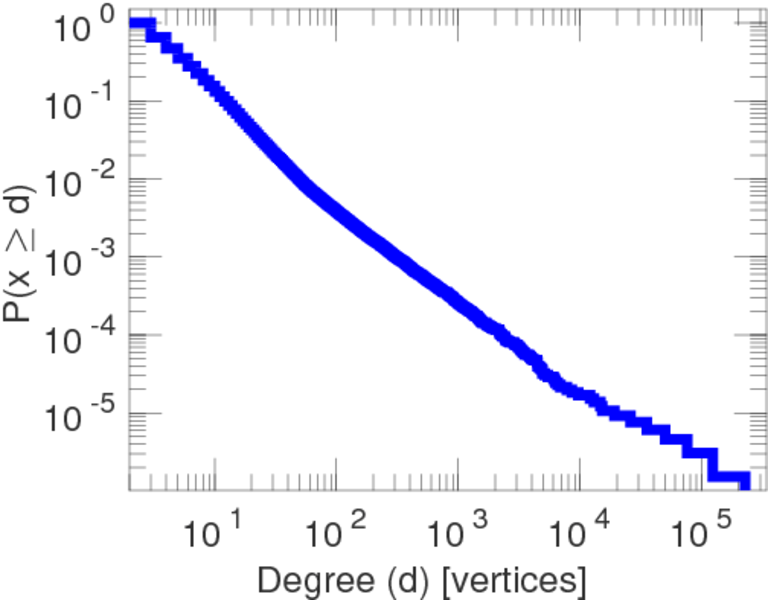
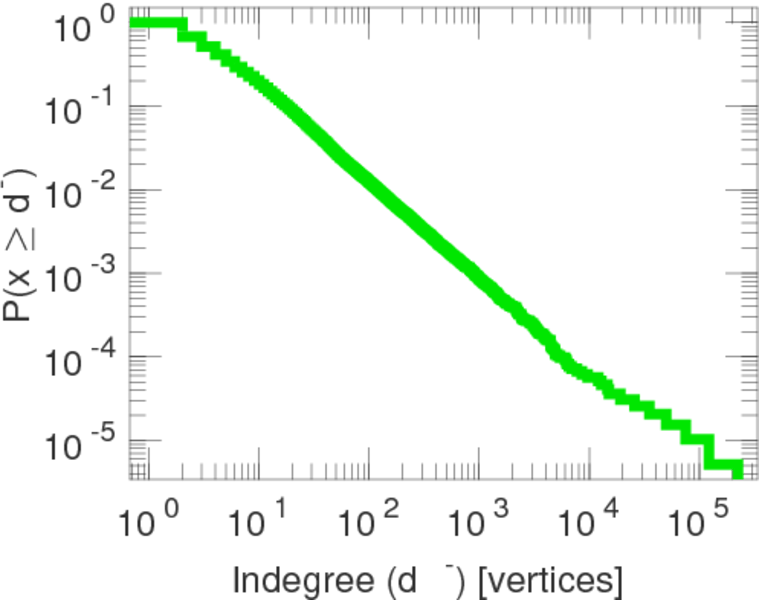
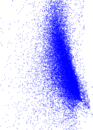
These are adjacency data from phrases bidded for in Yahoo advertisements. Nodes
in the network are words, and a directed edge denotes that two words occurred
one after the other in a phrase. The network contains loops.
Metadata
Statistics
| Size | n = | 653,260
|
| Volume | m = | 2,931,708
|
| Loop count | l = | 2
|
| Wedge count | s = | 39,072,502,469
|
| Claw count | z = | 2,303,288,746,427,543
|
| Cross count | x = | 1.174 09 × 1020
|
| Triangle count | t = | 67,260
|
| Square count | q = | 395,269,117
|
| 4-Tour count | T4 = | 159,458,026,208
|
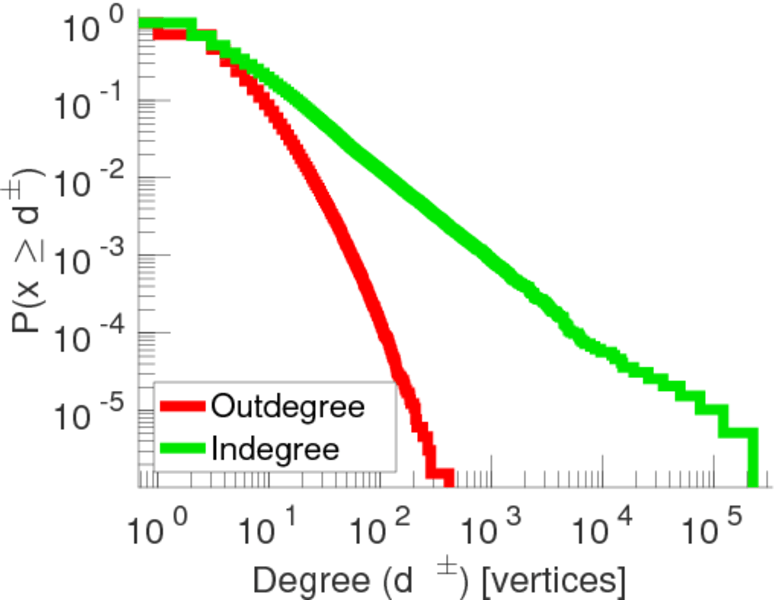
| Maximum degree | dmax = | 224,825
|
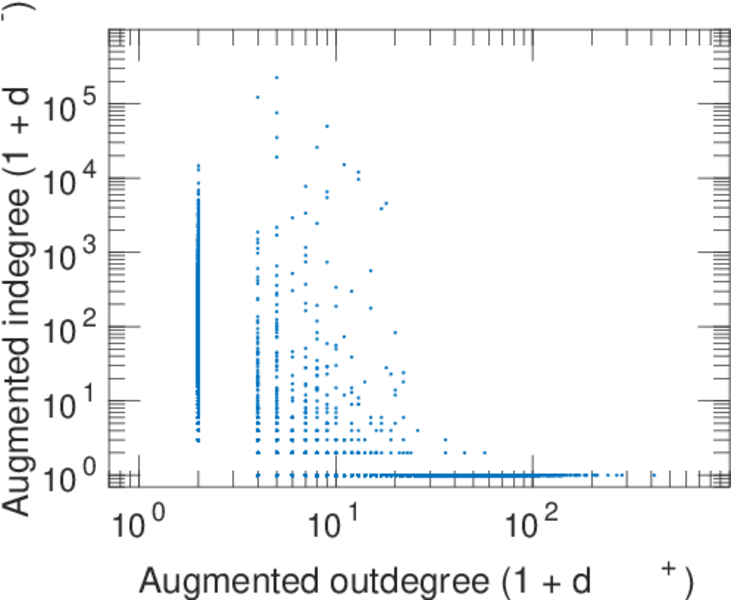
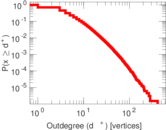
| Maximum outdegree | d+max = | 413
|
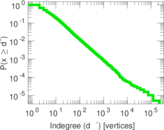
| Maximum indegree | d−max = | 224,821
|
| Average degree | d = | 8.975 62
|
| Size of LCC | N = | 653,260
|
| Size of LSCC | Ns = | 2,754
|
| Relative size of LSCC | Nrs = | 0.004 215 78
|
| Diameter | δ = | 5
|
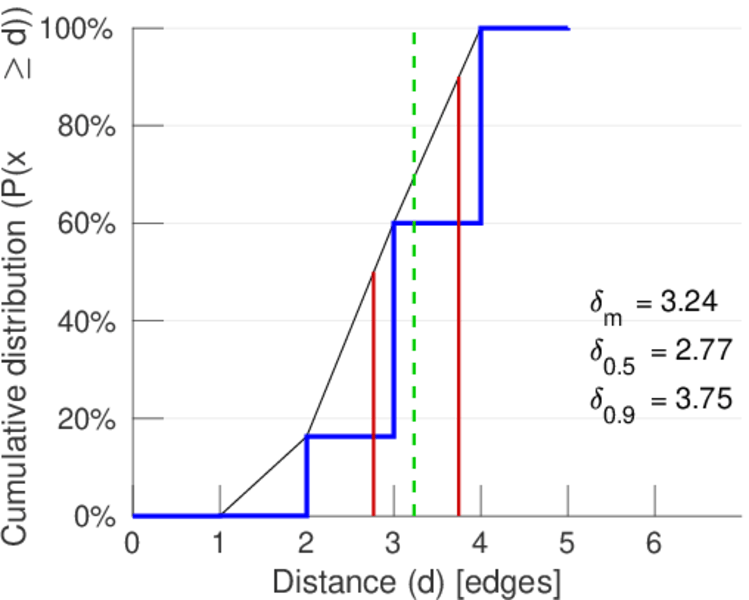
| 50-Percentile effective diameter | δ0.5 = | 2.770 96
|
| 90-Percentile effective diameter | δ0.9 = | 3.749 93
|
| Median distance | δM = | 3
|
| Mean distance | δm = | 3.237 15
|
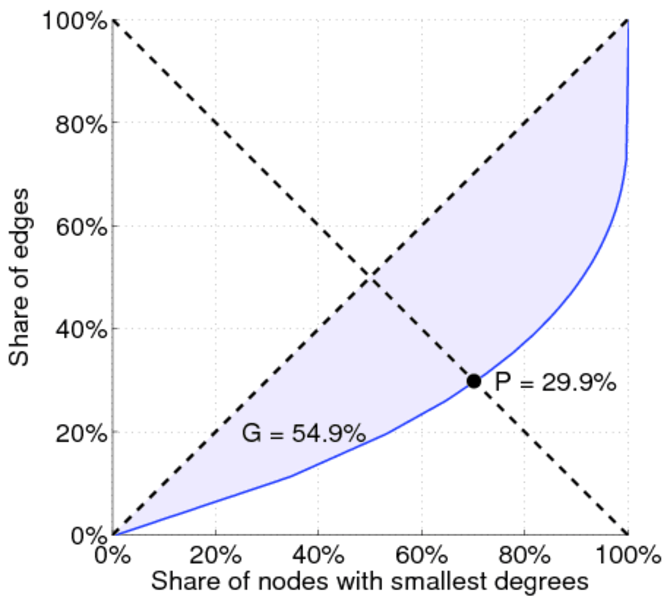
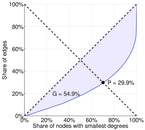
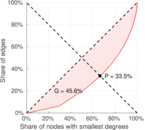
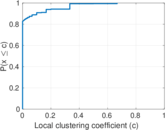
| Gini coefficient | G = | 0.548 822
|
| Balanced inequality ratio | P = | 0.298 544
|
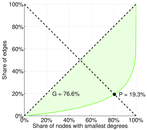
| Outdegree balanced inequality ratio | P+ = | 0.334 668
|
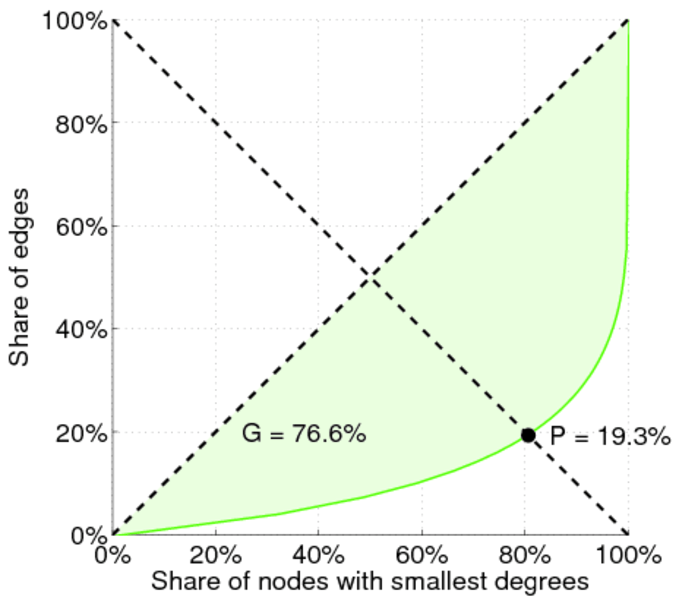
| Indegree balanced inequality ratio | P− = | 0.193 101
|
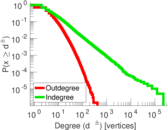
| Power law exponent | γ = | 2.798 77
|
| Tail power law exponent | γt = | 2.611 00
|
| Degree assortativity | ρ = | −0.081 463 3
|
| Degree assortativity p-value | pρ = | 0.000 00
|
| In/outdegree correlation | ρ± = | −0.683 057
|
| Clustering coefficient | c = | 5.164 25 × 10−6
|
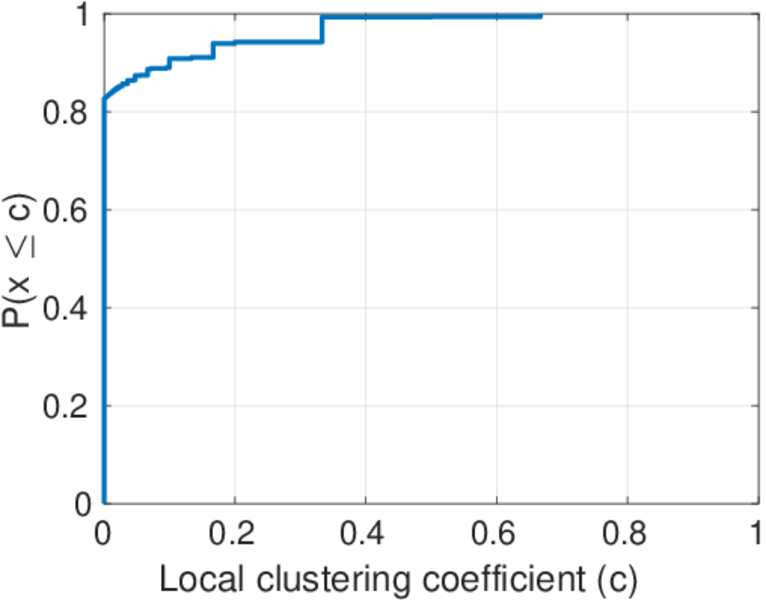
| Directed clustering coefficient | c± = | 0.012 244 3
|
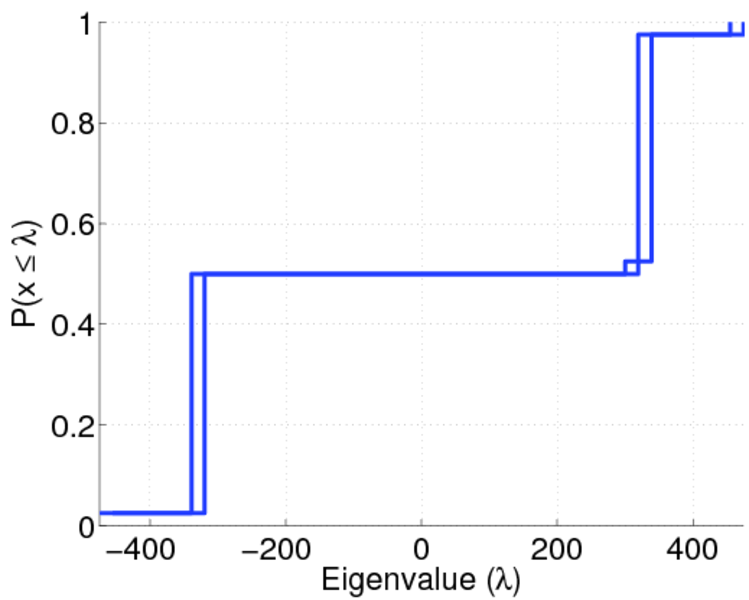
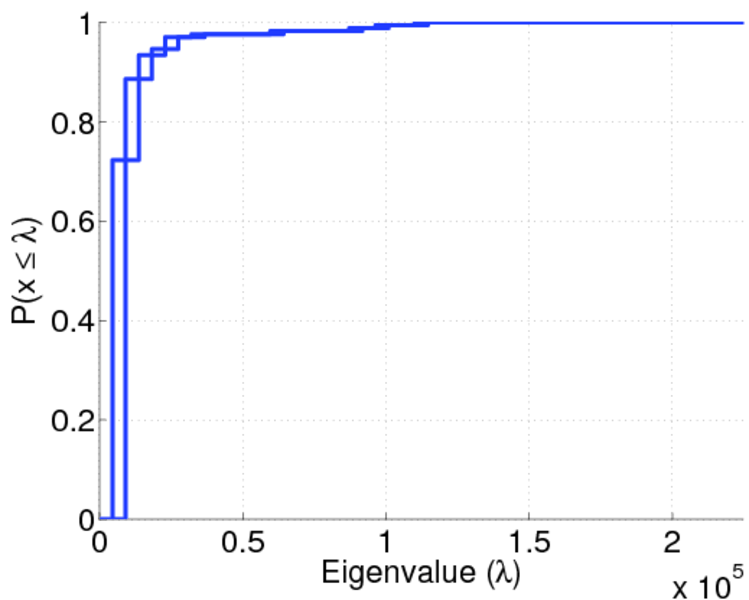
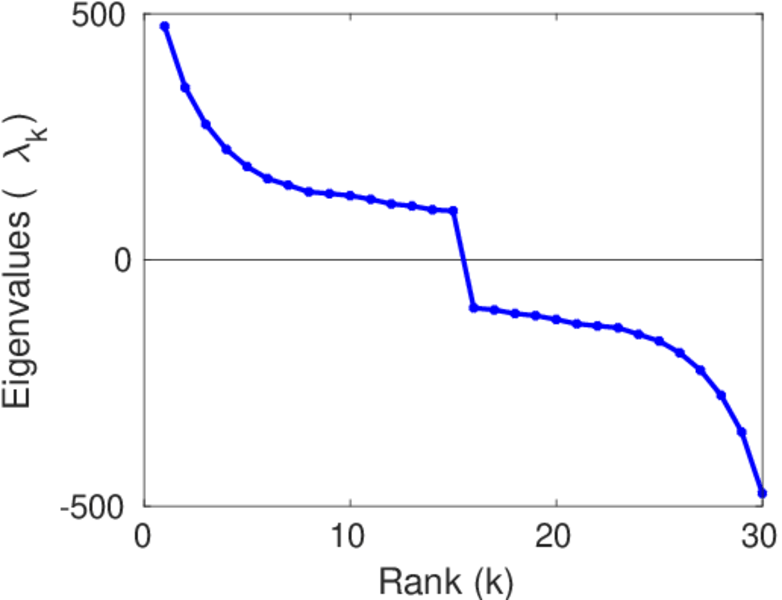
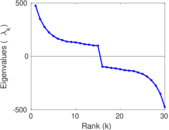
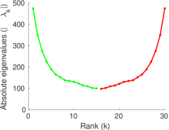
| Spectral norm | α = | 474.580
|
| Operator 2-norm | ν = | 474.472
|
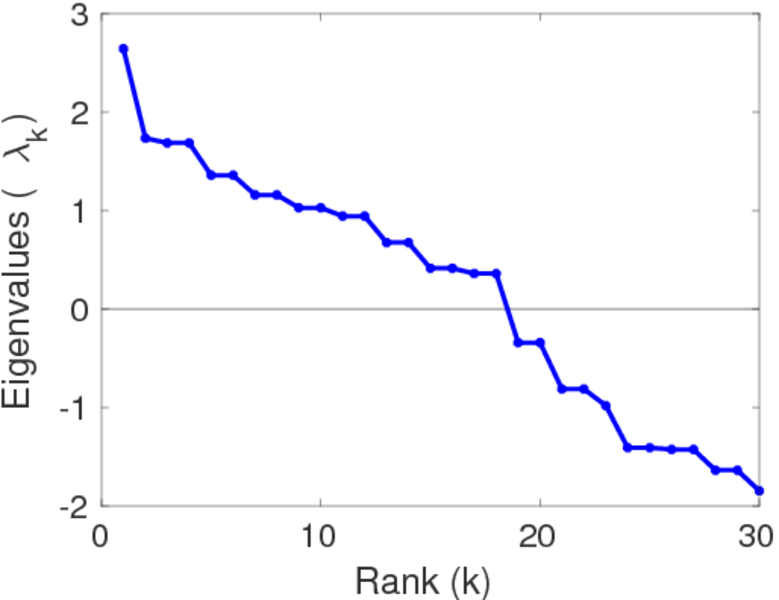
| Cyclic eigenvalue | π = | 2.643 58
|
| Reciprocity | y = | 6.139 77 × 10−6
|
| Non-bipartivity | bA = | 0.000 393 239
|
| Normalized non-bipartivity | bN = | 0.058 508 8
|
| Algebraic non-bipartivity | χ = | 0.715 120
|
| Spectral bipartite frustration | bK = | 0.019 918 4
|
| Controllability | C = | 462,648
|
| Relative controllability | Cr = | 0.708 214
|
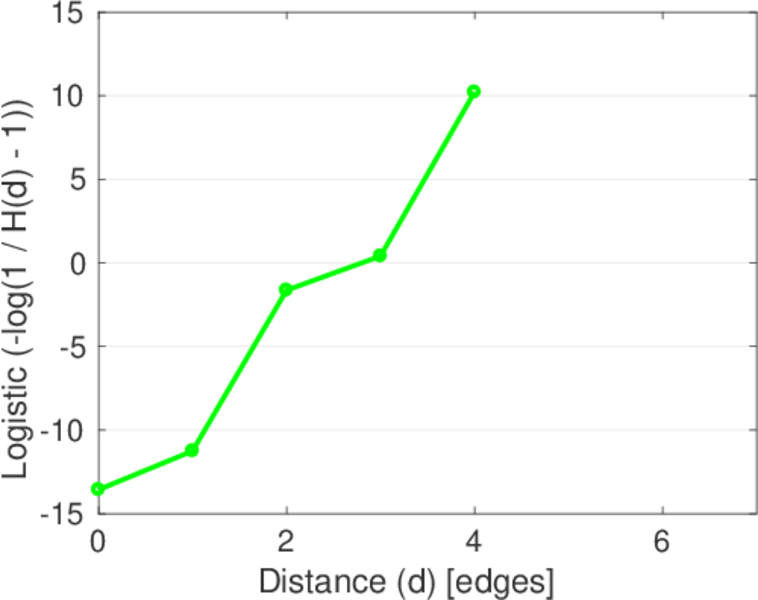
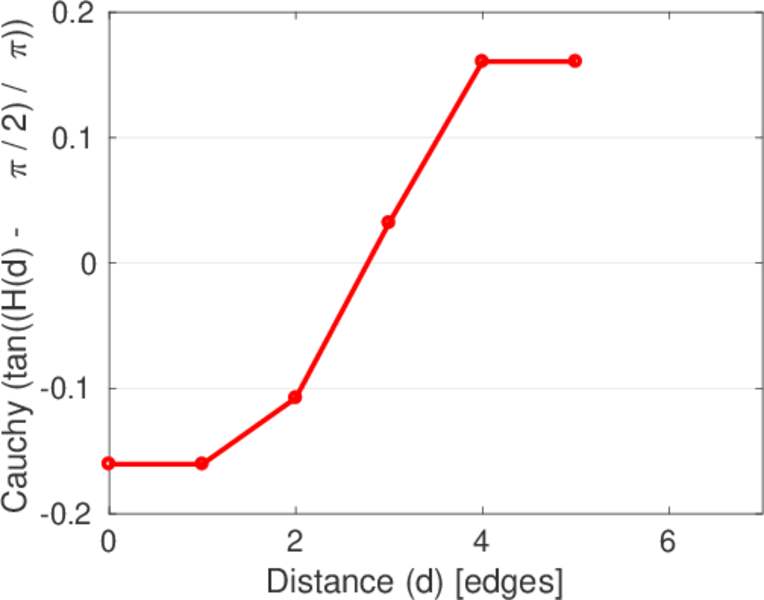
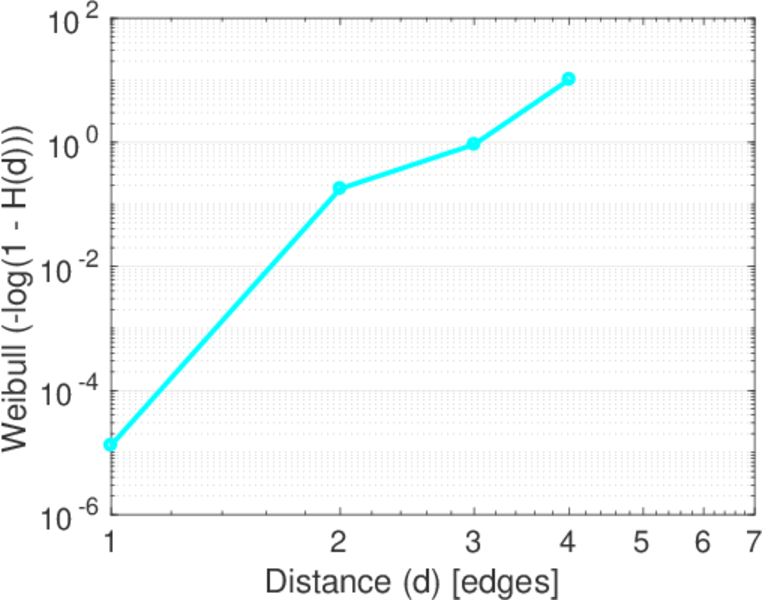
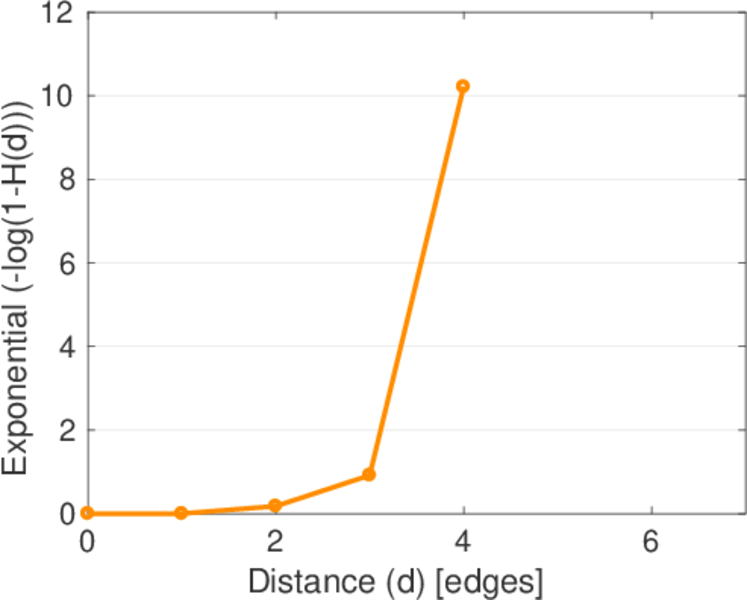
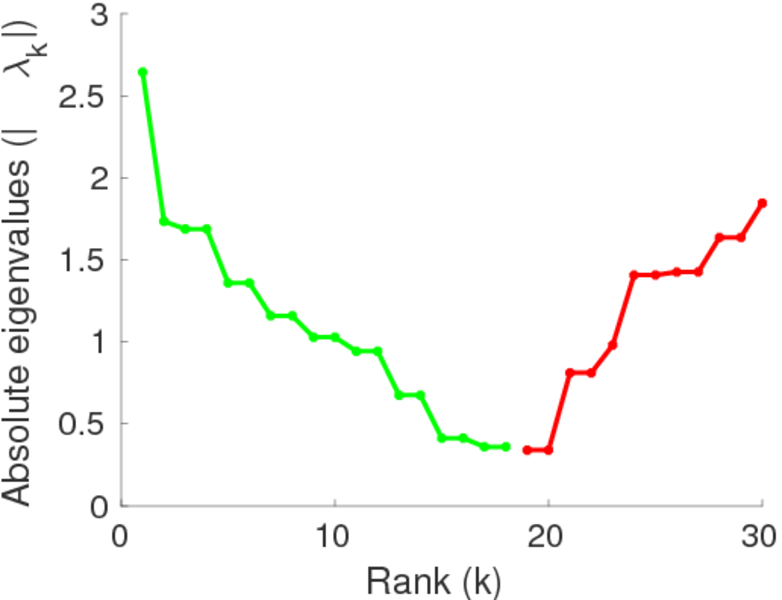
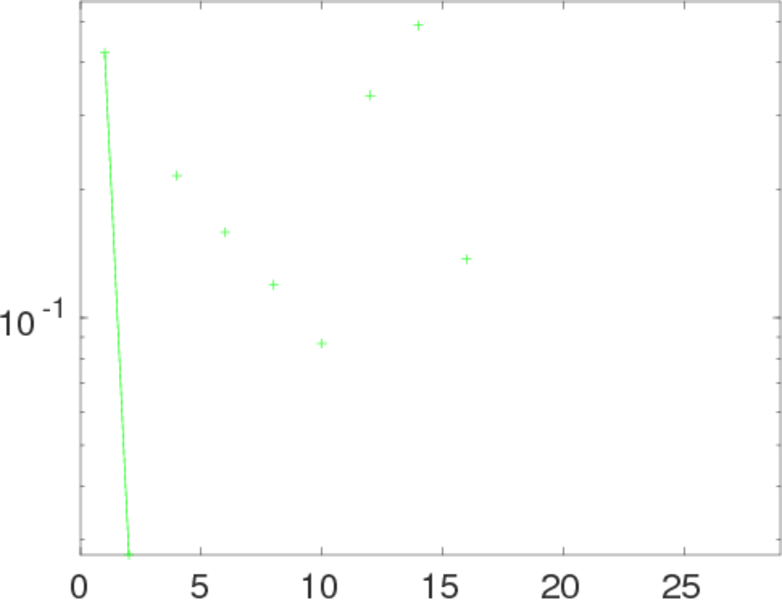
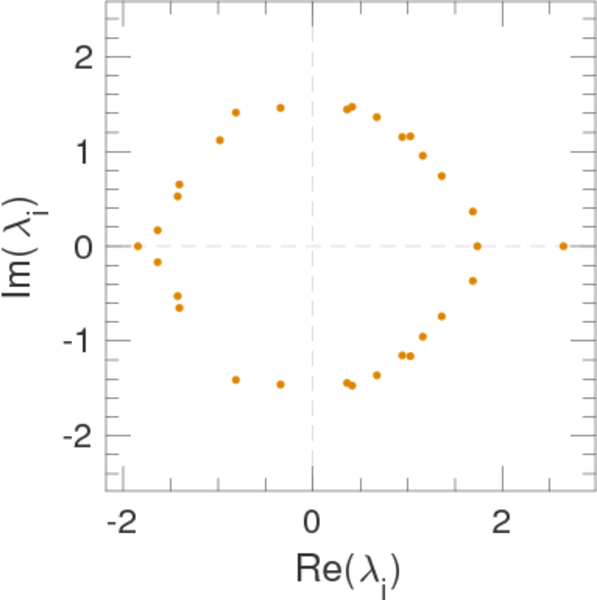
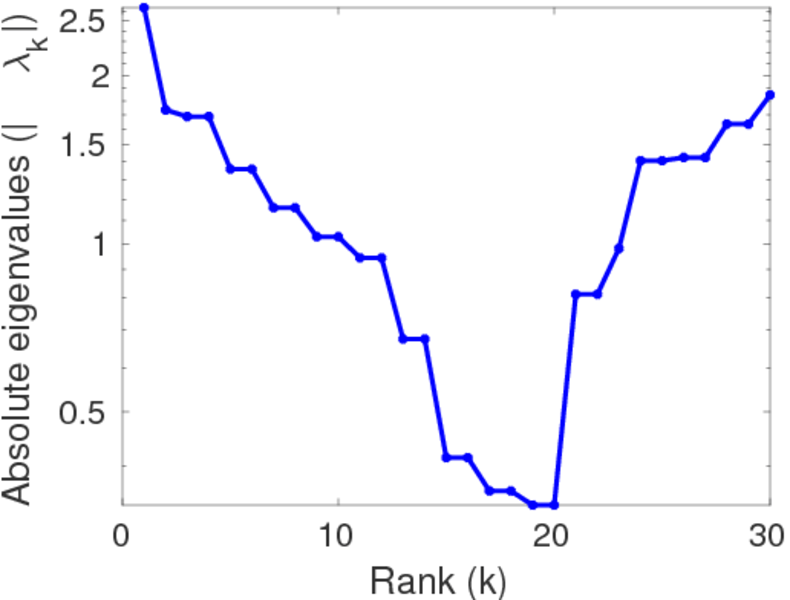
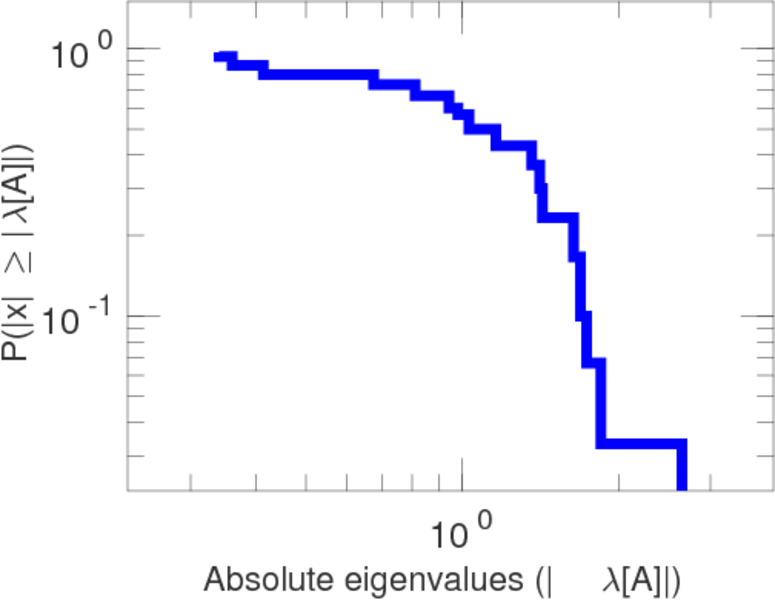
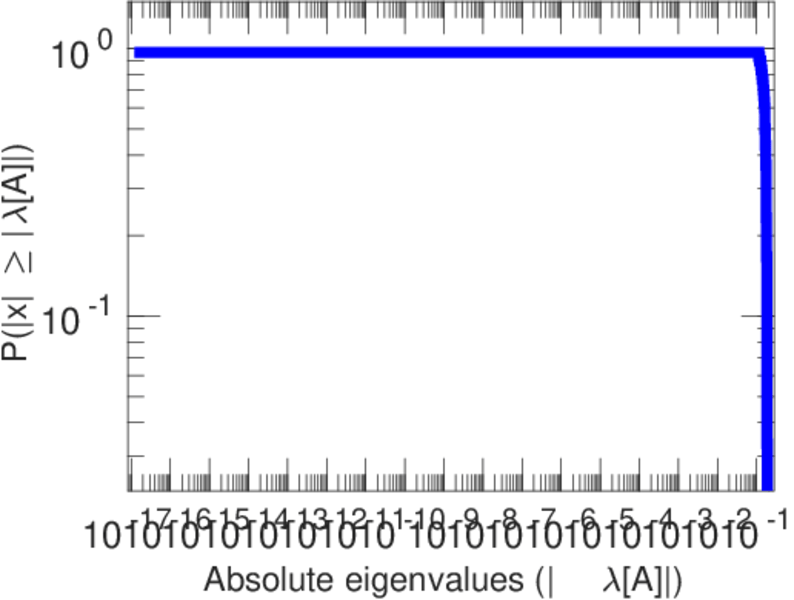
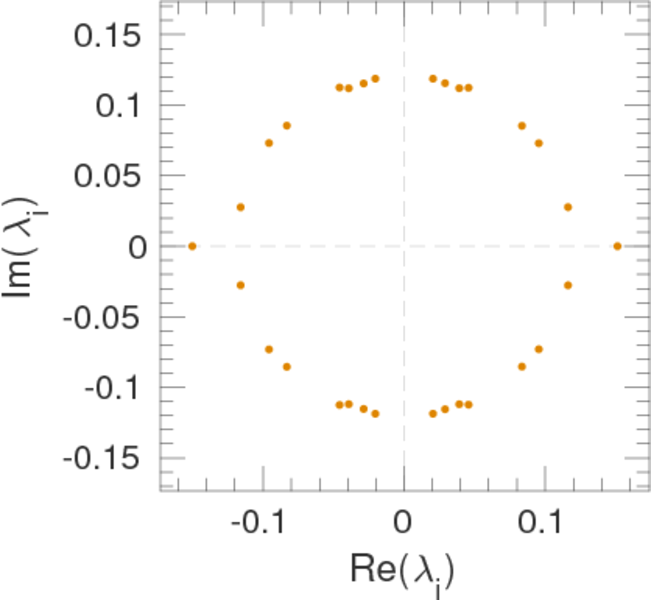
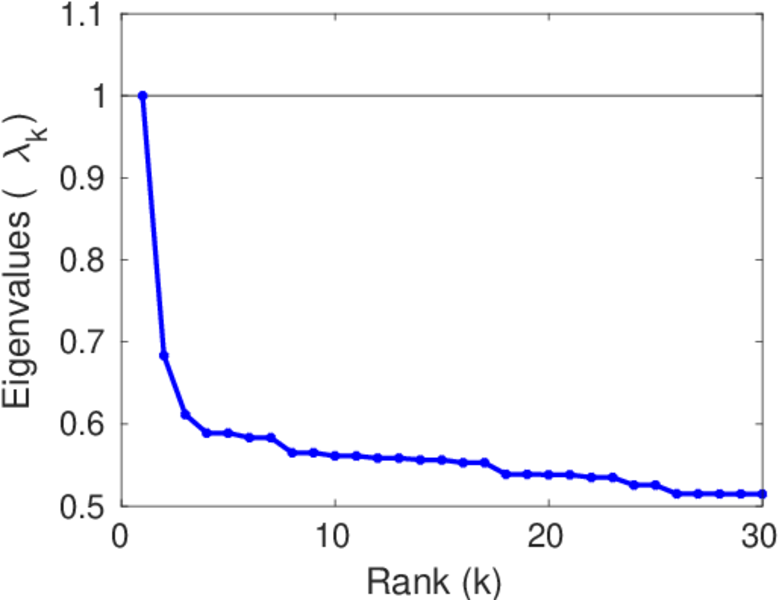
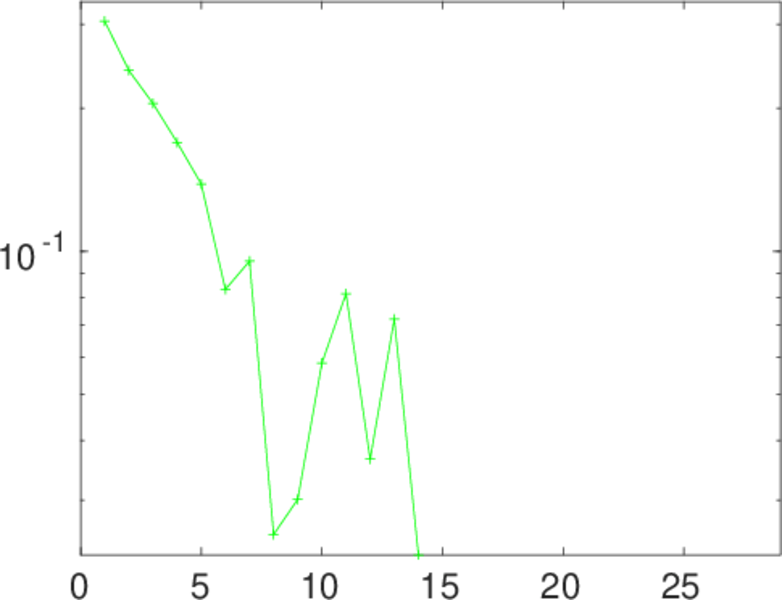
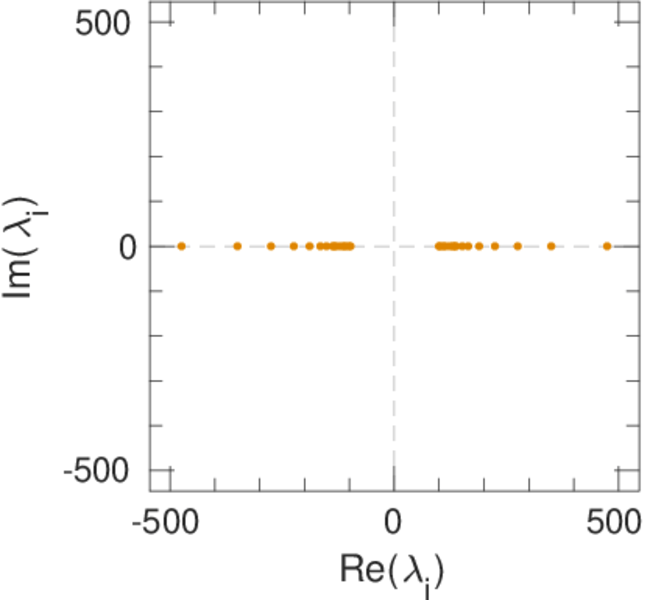
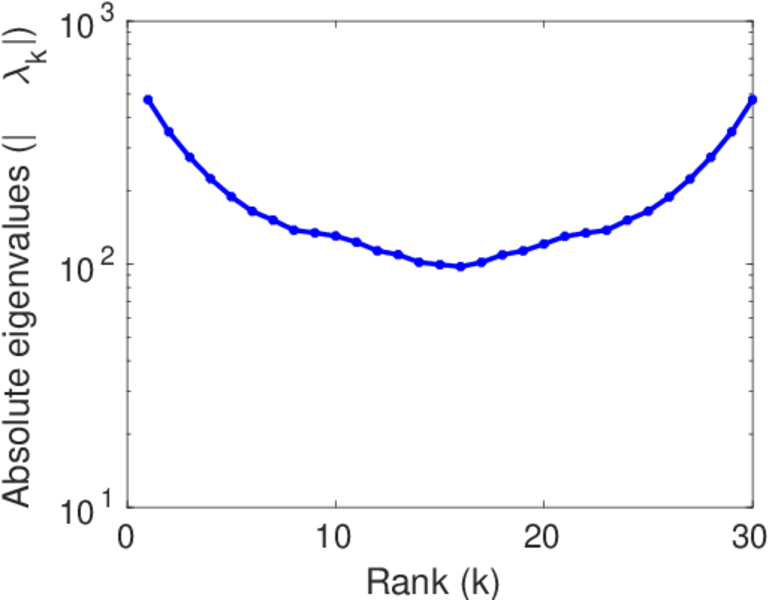
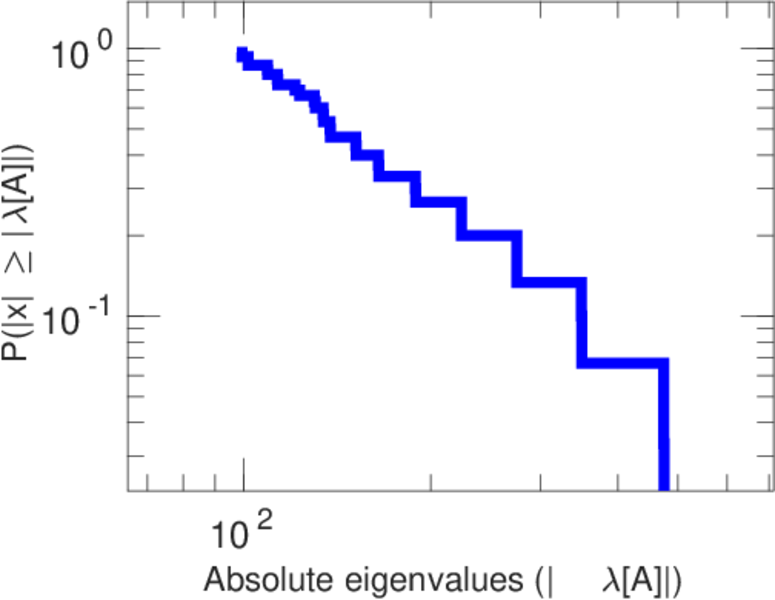
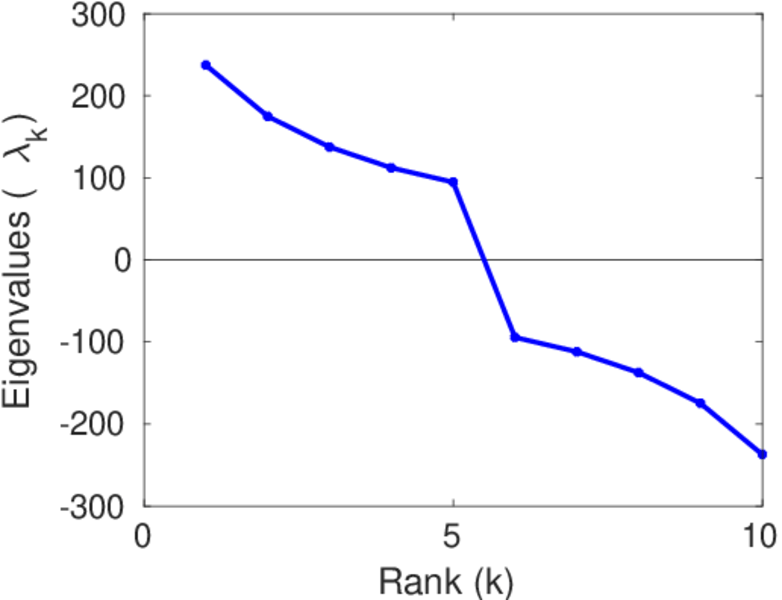
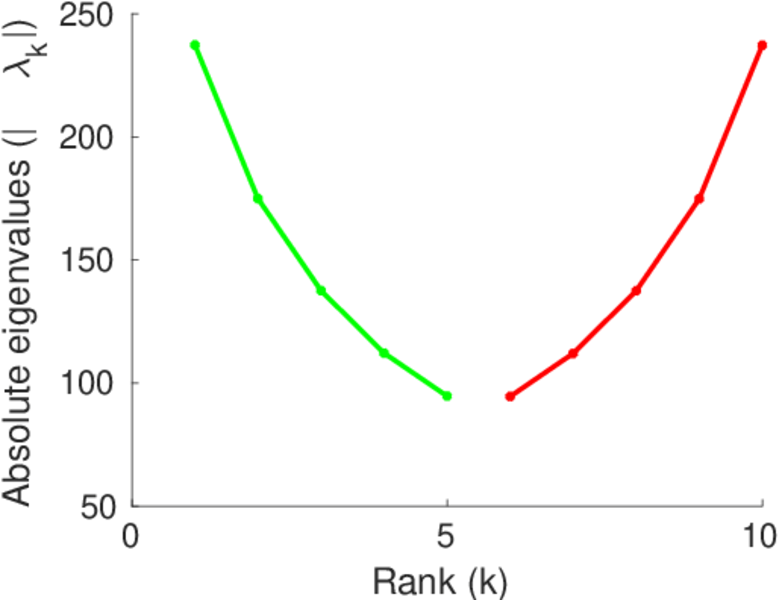
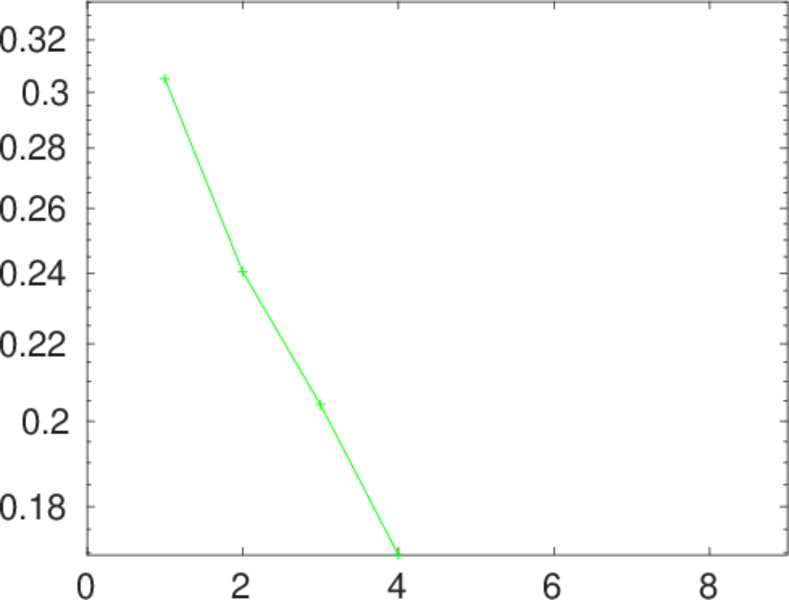
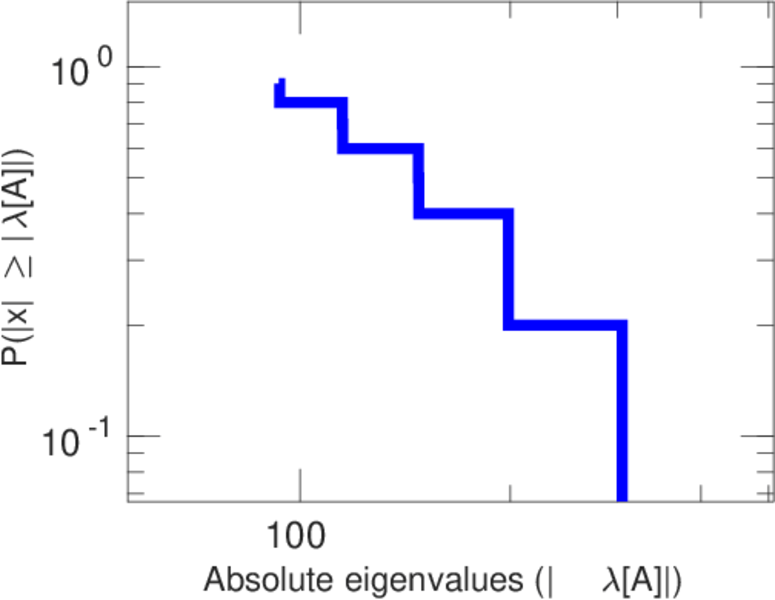
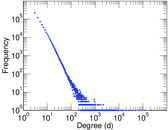
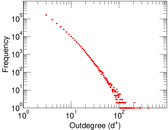
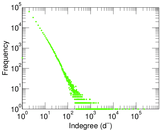
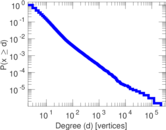
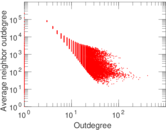
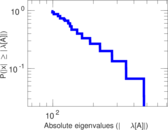
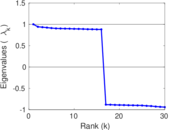
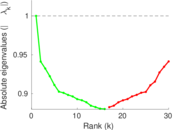
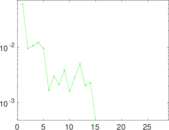
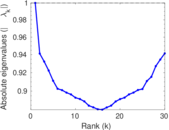
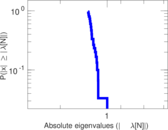
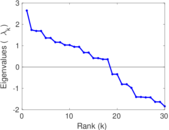
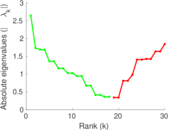
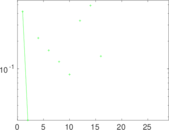
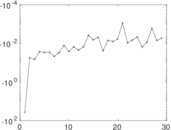
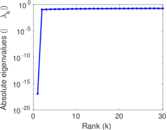
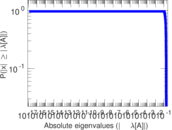
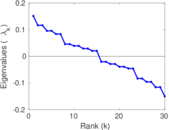
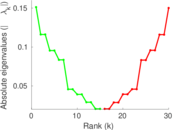
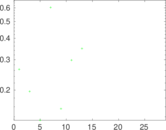
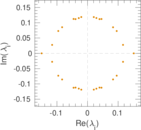
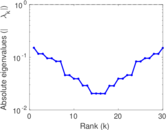
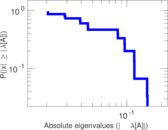
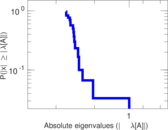
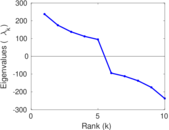
Plots


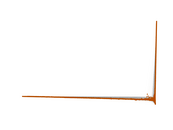


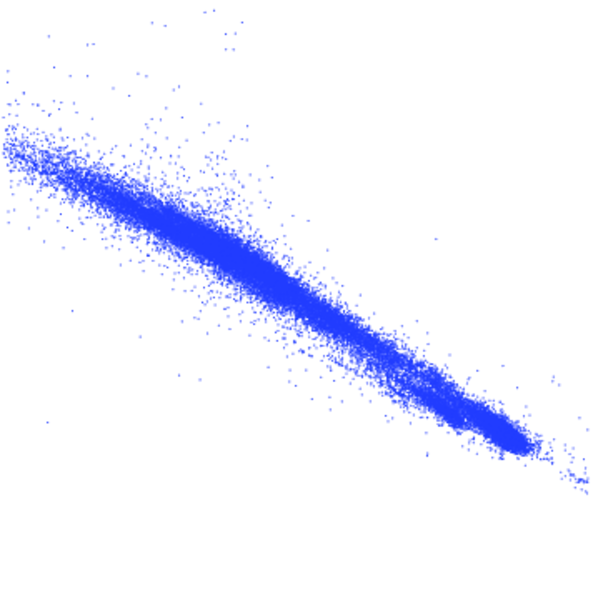
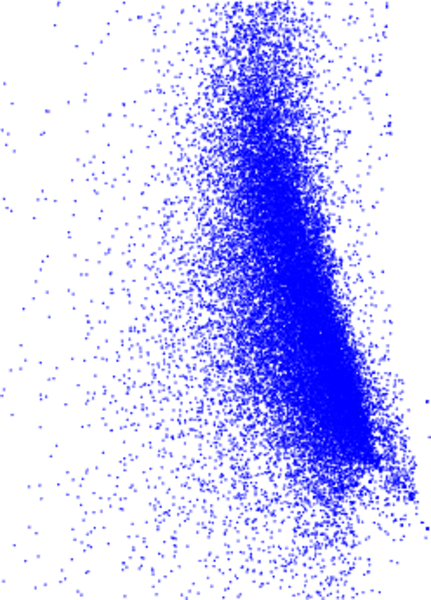
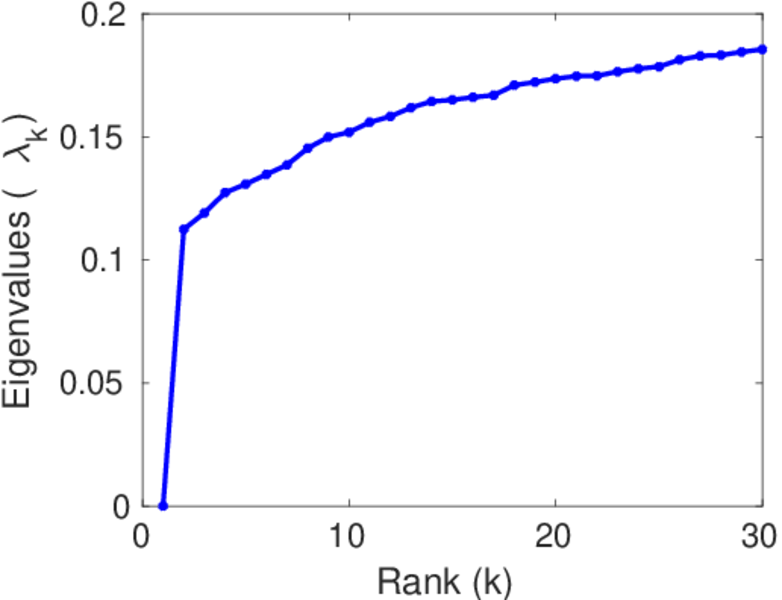
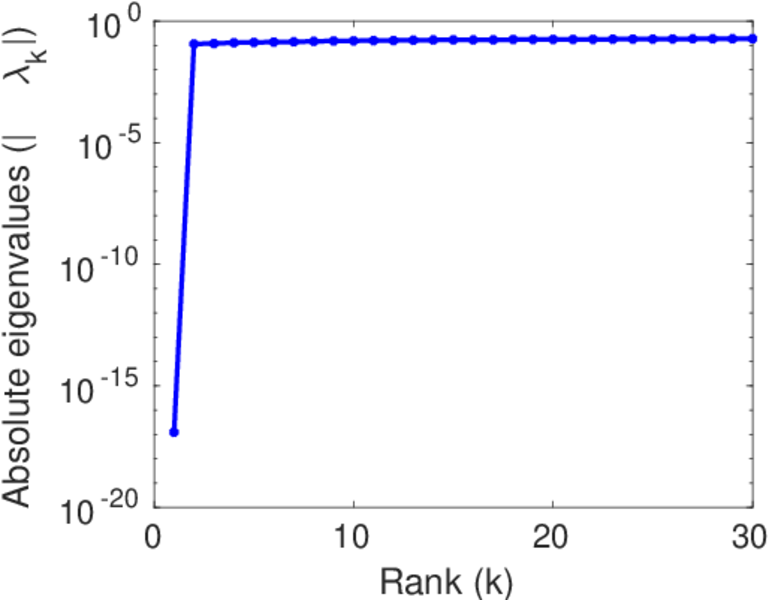
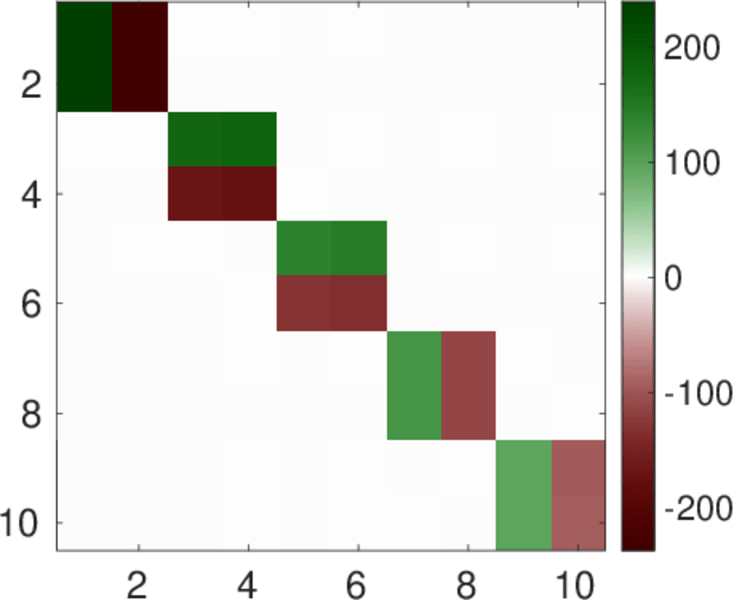
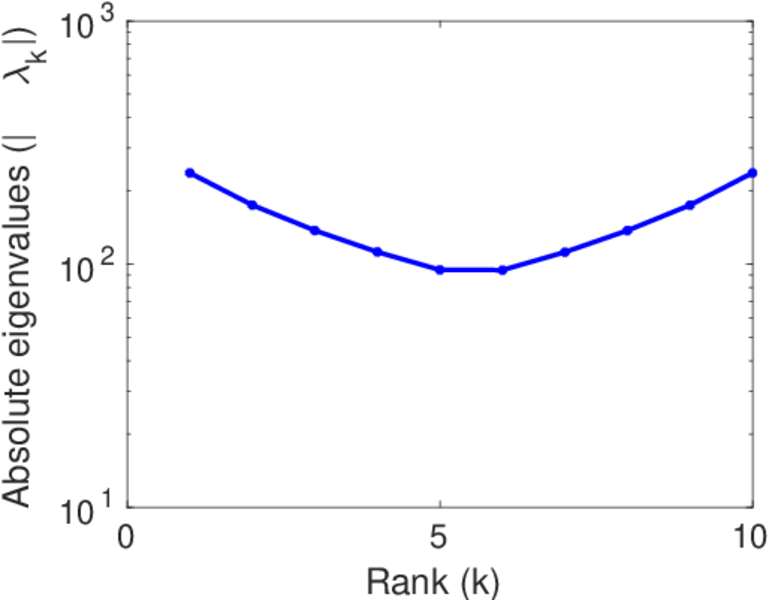
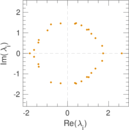
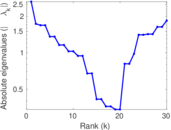
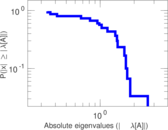
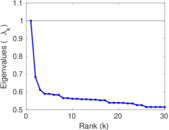
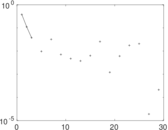
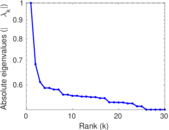
Matrix decompositions plots


Downloads
References
|
[1]
|
Jérôme Kunegis.
KONECT – The Koblenz Network Collection.
In Proc. Int. Conf. on World Wide Web Companion, pages
1343–1350, 2013.
[ http ]
|
 KONECT ‣ Networks ‣
Buy Me a Coffee
KONECT ‣ Networks ‣
Buy Me a Coffee