 KONECT ‣ Networks ‣
Buy Me a Coffee
KONECT ‣ Networks ‣
Buy Me a Coffee
| Code | WT
| |
| Internal name | trec-wt10g
| |
| Name | TREC WT10g | |
| Data source | http://ir.dcs.gla.ac.uk/test_collections/access_to_data.html | |
| Availability | Dataset is available for download | |
| Consistency check | Dataset passed all tests | |
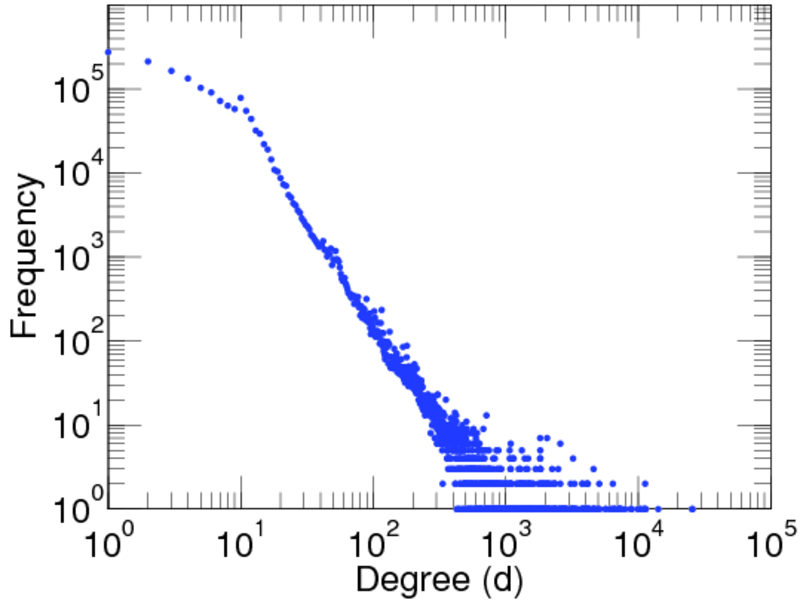
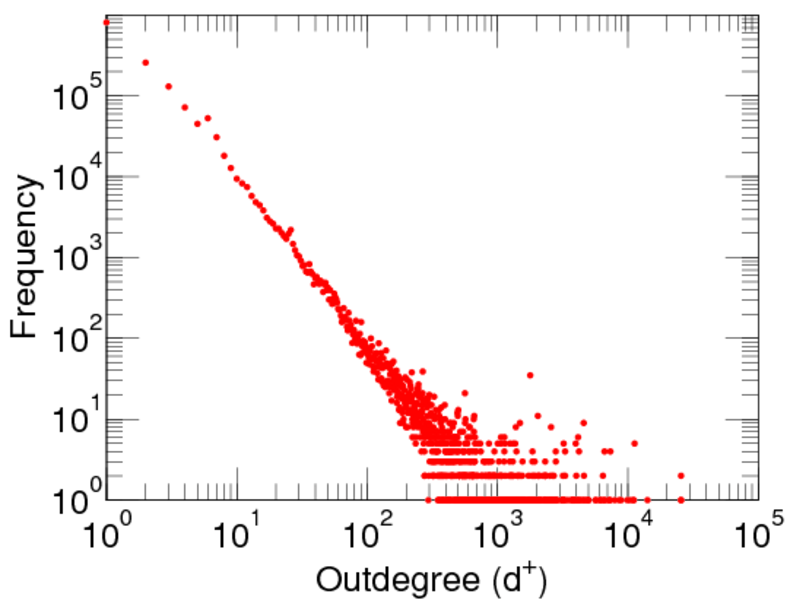
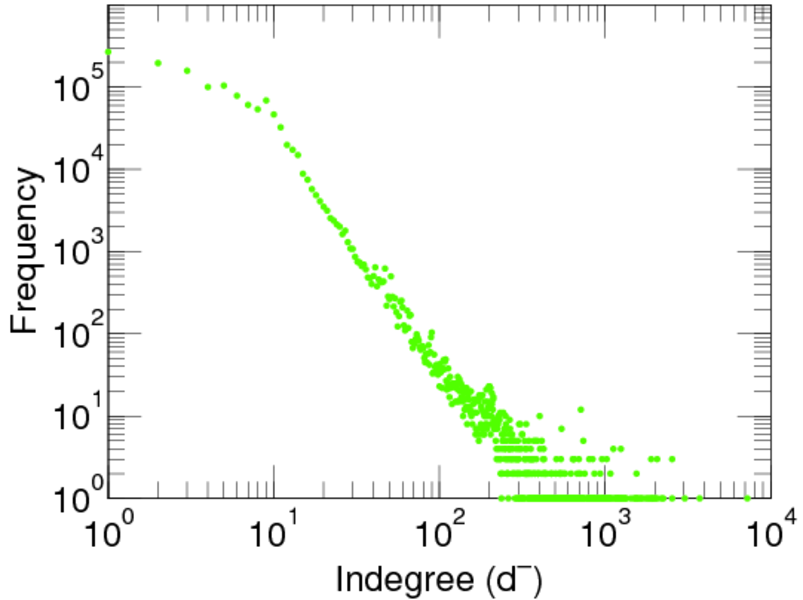
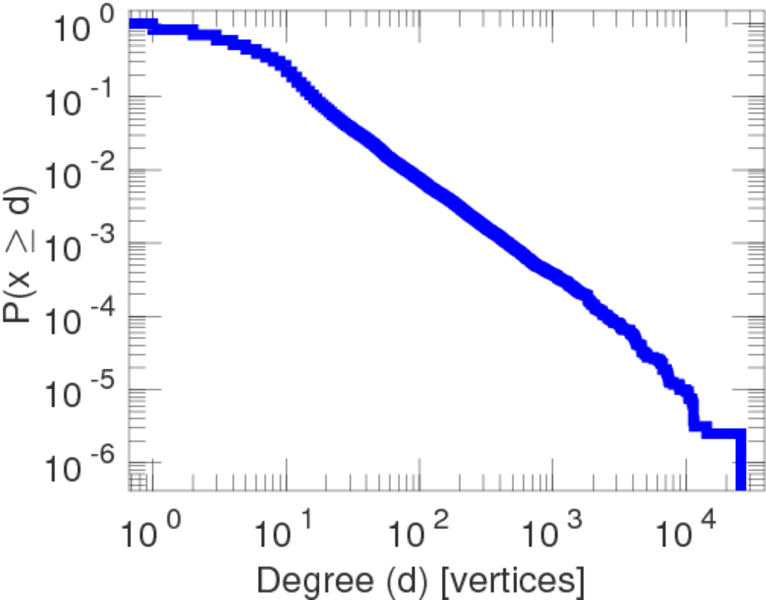
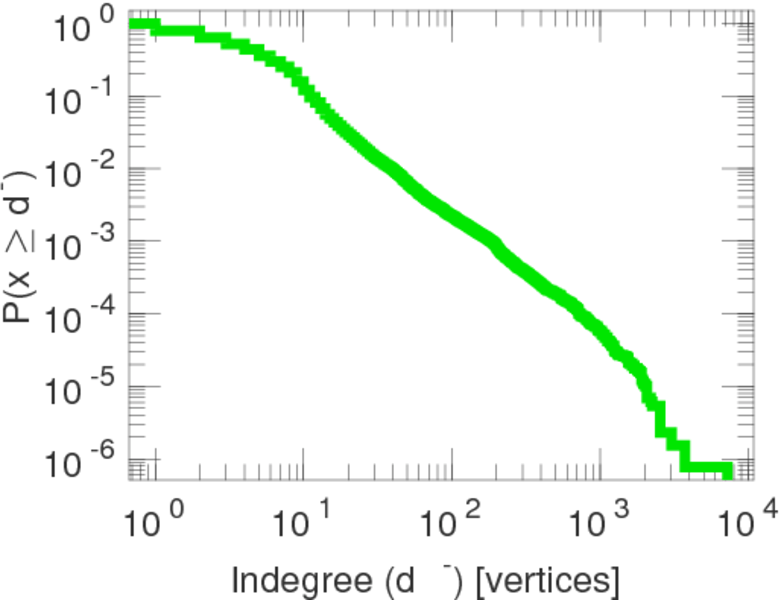
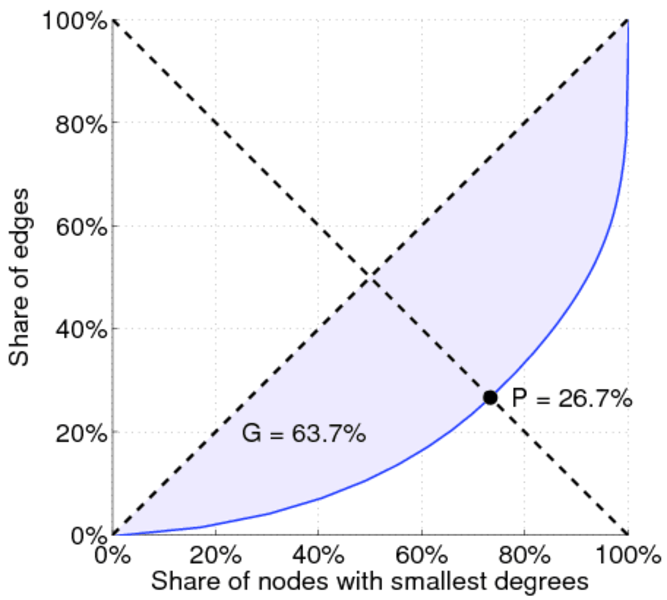
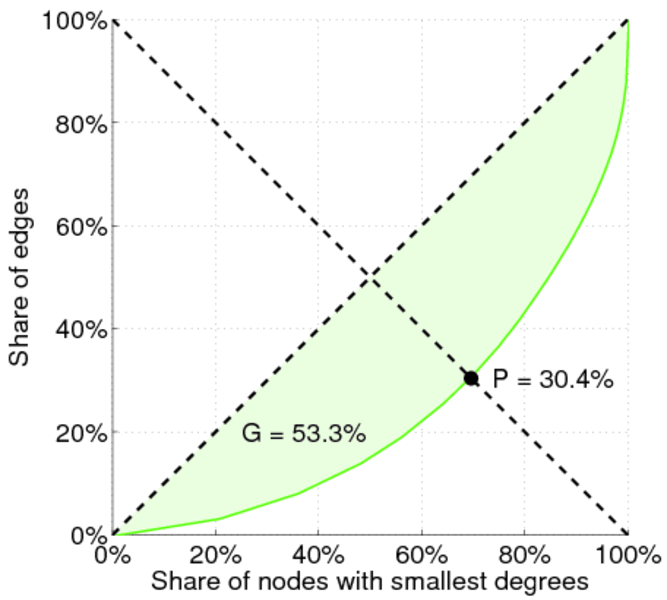
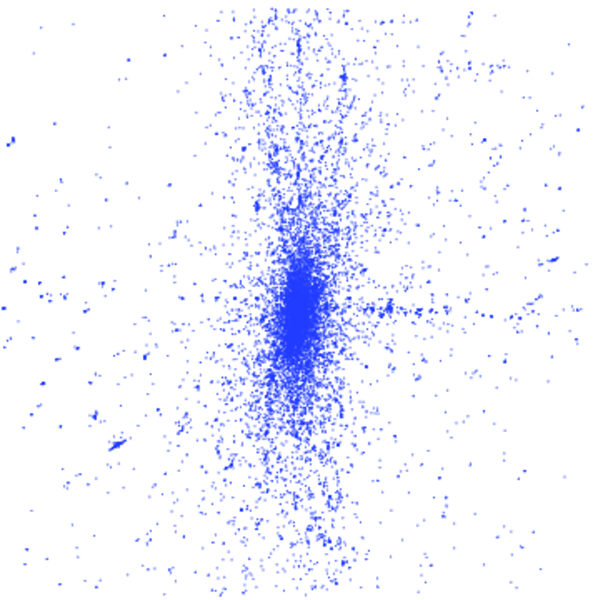
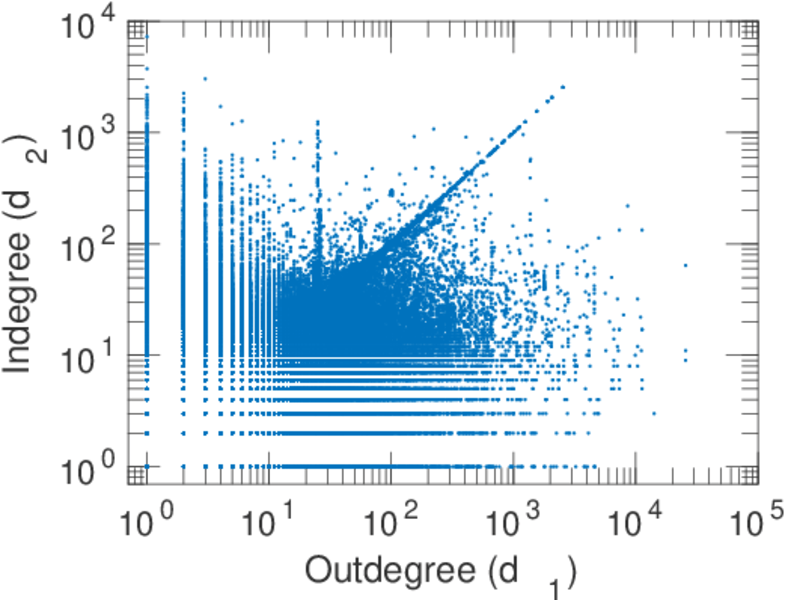
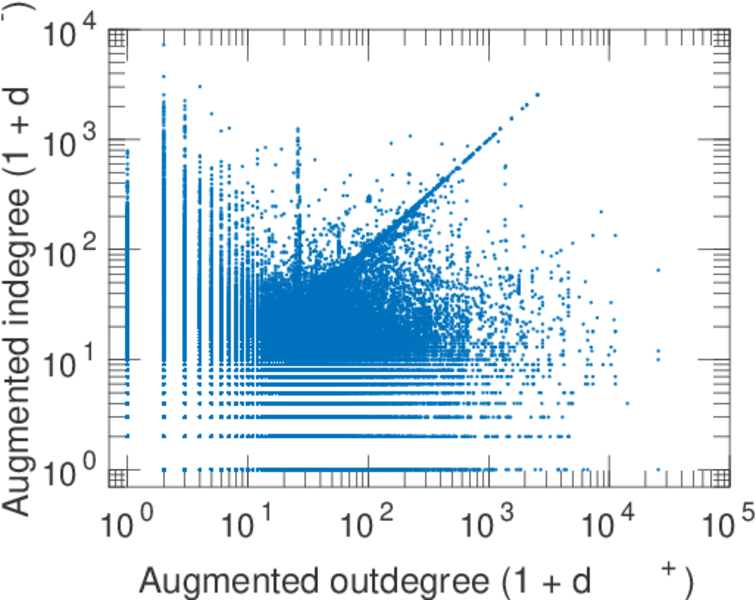
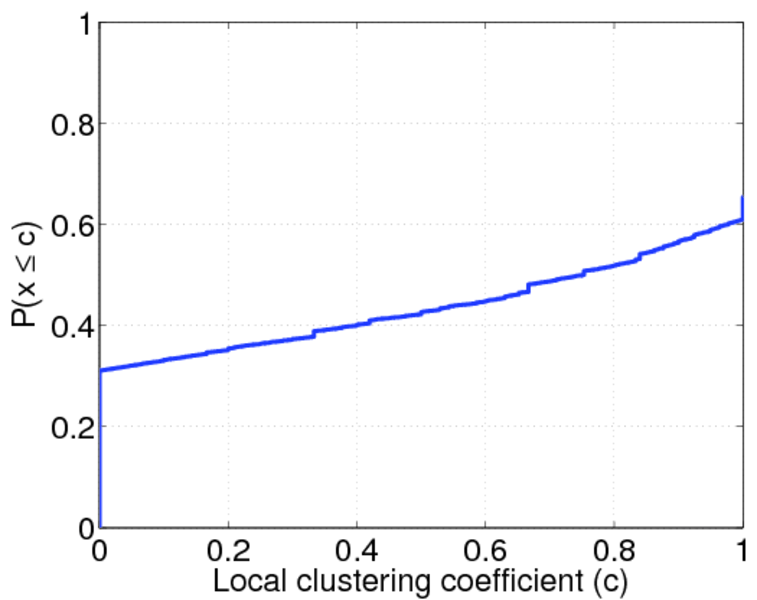
| Category | Hyperlink network | |
| Network format | Unipartite, directed | |
| Edge type | Unweighted, no multiple edges | |
| Reciprocal | Contains reciprocal edges | |
| Directed cycles | Contains directed cycles | |
| Loops | Does not contain loops |


| [1] | Jérôme Kunegis. KONECT – The Koblenz Network Collection. In Proc. Int. Conf. on World Wide Web Companion, pages 1343–1350, 2013. [ http ] |
| [2] | Peter Bailey, Nick Craswell, and David Hawking. Engineering a multi-purpose test collection for Web retrieval experiments. Inf. Process. and Manag., 39(6):853–871, 2003. |