Wikipedia links (eo)
This network consists of the wikilinks of the Wikipedia in the Esperanto
language (eo). Nodes are Wikipedia articles, and directed edges are wikilinks,
i.e., hyperlinks within one wiki. In the wiki source, these are indicated with
[[double brackets]]. Only pages in the article namespace are included.
Metadata
Statistics
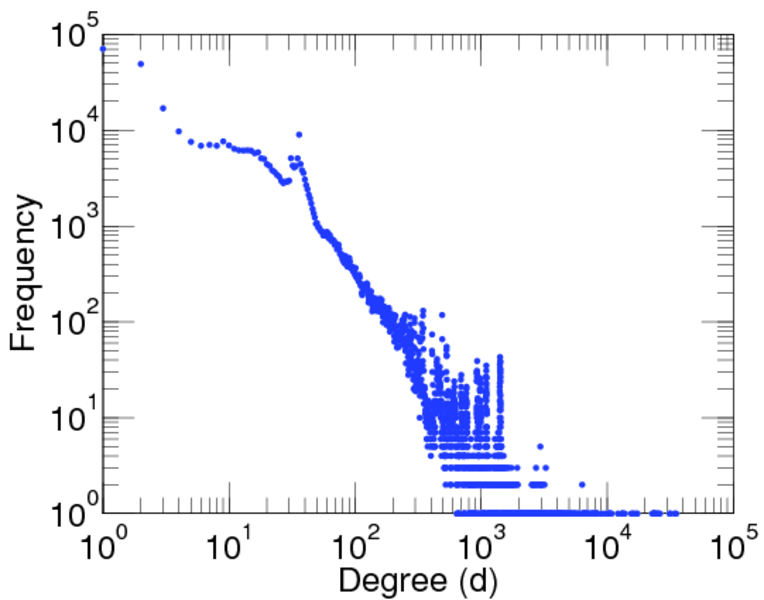
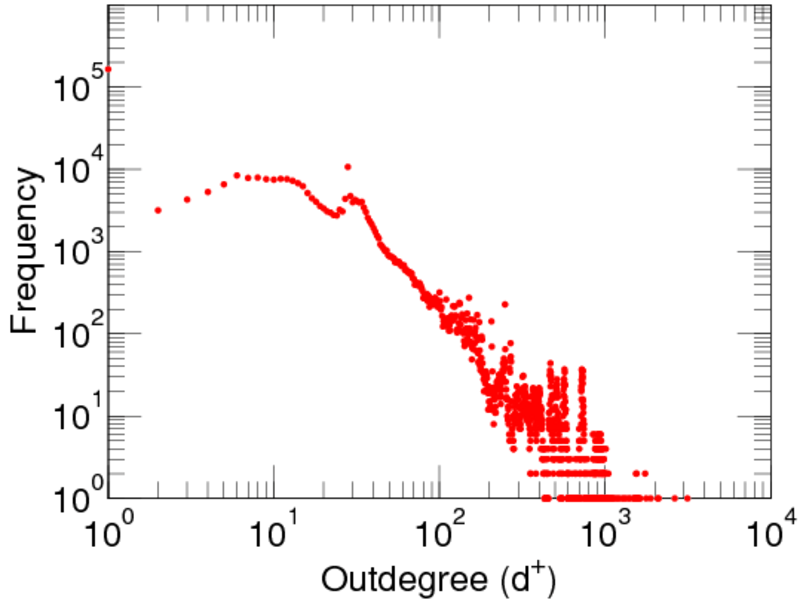
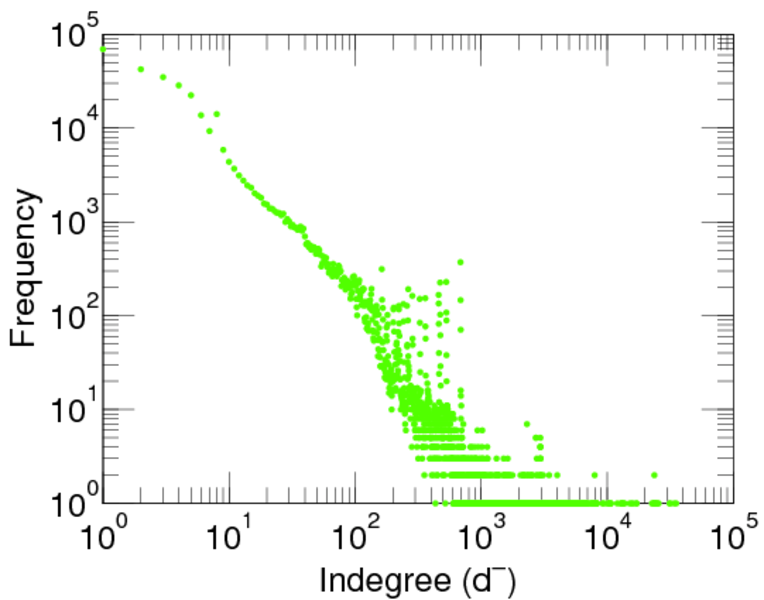
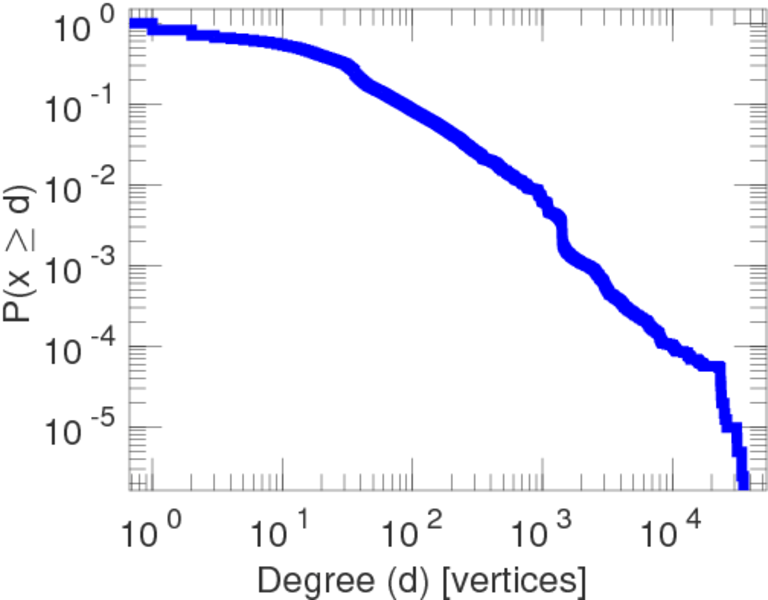
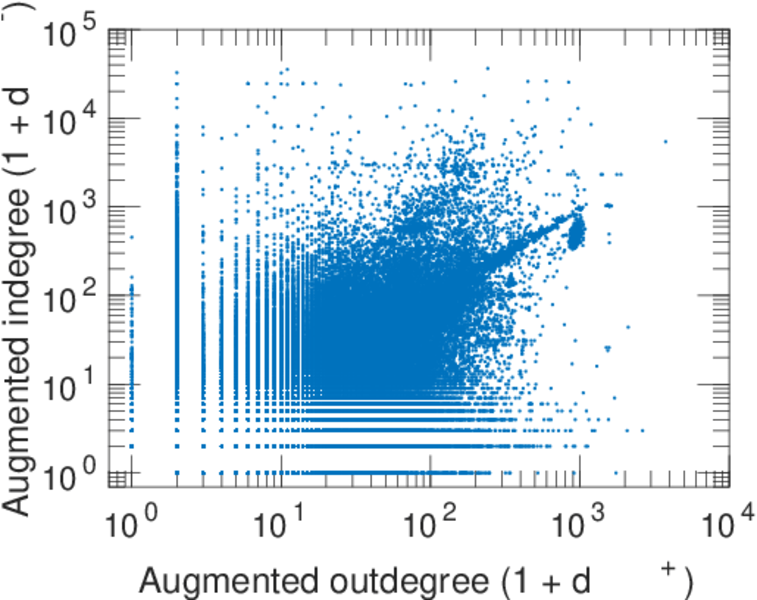
| Size | n = | 412,997
|
| Volume | m = | 10,424,529
|
| Loop count | l = | 962
|
| Wedge count | s = | 14,839,291,979
|
| Claw count | z = | 90,295,121,465,541
|
| Cross count | x = | 571,072,147,897,726,528
|
| Triangle count | t = | 247,343,461
|
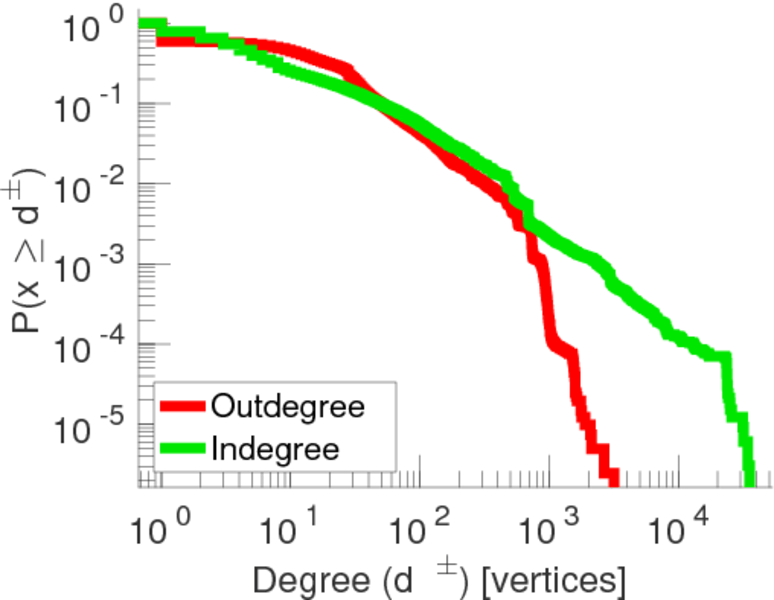
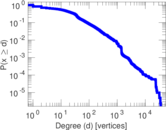
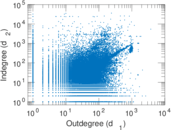
| Maximum degree | dmax = | 36,584
|
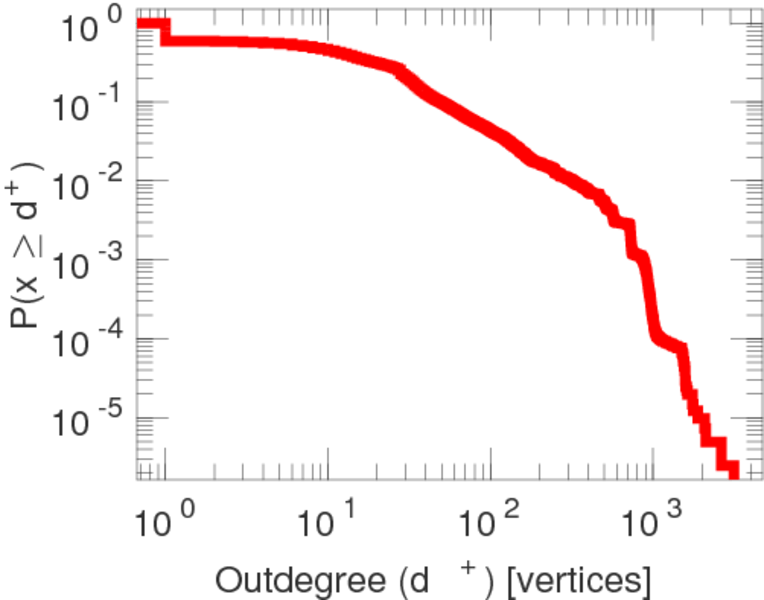
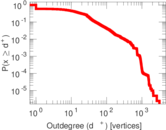
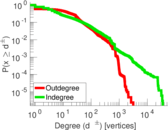
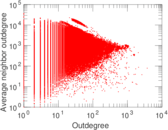
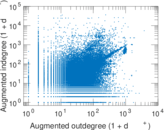
| Maximum outdegree | d+max = | 3,761
|
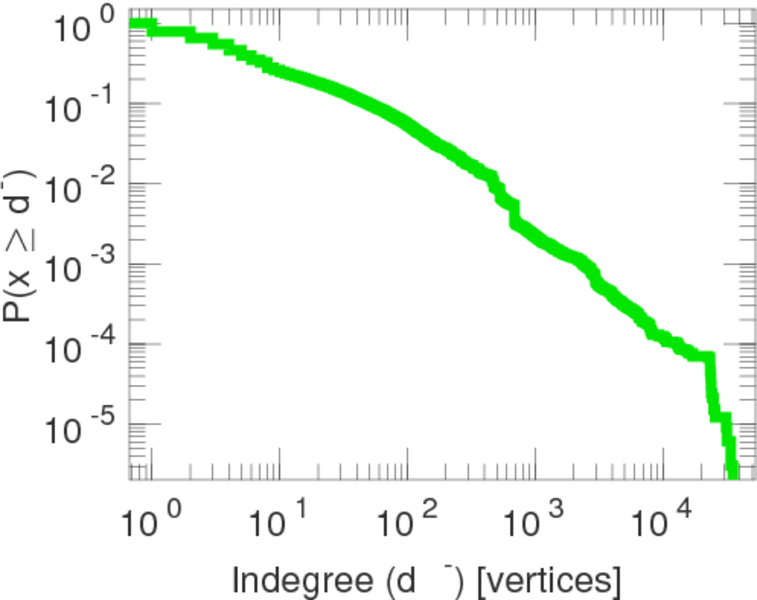
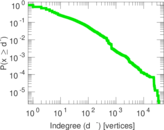
| Maximum indegree | d−max = | 36,343
|
| Average degree | d = | 50.482 3
|
| Size of LCC | N = | 412,955
|
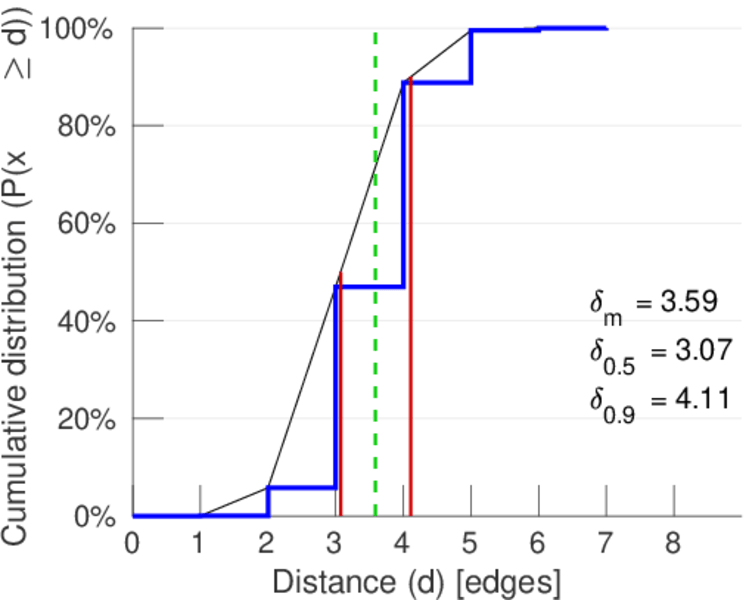
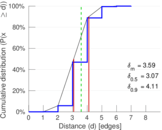
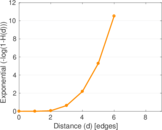
| Diameter | δ = | 9
|
| 50-Percentile effective diameter | δ0.5 = | 3.073 06
|
| 90-Percentile effective diameter | δ0.9 = | 4.111 74
|
| Median distance | δM = | 4
|
| Mean distance | δm = | 3.589 94
|
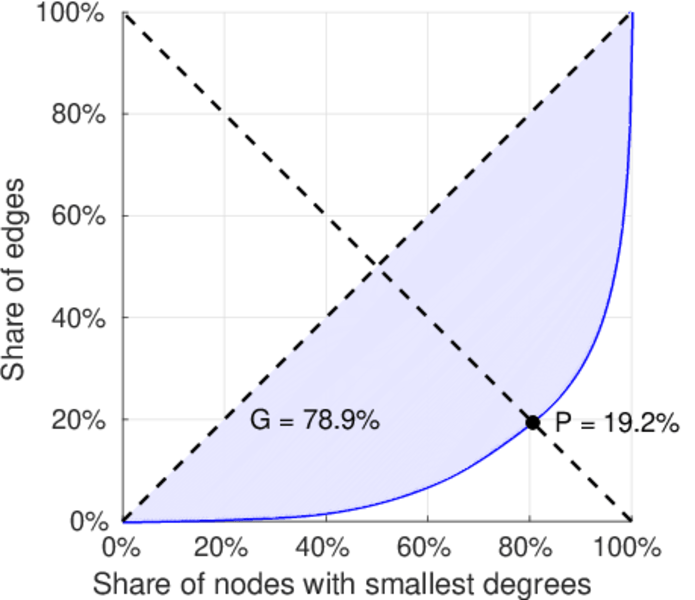
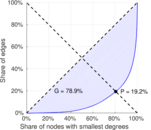
| Gini coefficient | G = | 0.788 593
|
| Balanced inequality ratio | P = | 0.192 269
|
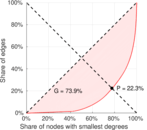
| Outdegree balanced inequality ratio | P+ = | 0.222 558
|
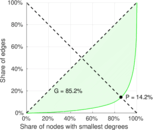
| Indegree balanced inequality ratio | P− = | 0.141 604
|
| Tail power law exponent | γt = | 2.141 00
|
| Degree assortativity | ρ = | −0.101 882
|
| Degree assortativity p-value | pρ = | 0.000 00
|
| In/outdegree correlation | ρ± = | +0.680 780
|
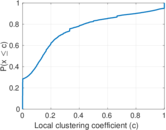
| Clustering coefficient | c = | 0.050 004 4
|
| Directed clustering coefficient | c± = | 0.581 162
|
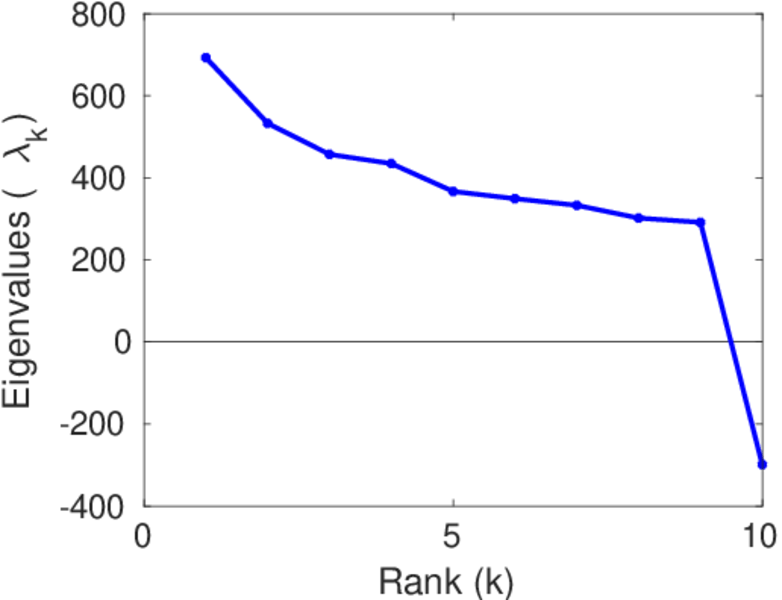
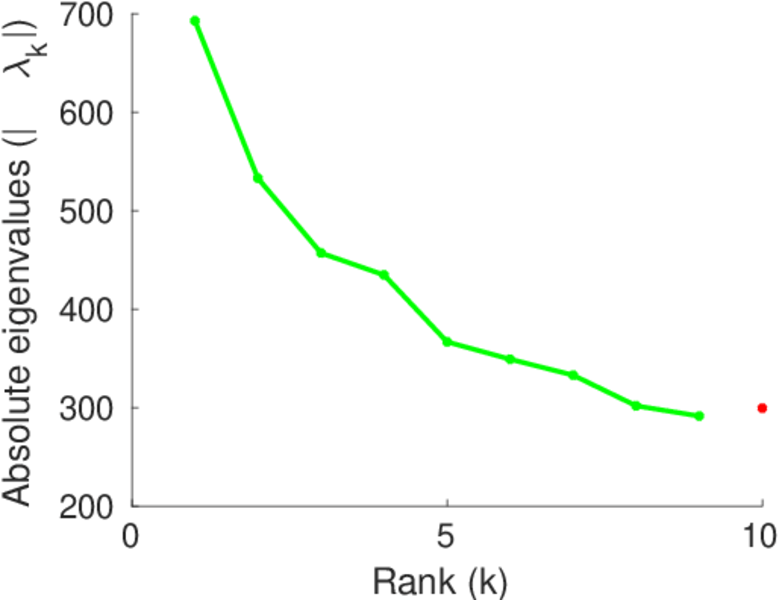
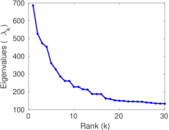
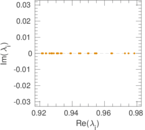
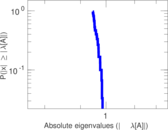
| Spectral norm | α = | 1,385.67
|
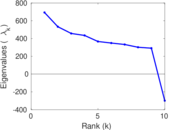
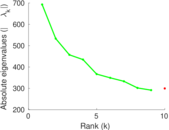
| Operator 2-norm | ν = | 700.852
|
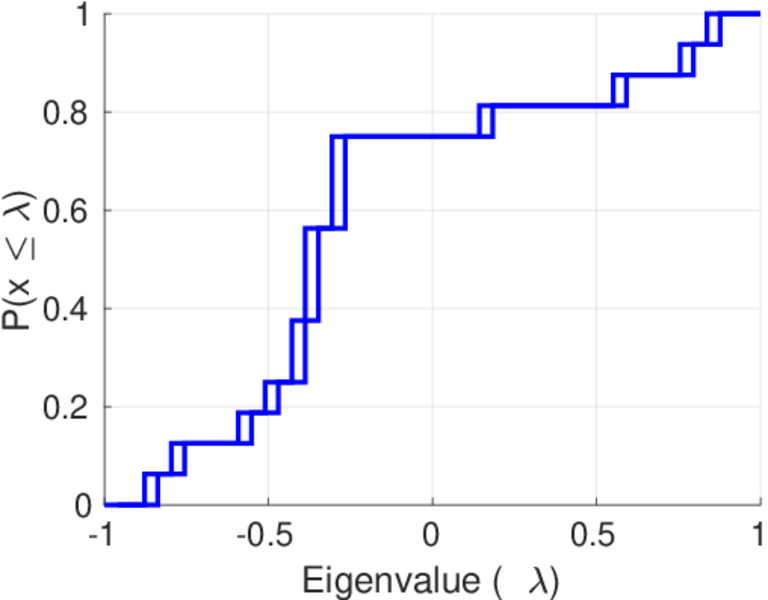
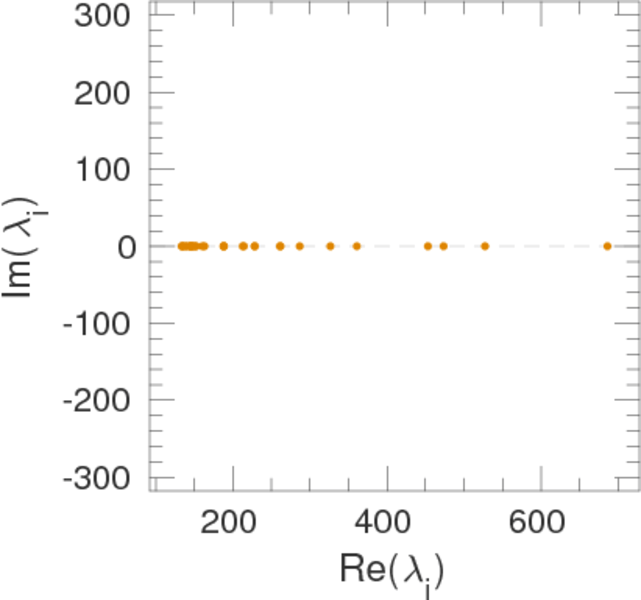
| Cyclic eigenvalue | π = | 686.249
|
| Reciprocity | y = | 0.428 375
|
| Non-bipartivity | bA = | 0.504 167
|
| Normalized non-bipartivity | bN = | 0.073 017 2
|
| Controllability | C = | 154,697
|
| Relative controllability | Cr = | 0.374 572
|
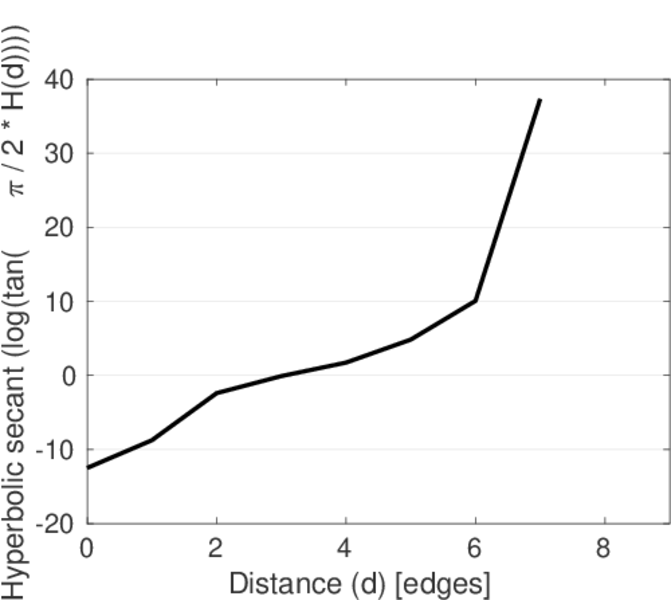
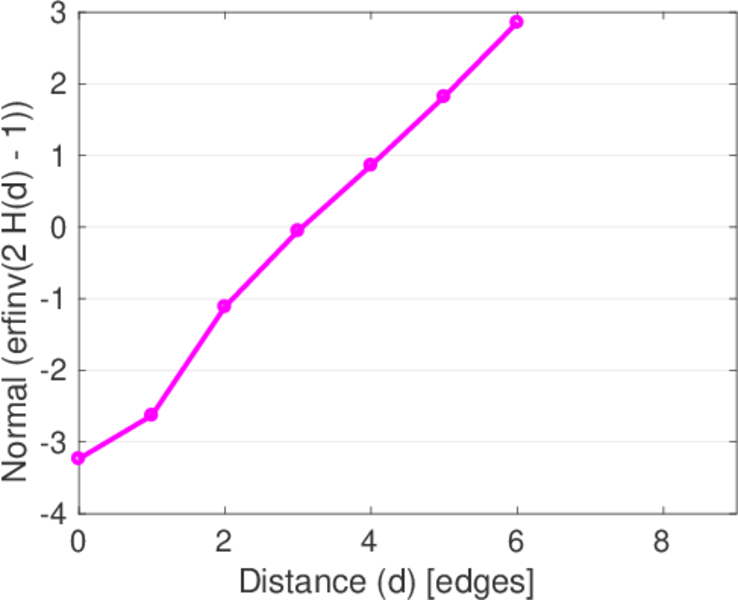
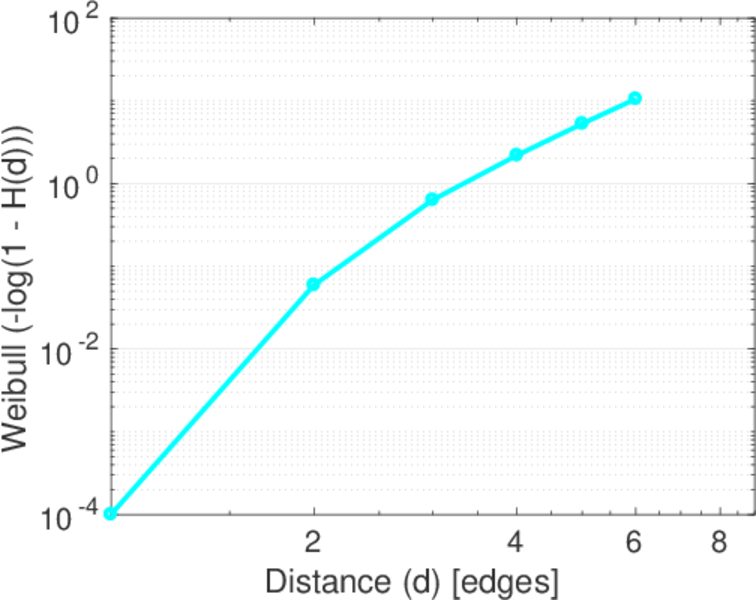
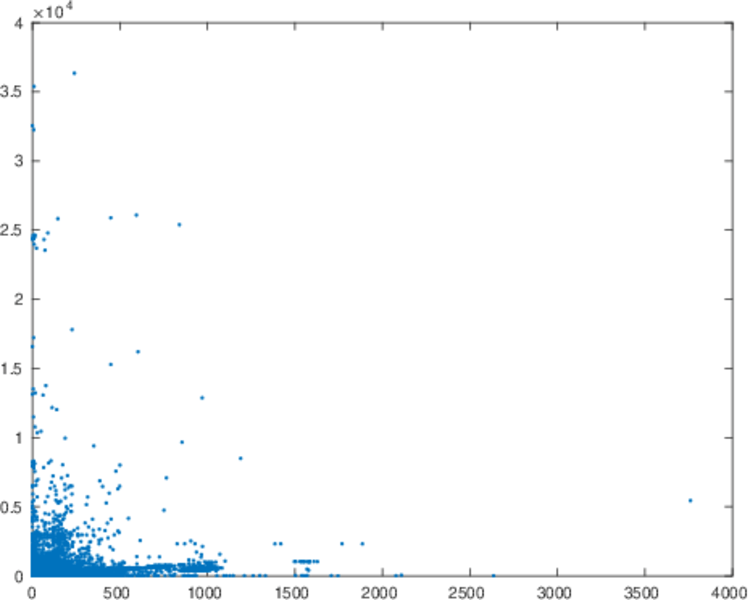
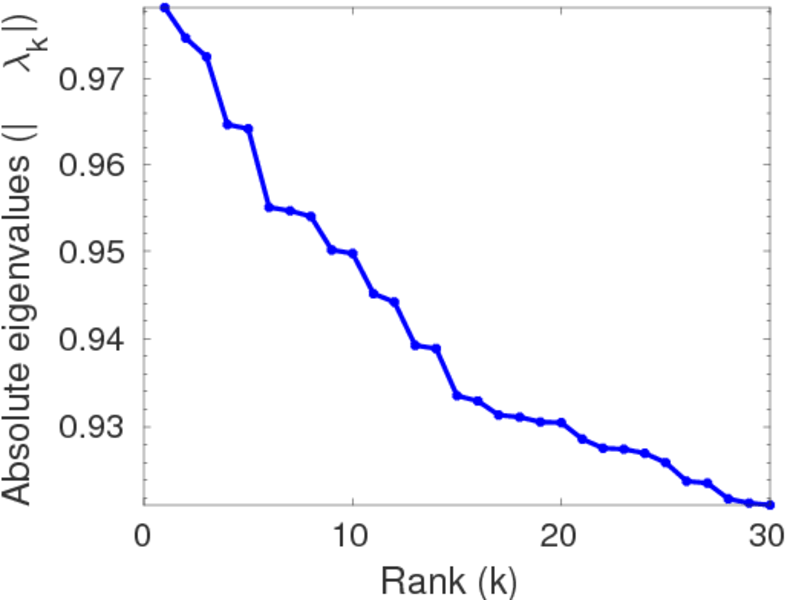
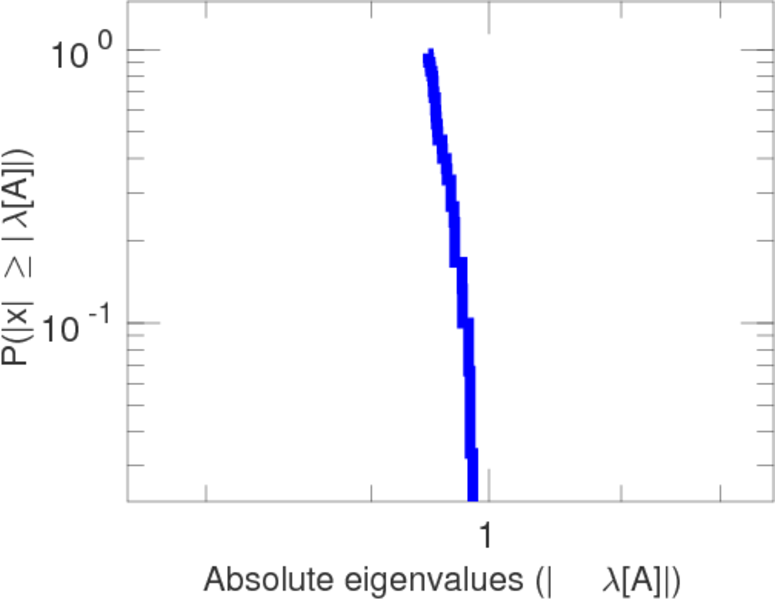
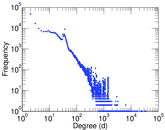
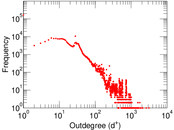
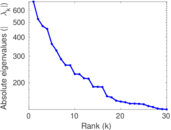
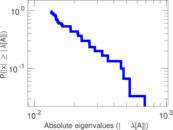
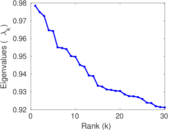
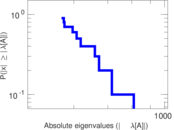
Plots


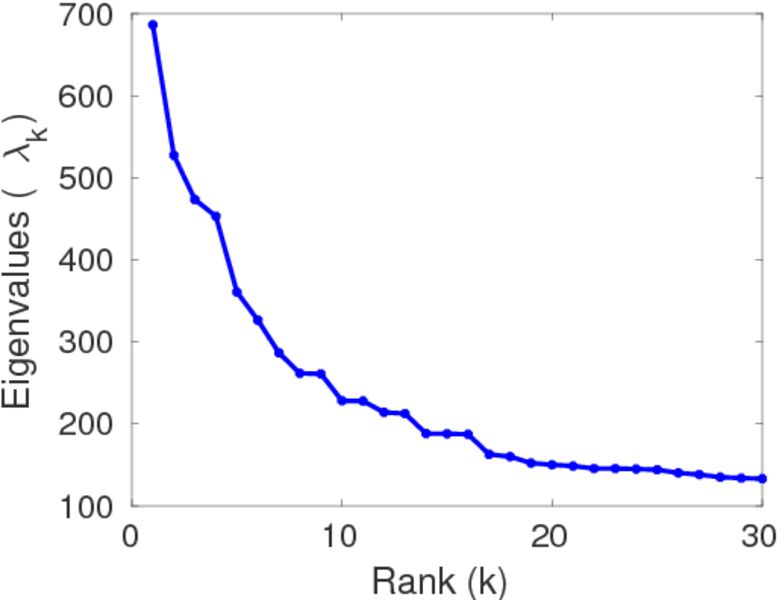
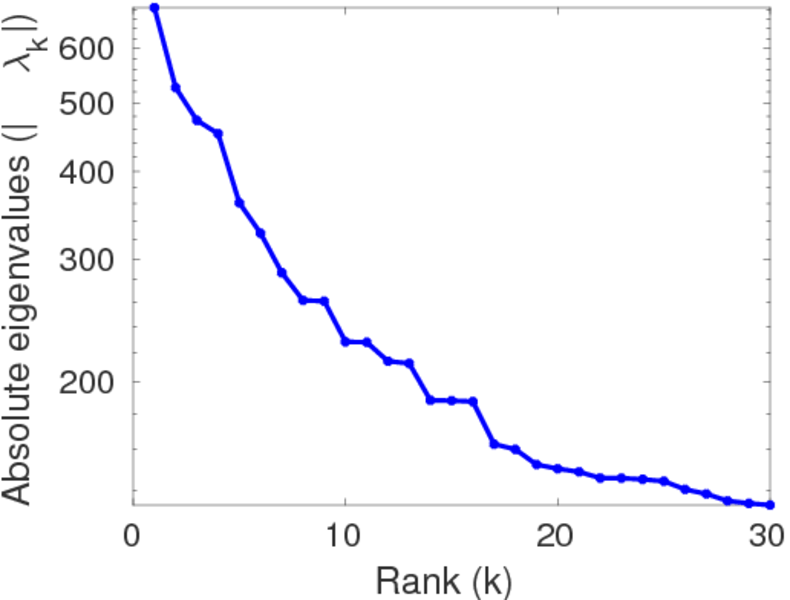
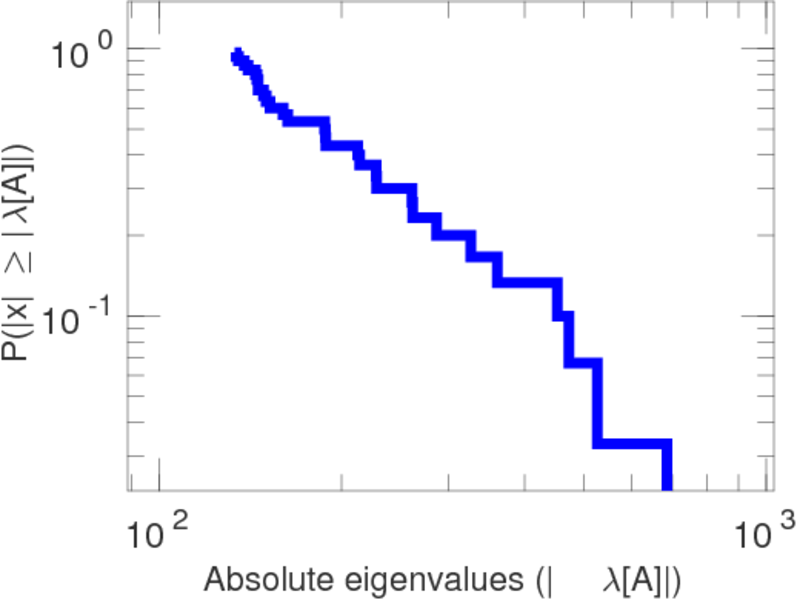
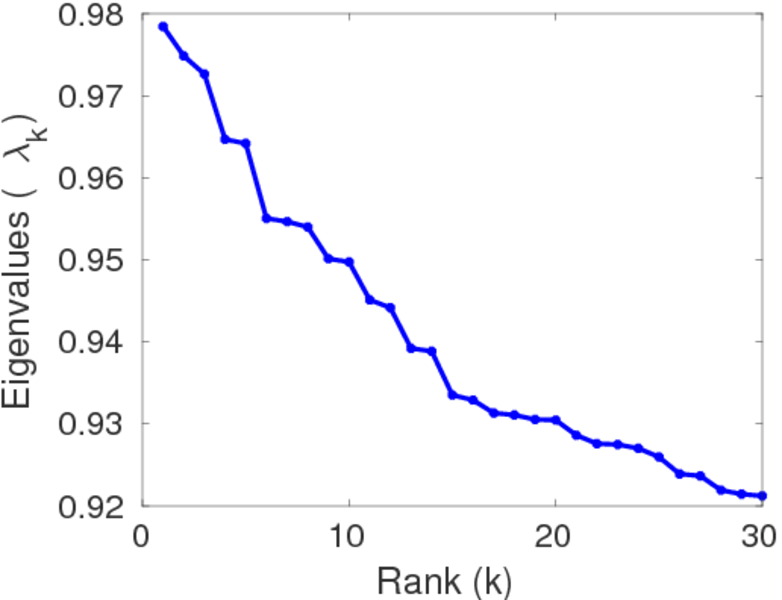
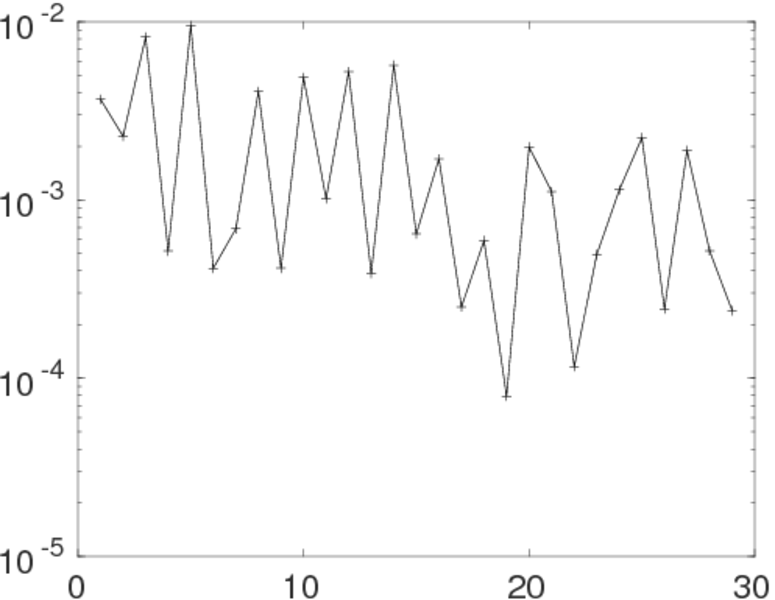
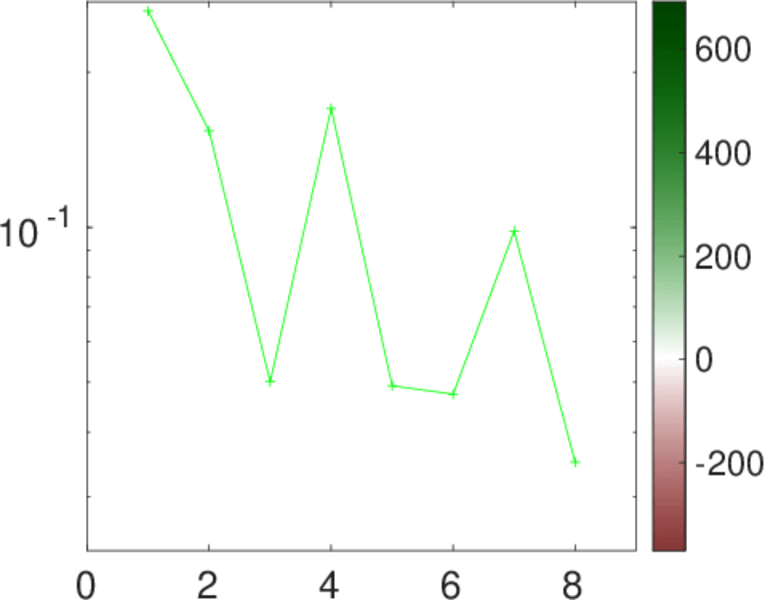
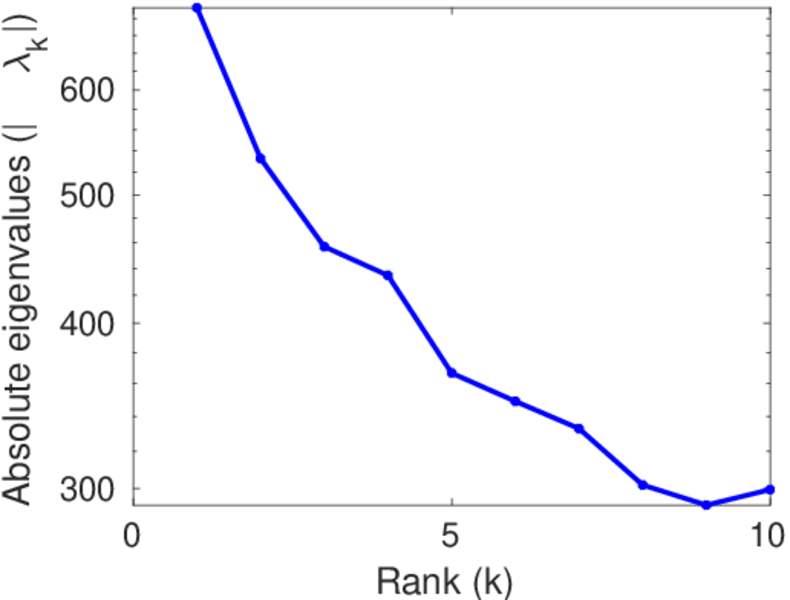
Matrix decompositions plots


Downloads
References
|
[1]
|
Jérôme Kunegis.
KONECT – The Koblenz Network Collection.
In Proc. Int. Conf. on World Wide Web Companion, pages
1343–1350, 2013.
[ http ]
|
 KONECT ‣ Networks ‣
Buy Me a Coffee
KONECT ‣ Networks ‣
Buy Me a Coffee