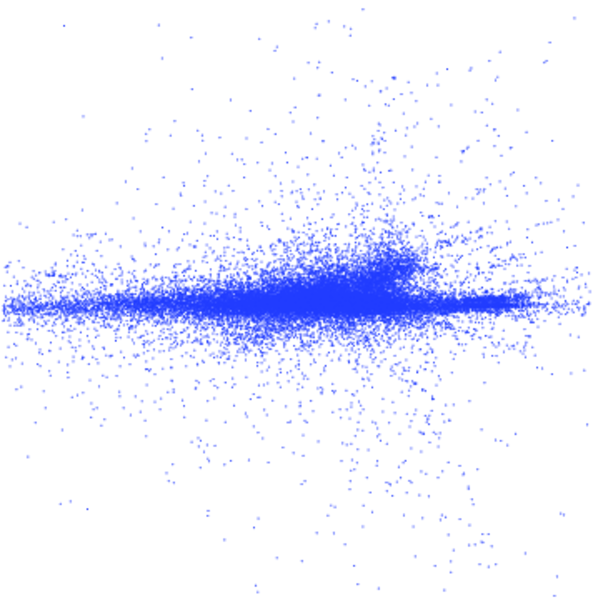
Wikipedia links (fr)
This network consists of the wikilinks of the Wikipedia in the French language
(fr). Nodes are Wikipedia articles, and directed edges are wikilinks, i.e.,
hyperlinks within one wiki. In the wiki source, these are indicated with
[[double brackets]]. Only pages in the article namespace are included.
Metadata
Statistics
| Size | n = | 3,333,397
|
| Volume | m = | 123,709,902
|
| Loop count | l = | 19,806
|
| Wedge count | s = | 632,633,116,550
|
| Claw count | z = | 30,670,924,502,014,800
|
| Cross count | x = | 2.027 9 × 10²¹
|
| Triangle count | t = | 3,068,090,203
|
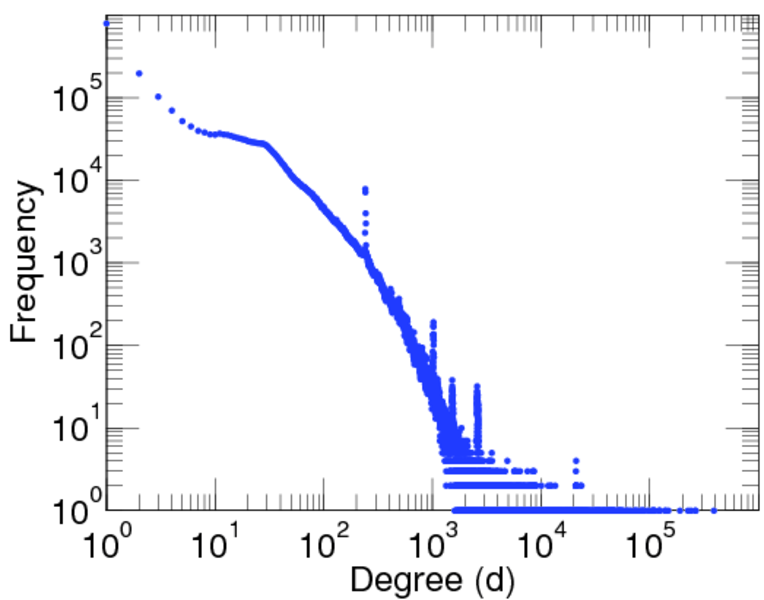
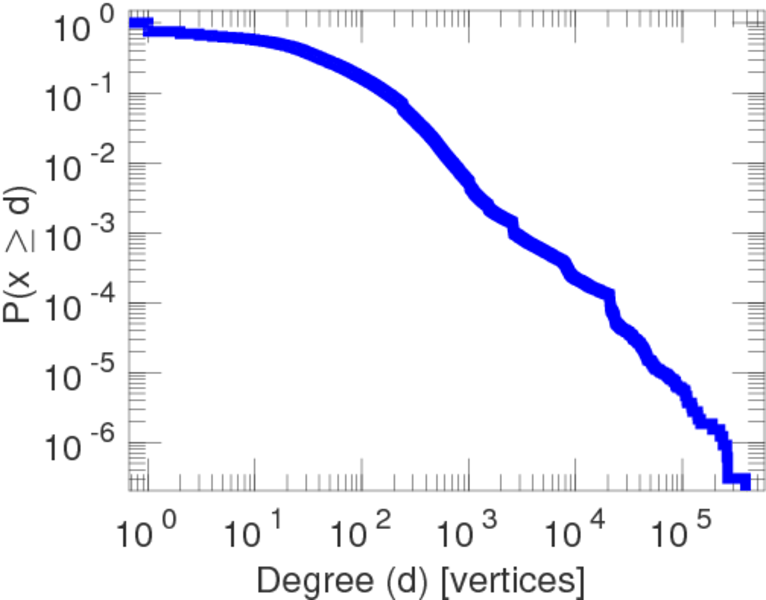
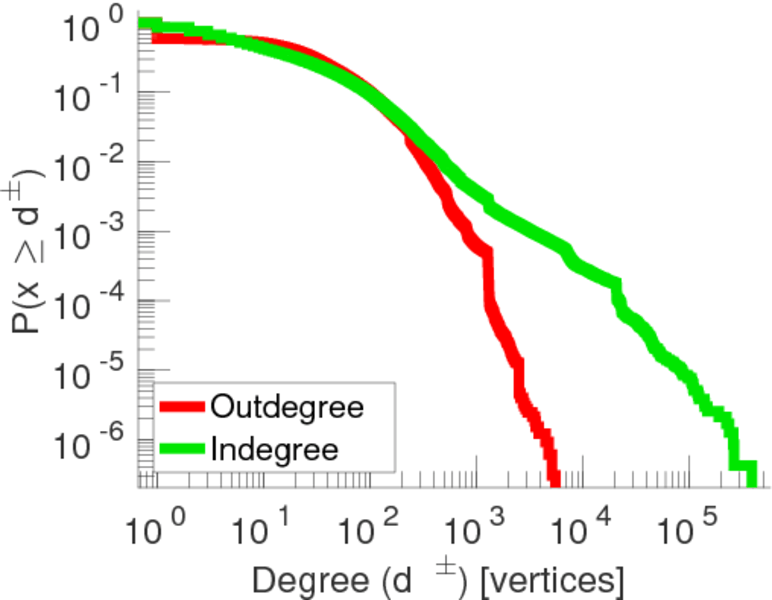
| Maximum degree | dmax = | 400,784
|
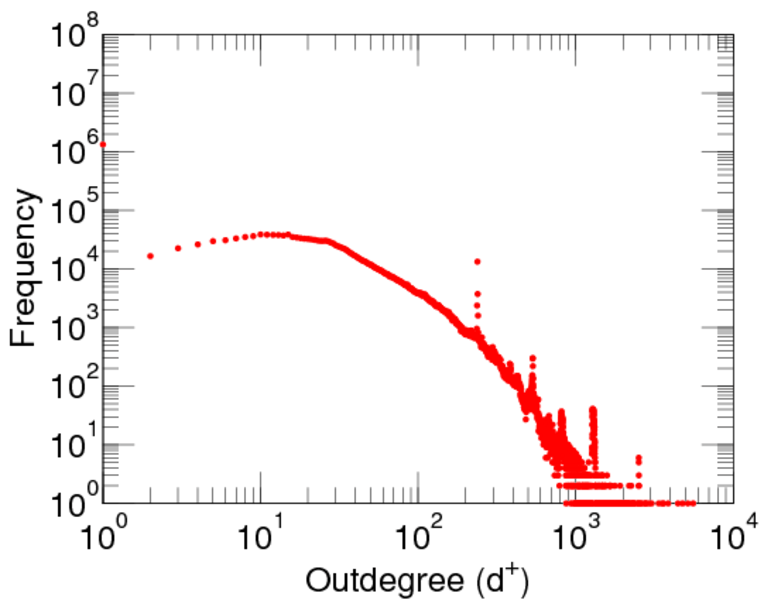
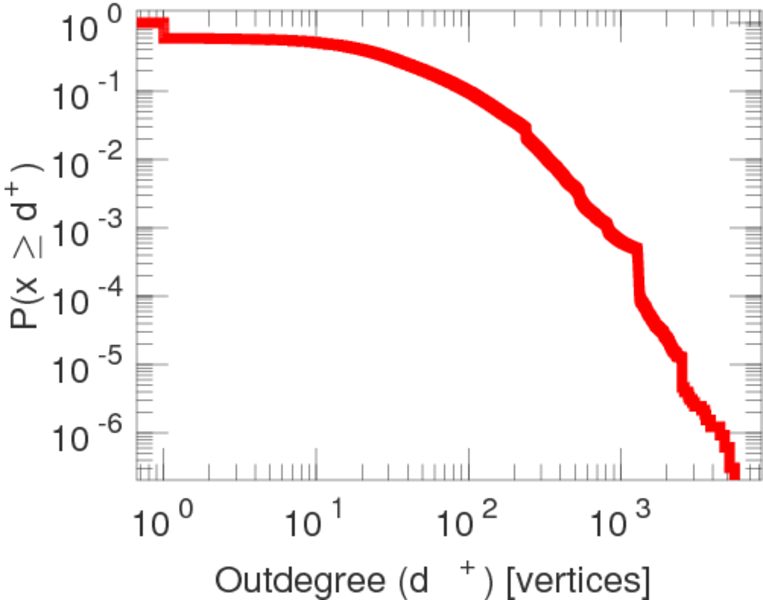
| Maximum outdegree | d+max = | 6,664
|
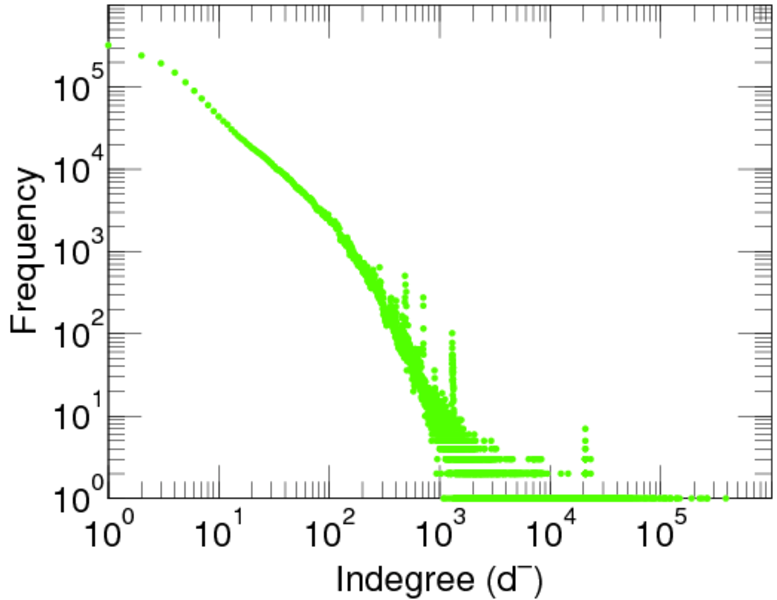
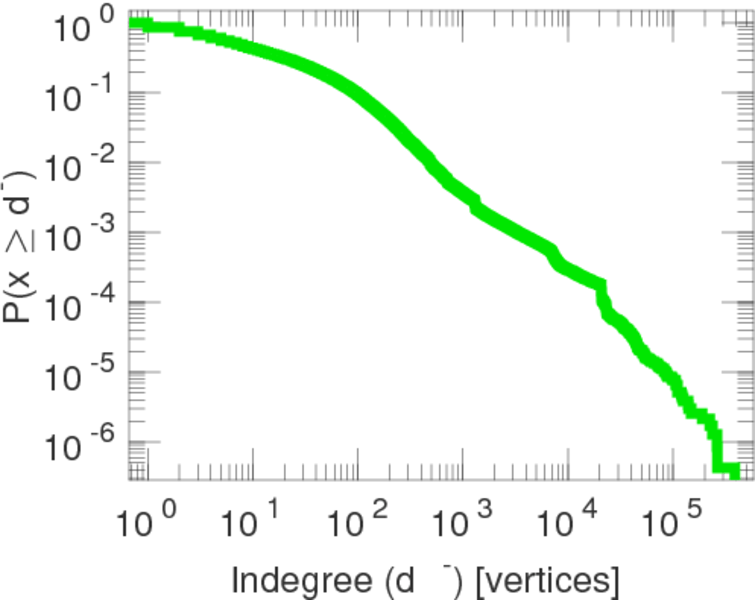
| Maximum indegree | d−max = | 398,659
|
| Average degree | d = | 74.224 5
|
| Fill | p = | 1.120 22 × 10−5
|
| Size of LCC | N = | 3,333,272
|
| Size of LSCC | Ns = | 2,047,206
|
| Relative size of LSCC | Nrs = | 0.677 173
|
| Diameter | δ = | 10
|
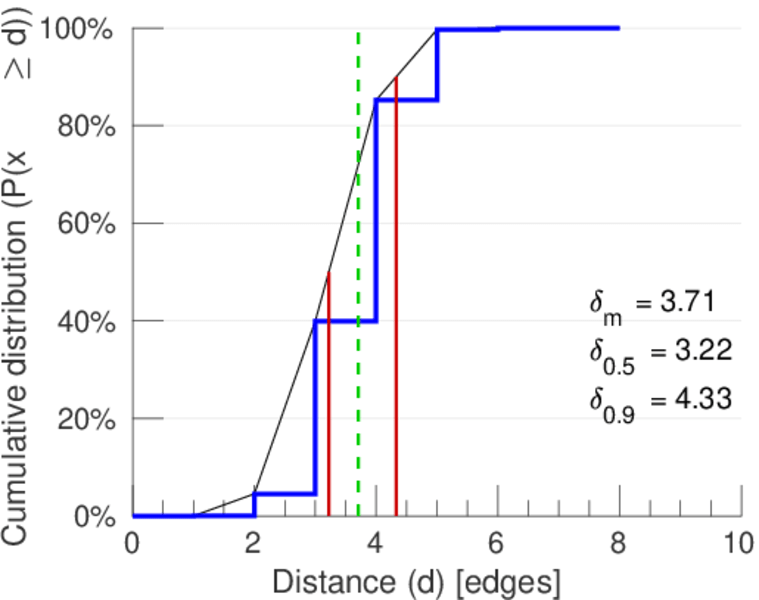
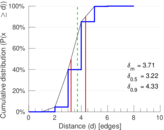
| 50-Percentile effective diameter | δ0.5 = | 3.222 72
|
| 90-Percentile effective diameter | δ0.9 = | 4.331 02
|
| Median distance | δM = | 4
|
| Mean distance | δm = | 3.706 82
|
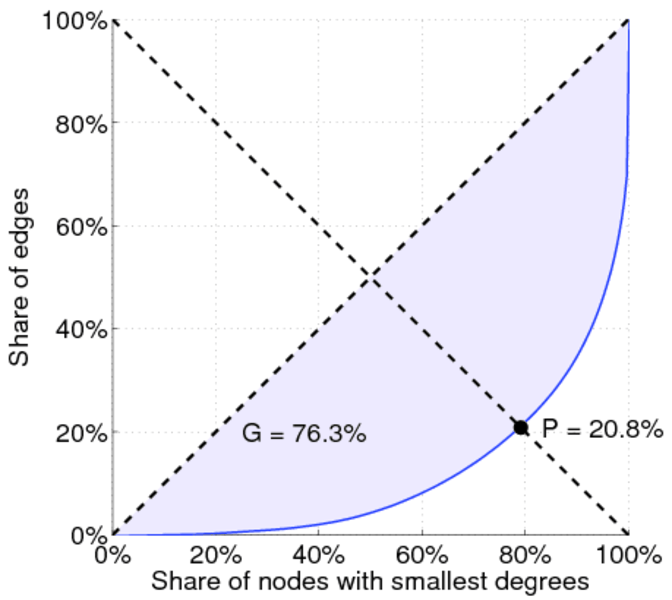
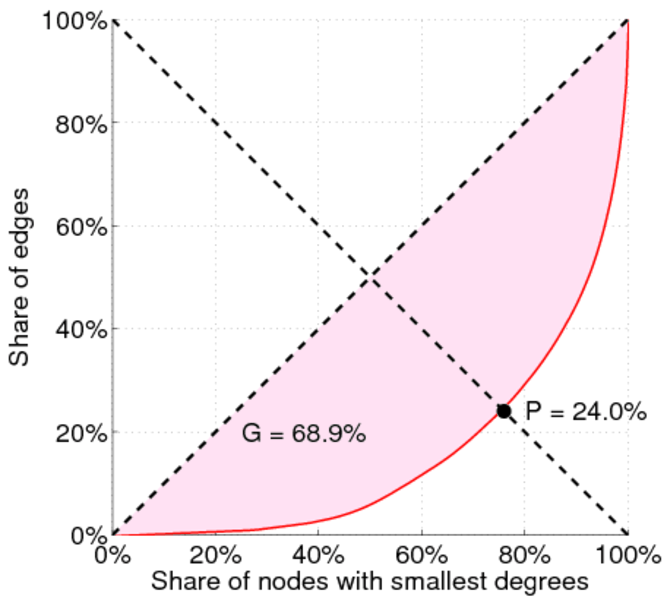
| Gini coefficient | G = | 0.763 234
|
| Balanced inequality ratio | P = | 0.189 652
|
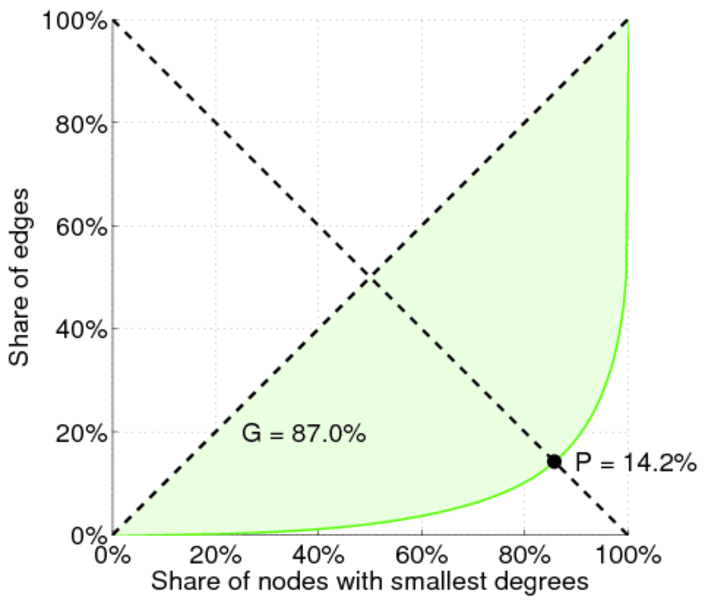
| Outdegree balanced inequality ratio | P+ = | 0.216 811
|
| Indegree balanced inequality ratio | P− = | 0.168 168
|
| Relative edge distribution entropy | Her = | 0.891 060
|
| Power law exponent | γ = | 1.420 63
|
| Degree assortativity | ρ = | −0.044 775 0
|
| Degree assortativity p-value | pρ = | 0.000 00
|
| Clustering coefficient | c = | 0.014 549 1
|
| Directed clustering coefficient | c± = | 0.309 469
|
| Spectral norm | α = | 2,159.78
|
| Operator 2-norm | ν = | 2,321.08
|
| Reciprocity | y = | 0.374 443
|
| Non-bipartivity | bA = | 0.186 485
|
| Normalized non-bipartivity | bN = | 0.036 999 4
|
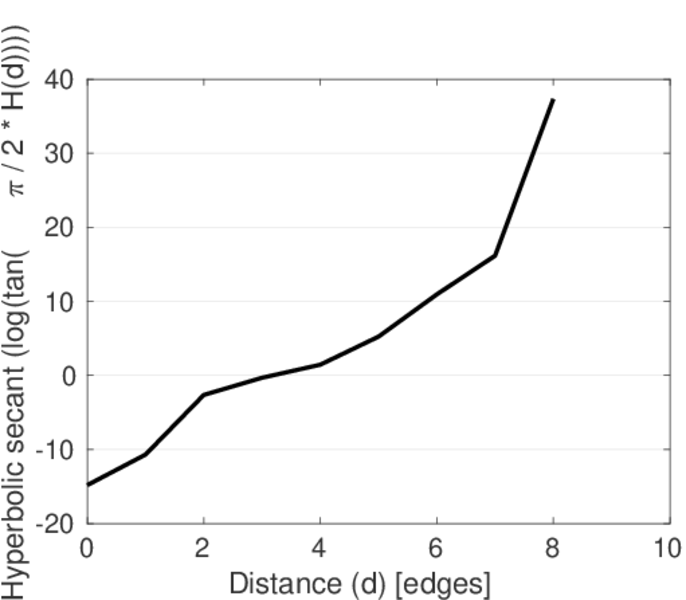
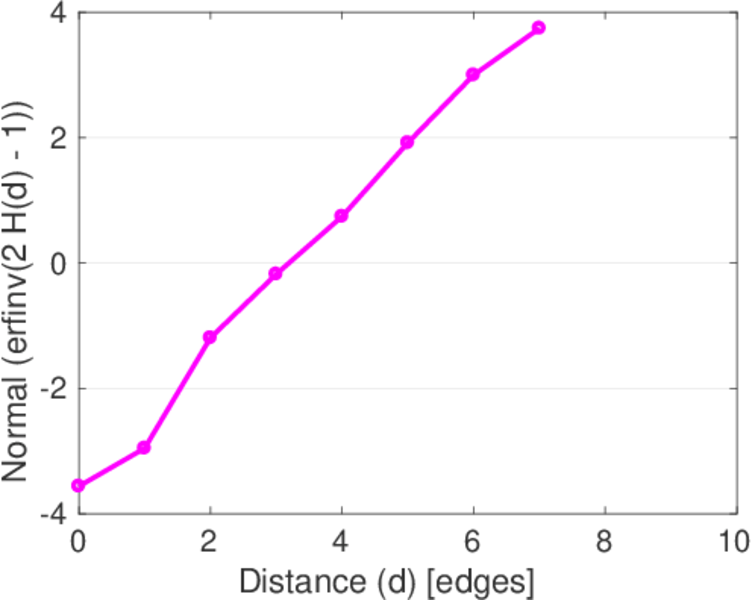
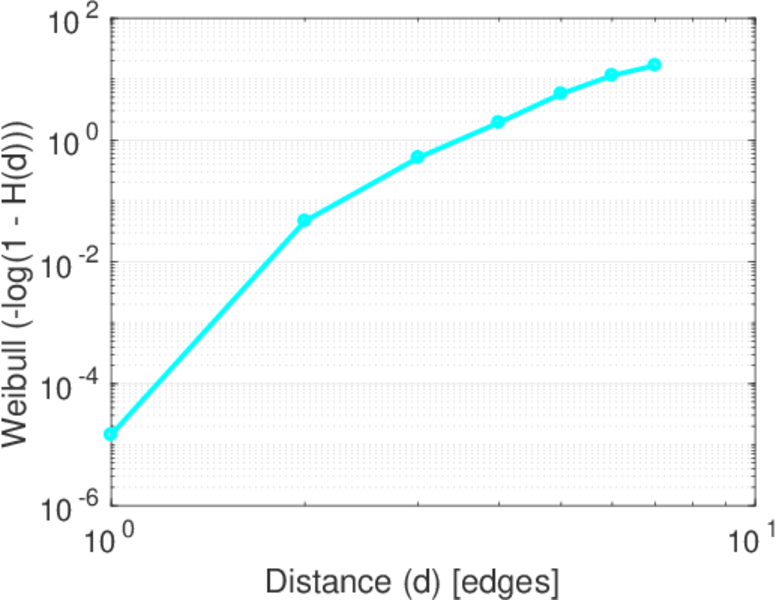
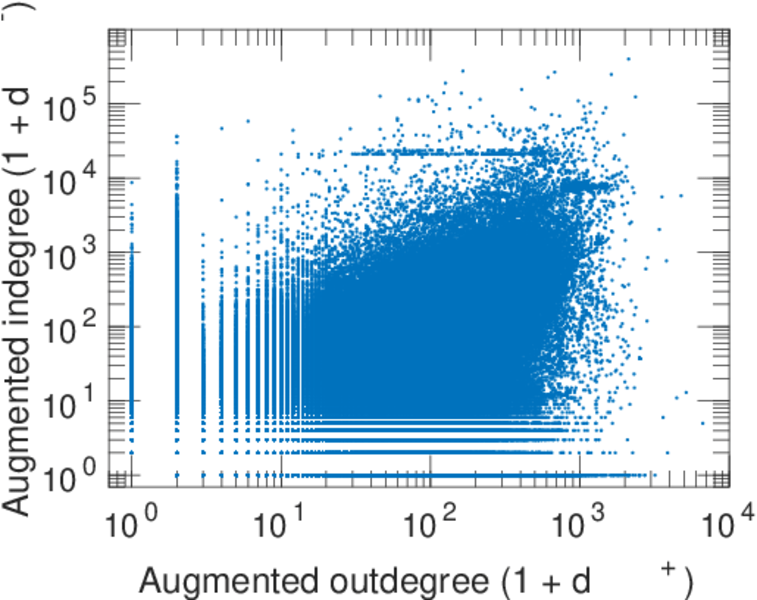
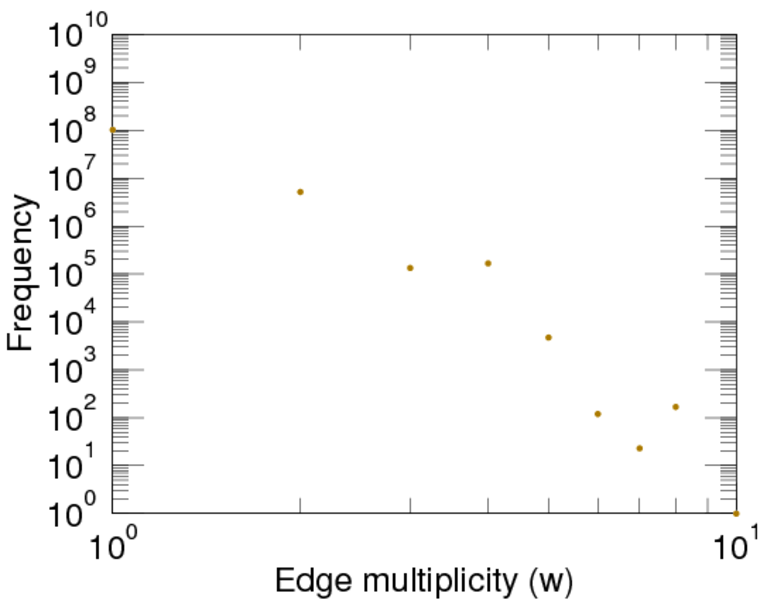
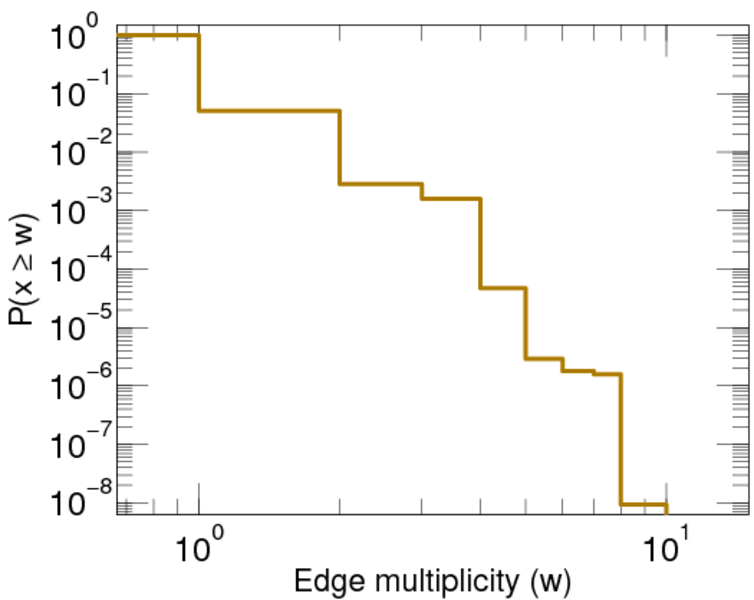
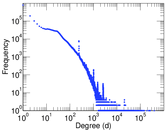
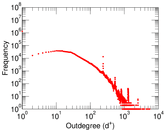
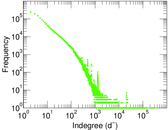
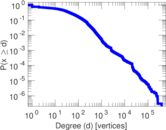
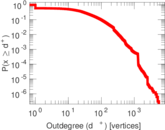
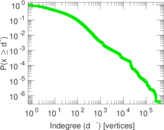
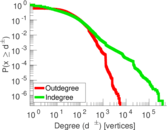
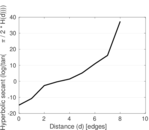
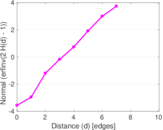
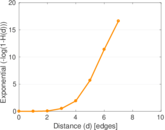
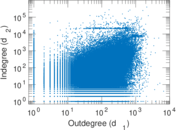
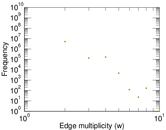
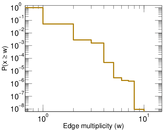
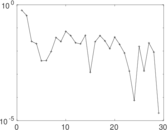
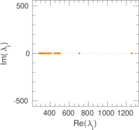
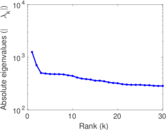
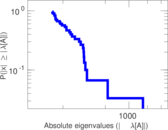
Plots


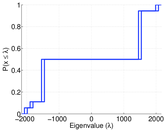
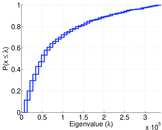


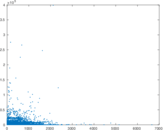

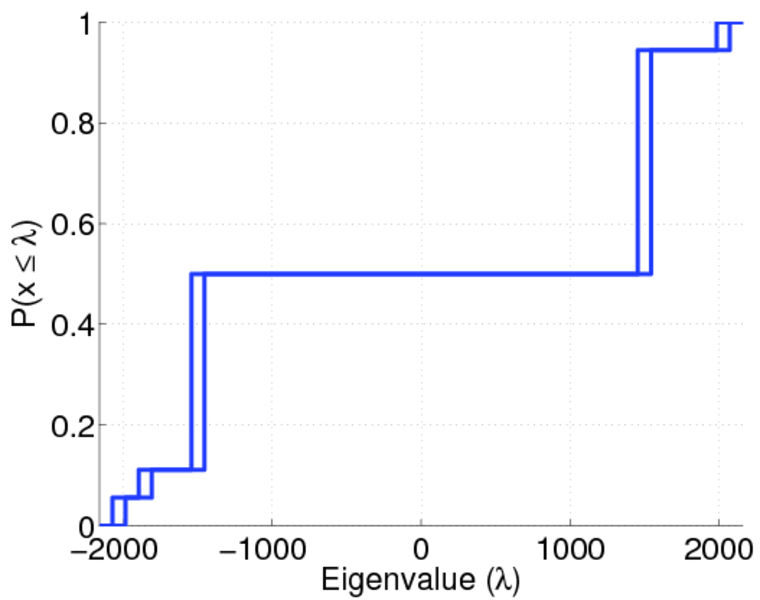
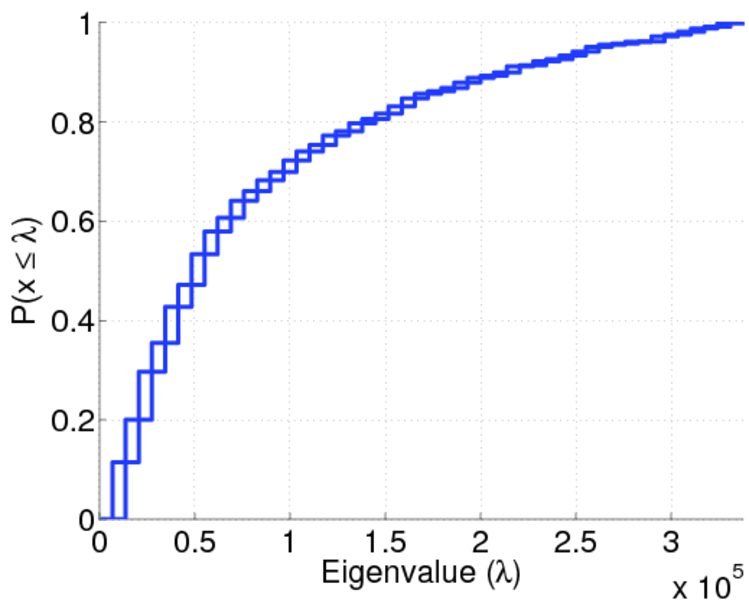
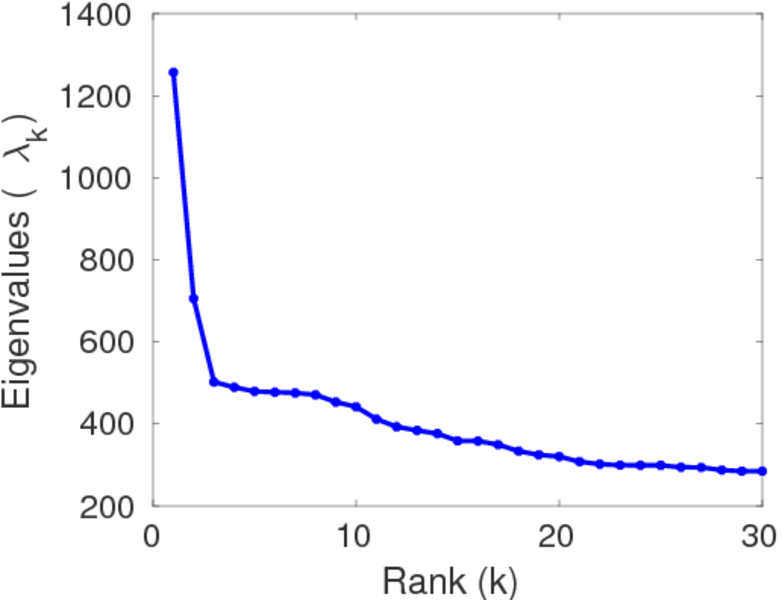
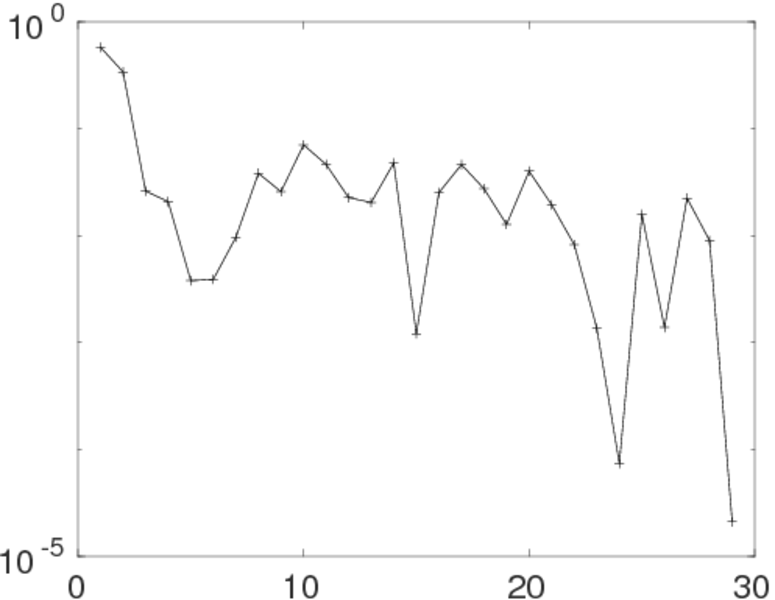
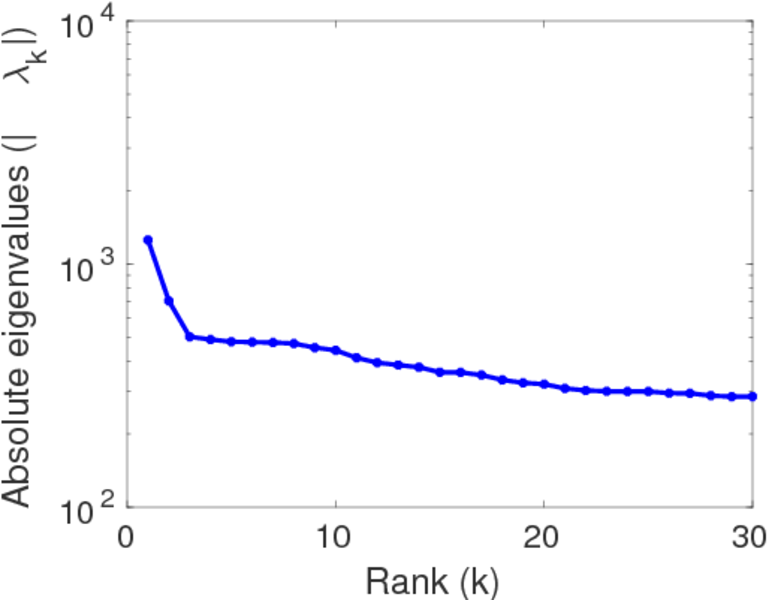
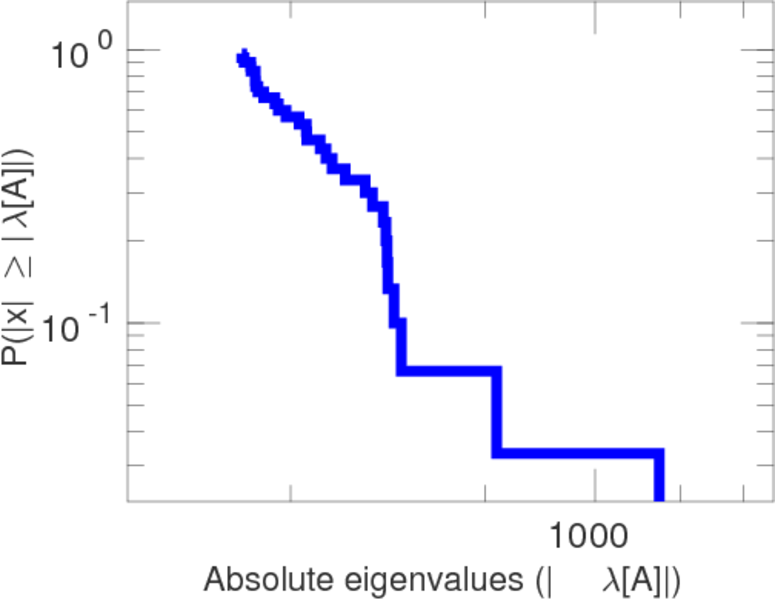
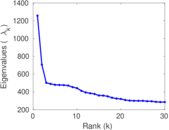
Matrix decompositions plots
Downloads
References
|
[1]
|
Jérôme Kunegis.
KONECT – The Koblenz Network Collection.
In Proc. Int. Conf. on World Wide Web Companion, pages
1343–1350, 2013.
[ http ]
|
 KONECT ‣ Networks ‣
Buy Me a Coffee
KONECT ‣ Networks ‣
Buy Me a Coffee