Wikipedia links (it)
This network consists of the wikilinks of the Wikipedia in the Italian language
(it). Nodes are Wikipedia articles, and directed edges are wikilinks, i.e.,
hyperlinks within one wiki. In the wiki source, these are indicated with
[[double brackets]]. Only pages in the article namespace are included.
Metadata
Statistics
| Size | n = | 2,148,791
|
| Volume | m = | 104,719,994
|
| Loop count | l = | 30,076
|
| Wedge count | s = | 528,260,116,394
|
| Claw count | z = | 25,120,883,266,462,528
|
| Cross count | x = | 1.278 01 × 1021
|
| Triangle count | t = | 3,415,310,223
|
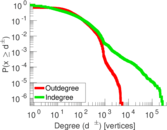
| Maximum degree | dmax = | 286,603
|
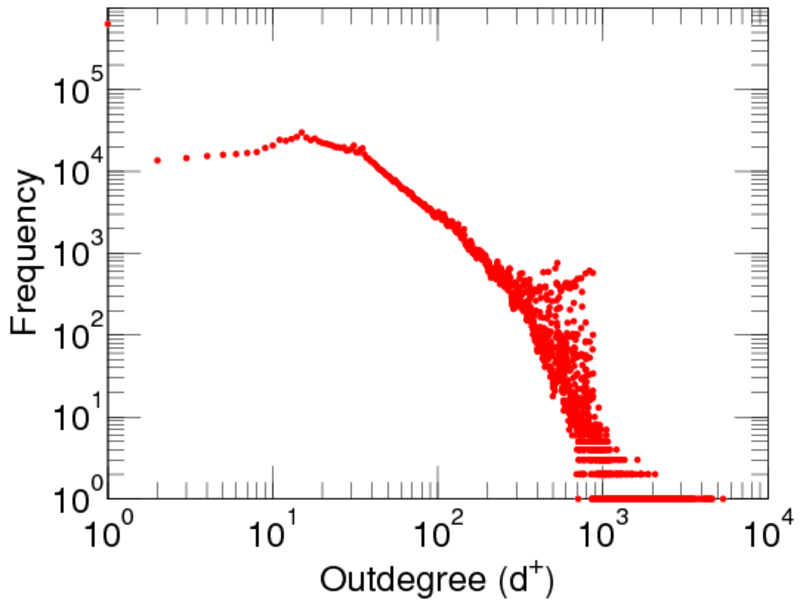
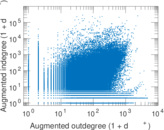
| Maximum outdegree | d+max = | 5,368
|
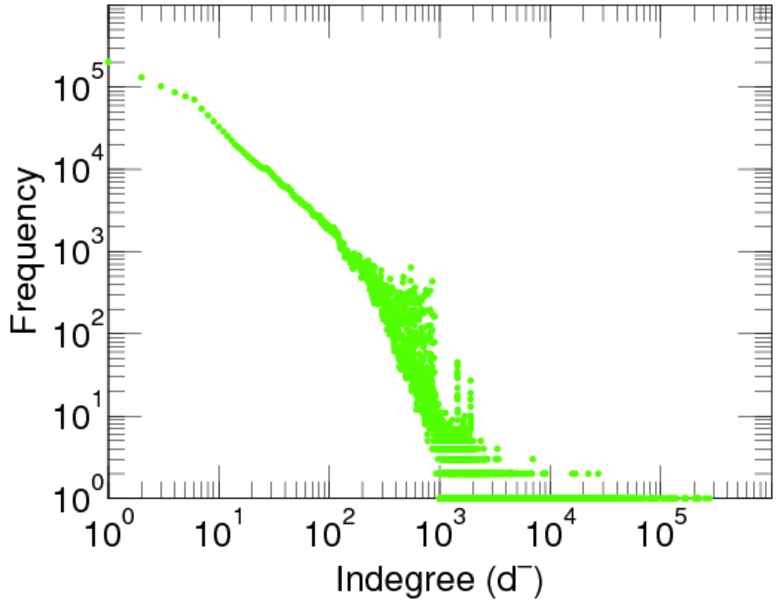
| Maximum indegree | d−max = | 286,557
|
| Average degree | d = | 97.468 8
|
| Fill | p = | 2.629 51 × 10−5
|
| Size of LCC | N = | 2,148,717
|
| Size of LSCC | Ns = | 1,448,715
|
| Relative size of LSCC | Nrs = | 0.776 389
|
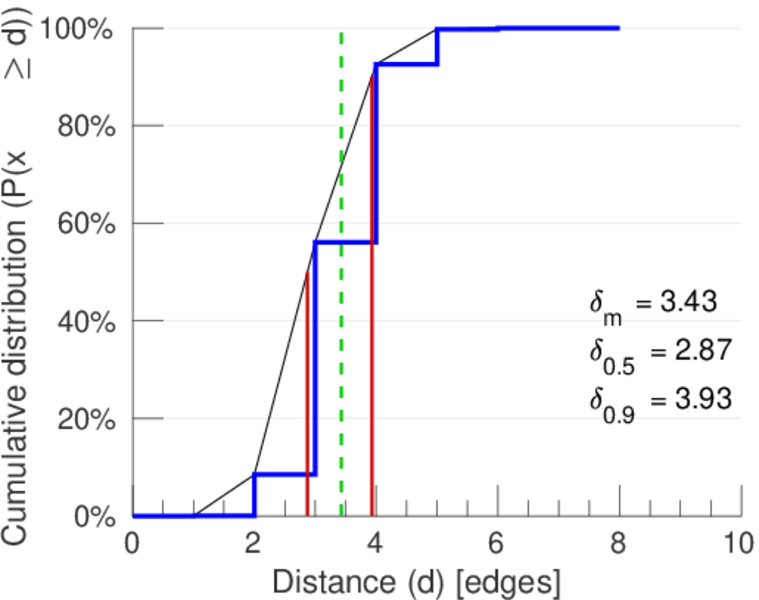
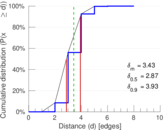
| Diameter | δ = | 9
|
| 50-Percentile effective diameter | δ0.5 = | 2.871 98
|
| 90-Percentile effective diameter | δ0.9 = | 3.929 02
|
| Median distance | δM = | 3
|
| Mean distance | δm = | 3.430 78
|
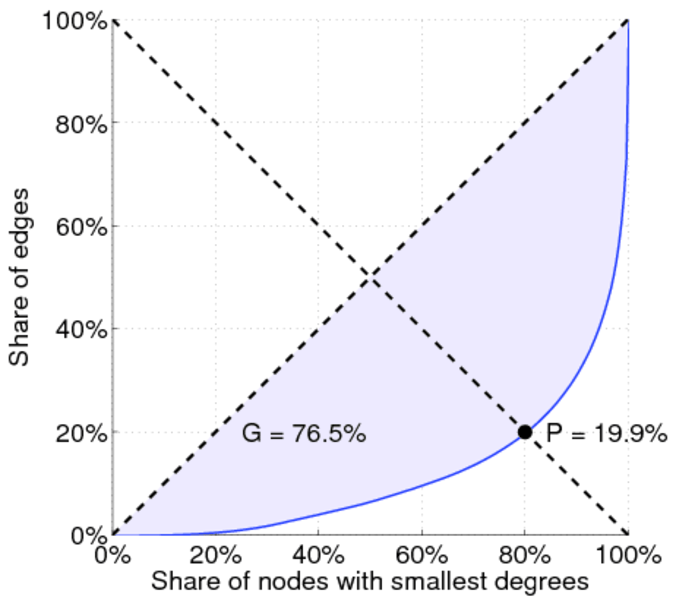
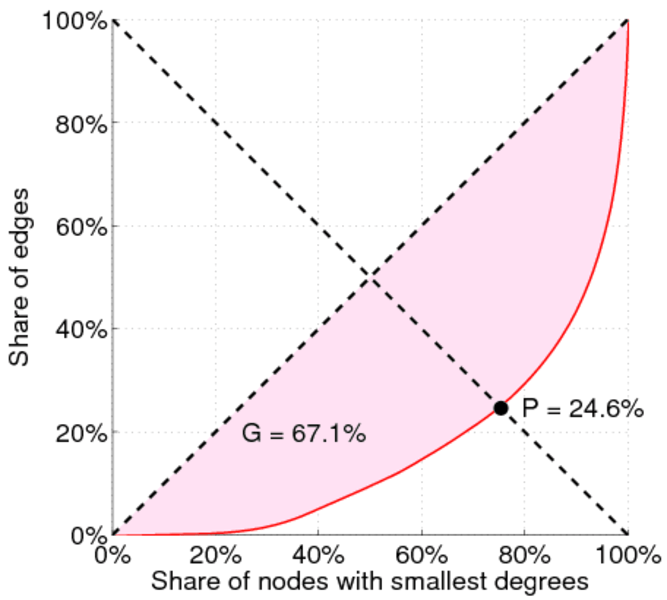
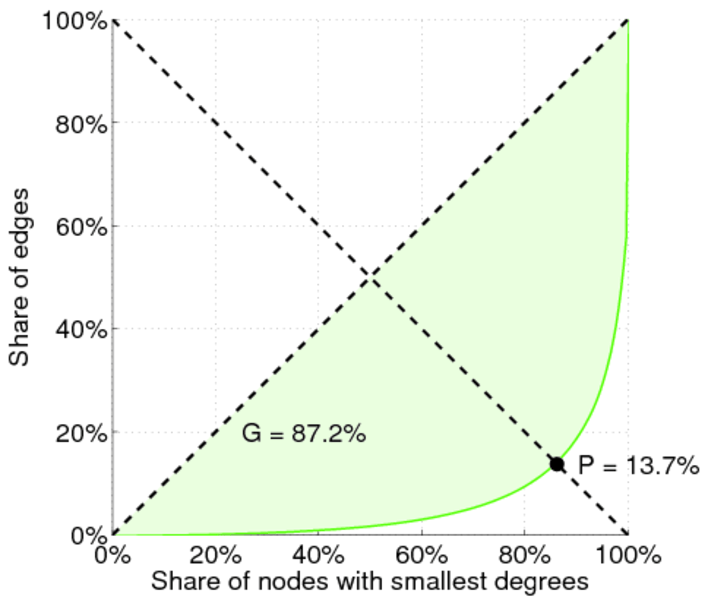
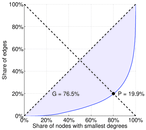
| Gini coefficient | G = | 0.764 861
|
| Balanced inequality ratio | P = | 0.195 663
|
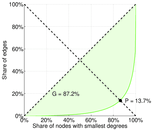
| Outdegree balanced inequality ratio | P+ = | 0.224 409
|
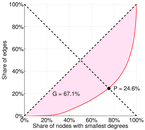
| Indegree balanced inequality ratio | P− = | 0.173 334
|
| Relative edge distribution entropy | Her = | 0.900 443
|
| Power law exponent | γ = | 1.351 11
|
| Degree assortativity | ρ = | −0.049 556 5
|
| Degree assortativity p-value | pρ = | 0.000 00
|
| Clustering coefficient | c = | 0.019 395 6
|
| Directed clustering coefficient | c± = | 0.568 114
|
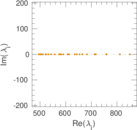
| Spectral norm | α = | 1,817.81
|
| Operator 2-norm | ν = | 1,418.39
|
| Reciprocity | y = | 0.509 008
|
| Non-bipartivity | bA = | 0.291 943
|
| Normalized non-bipartivity | bN = | 0.086 823 0
|
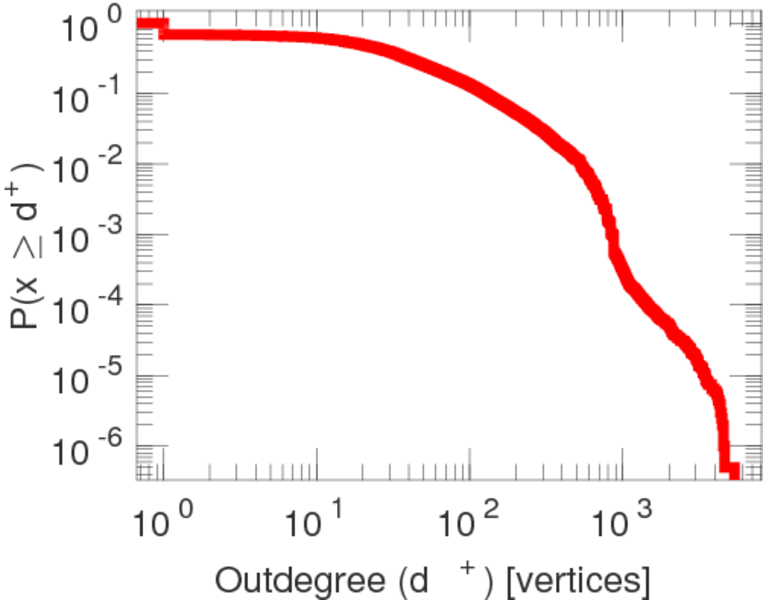
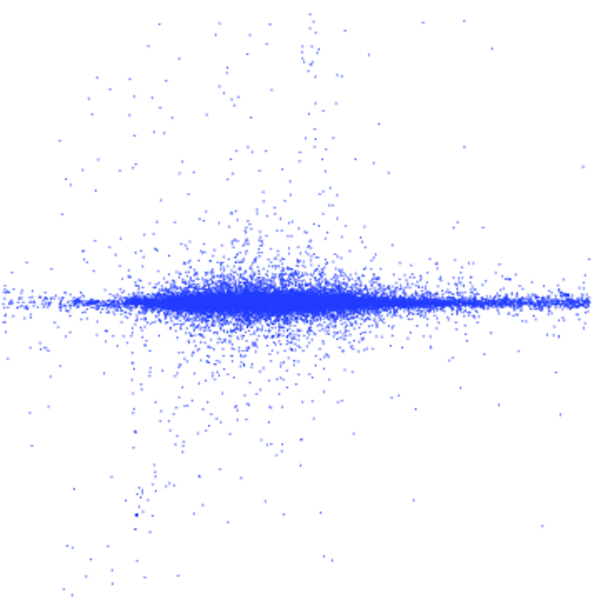
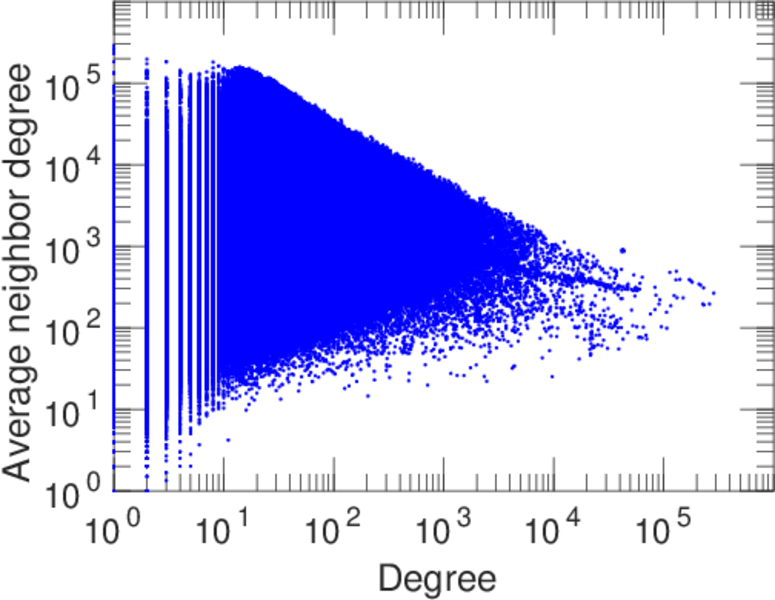
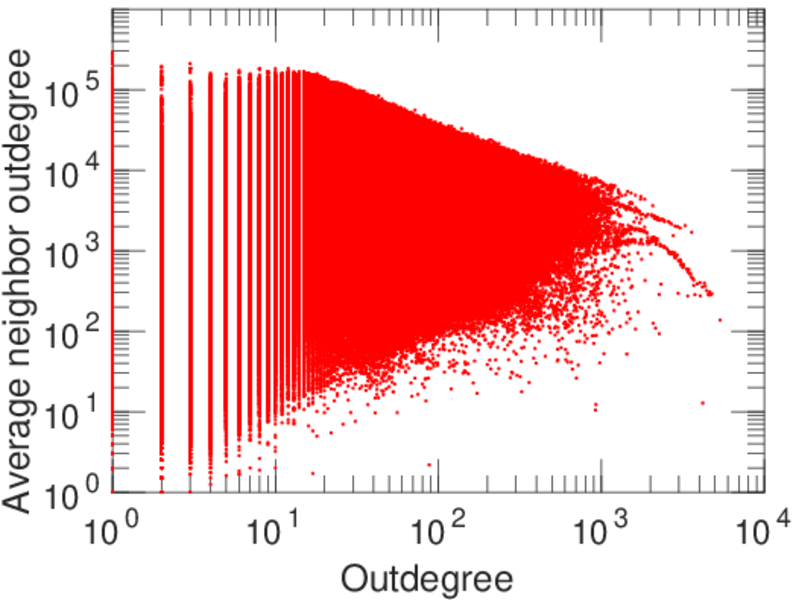
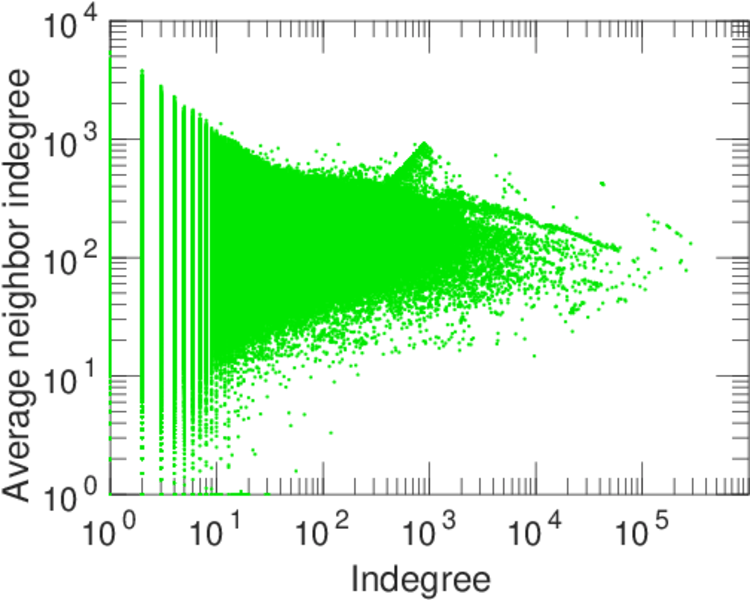
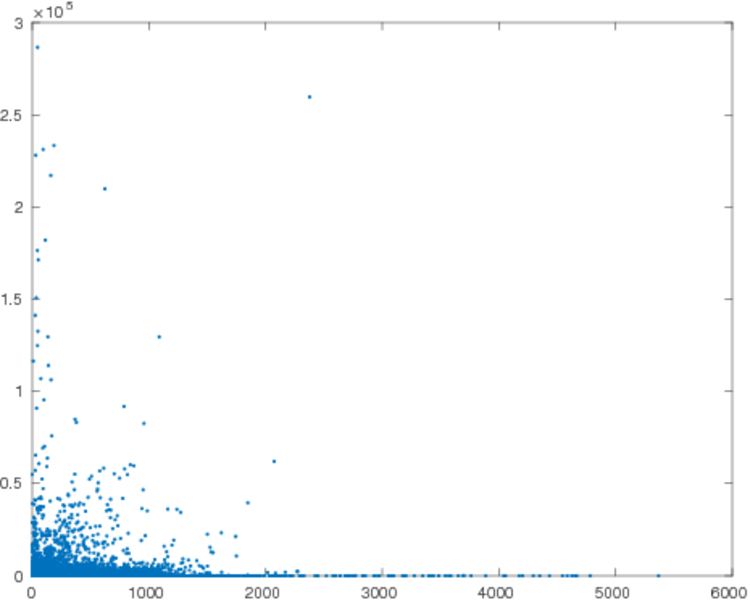
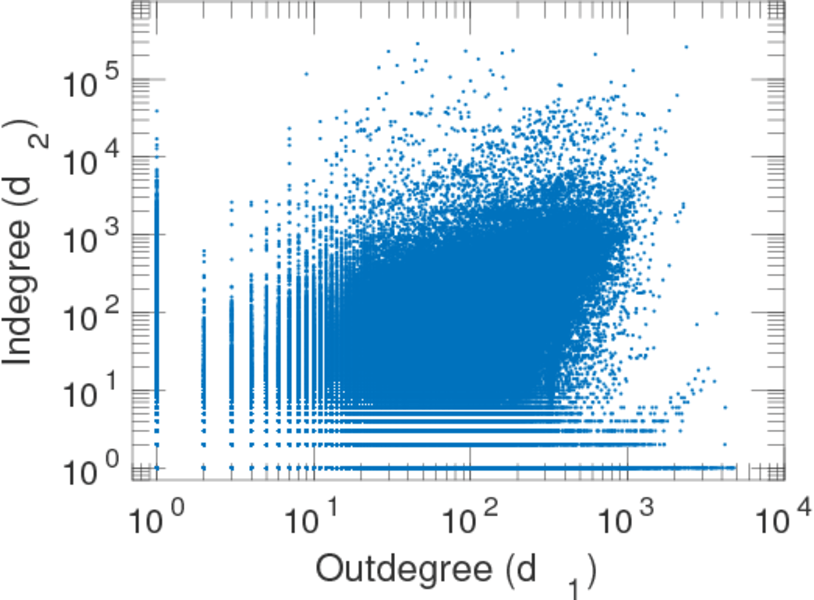
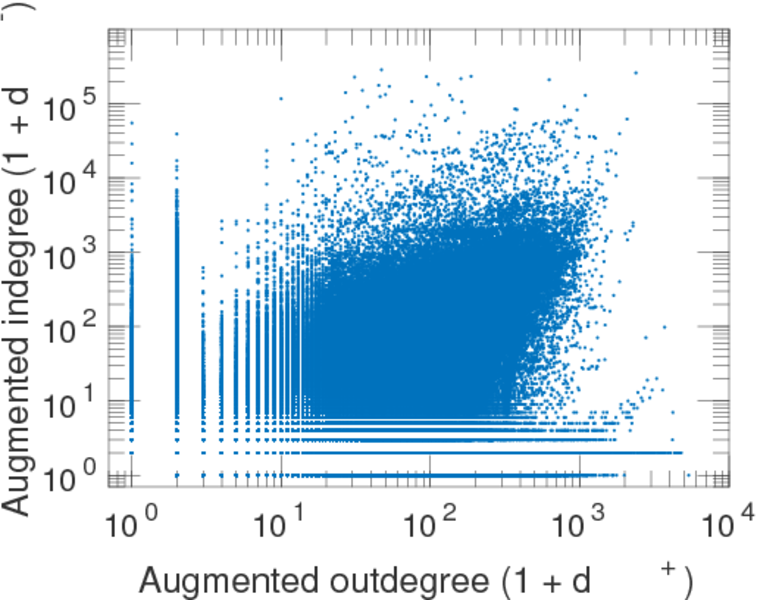
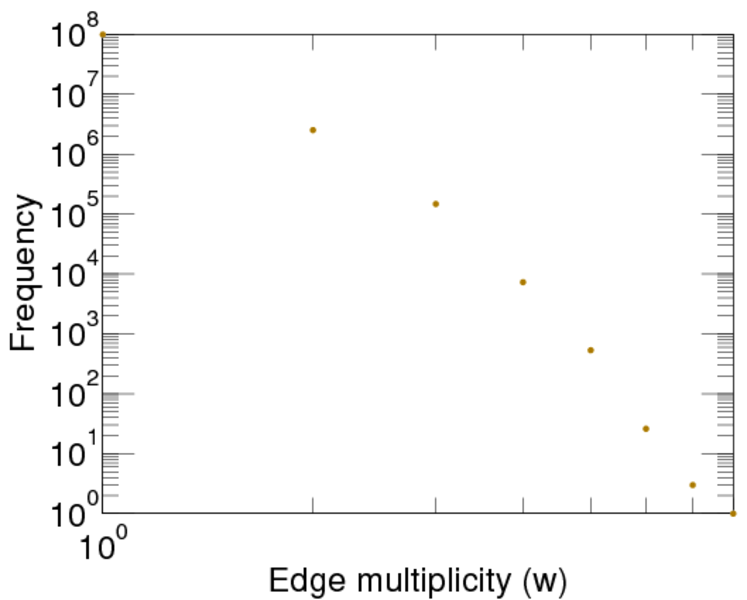
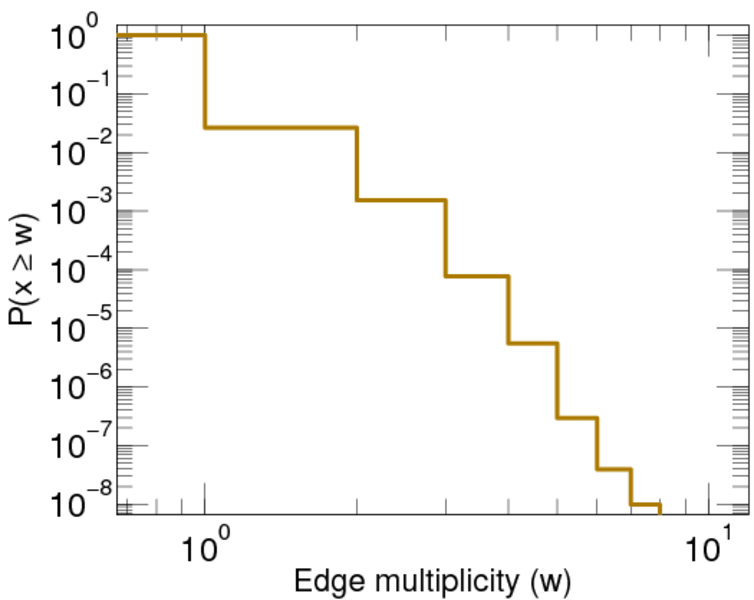
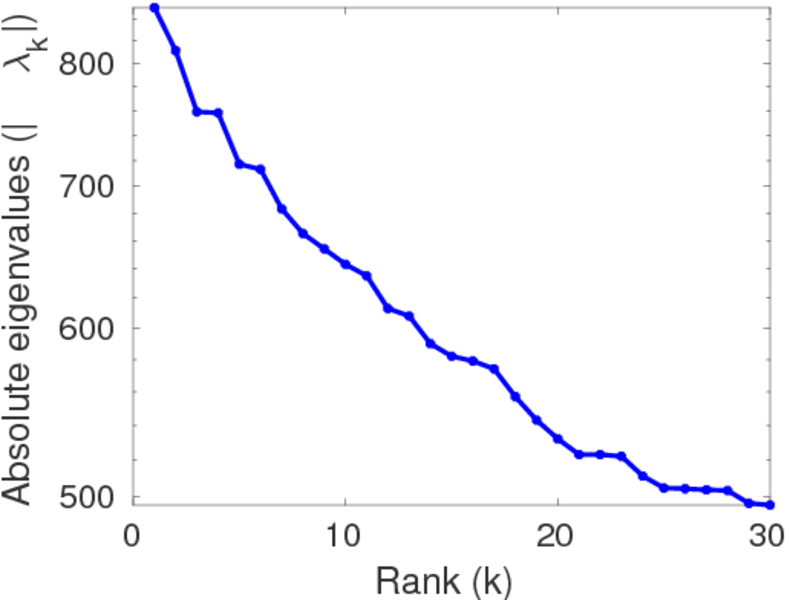
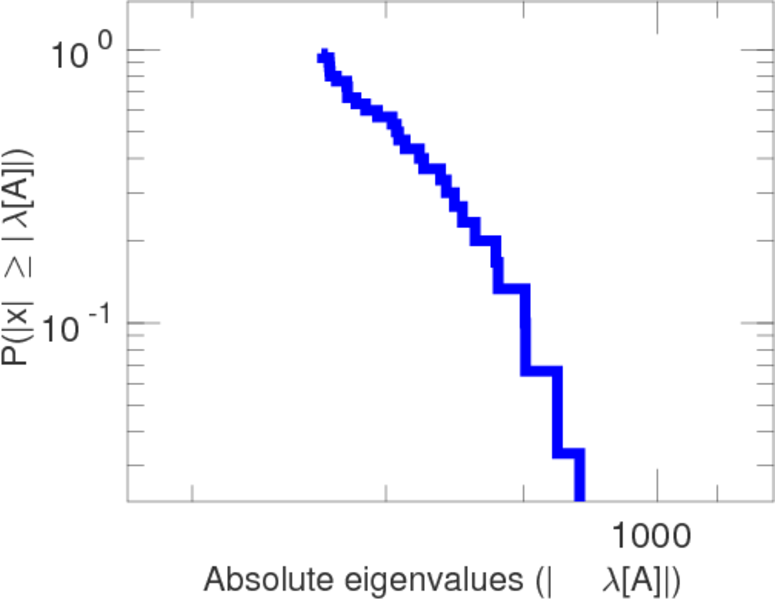
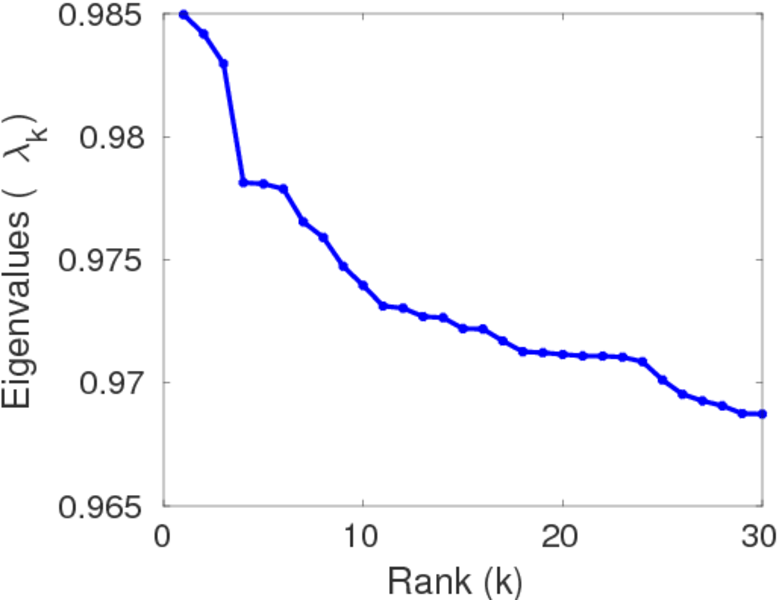
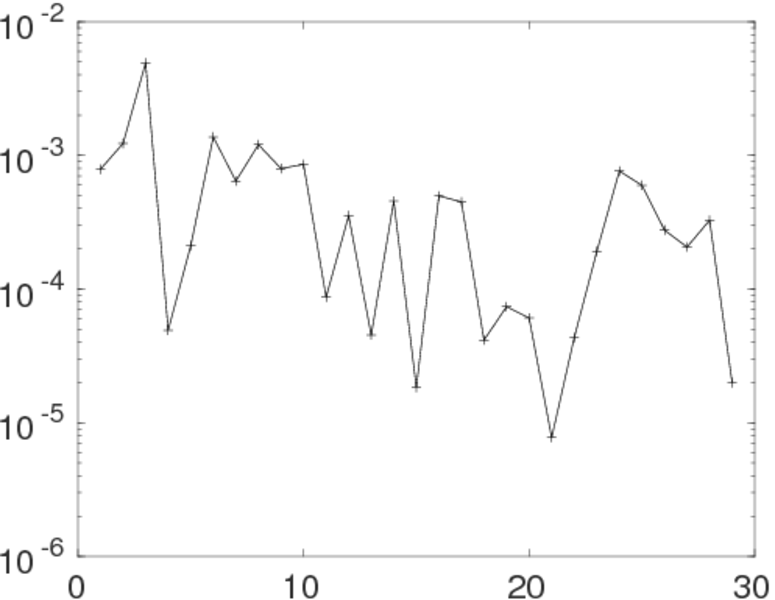
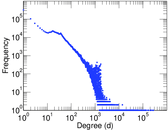
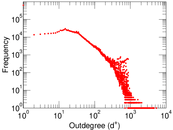
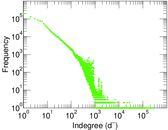
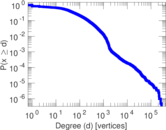
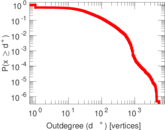
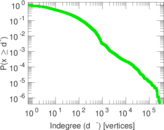
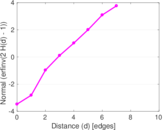
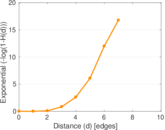
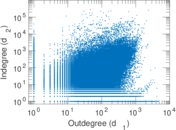
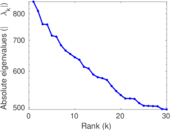
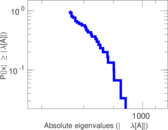
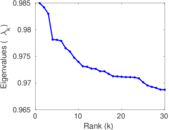
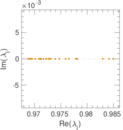
Plots
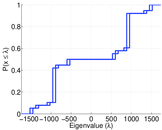
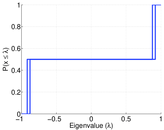

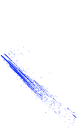
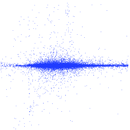


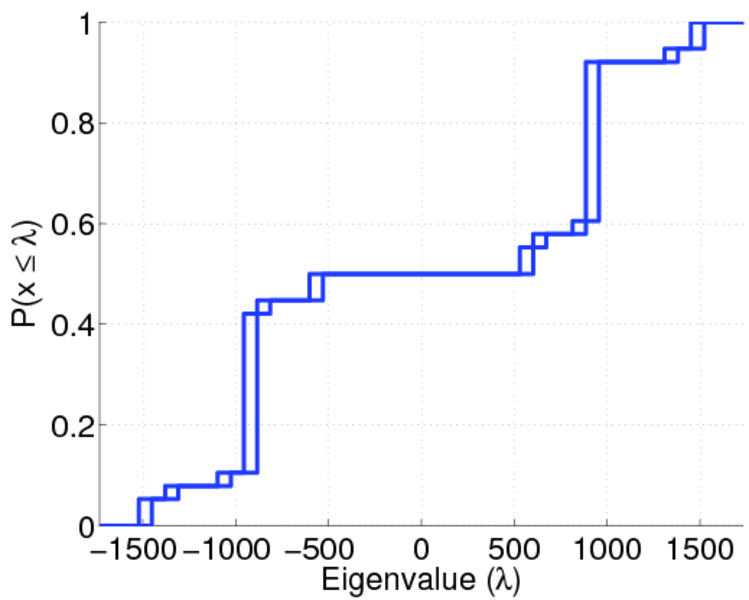
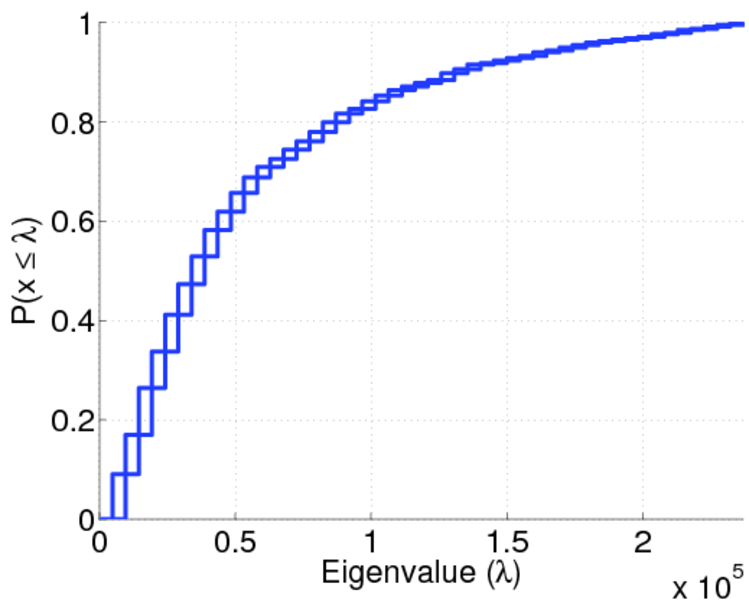
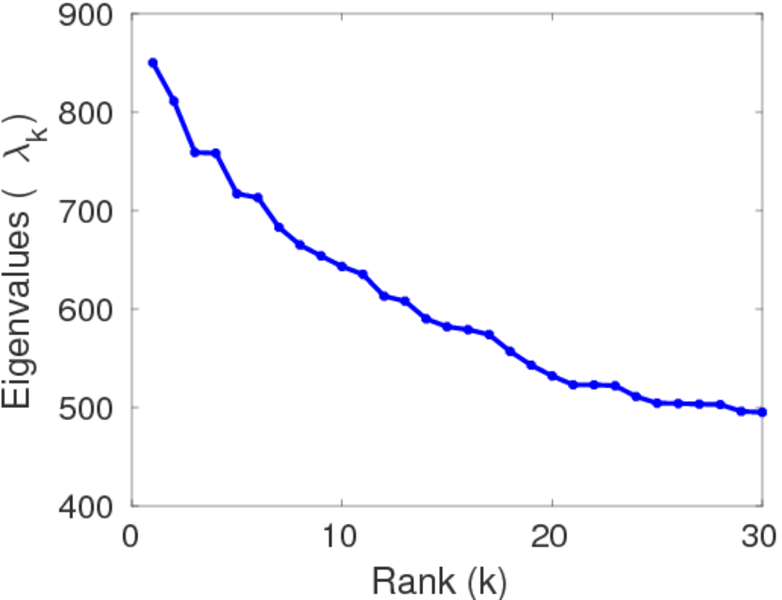
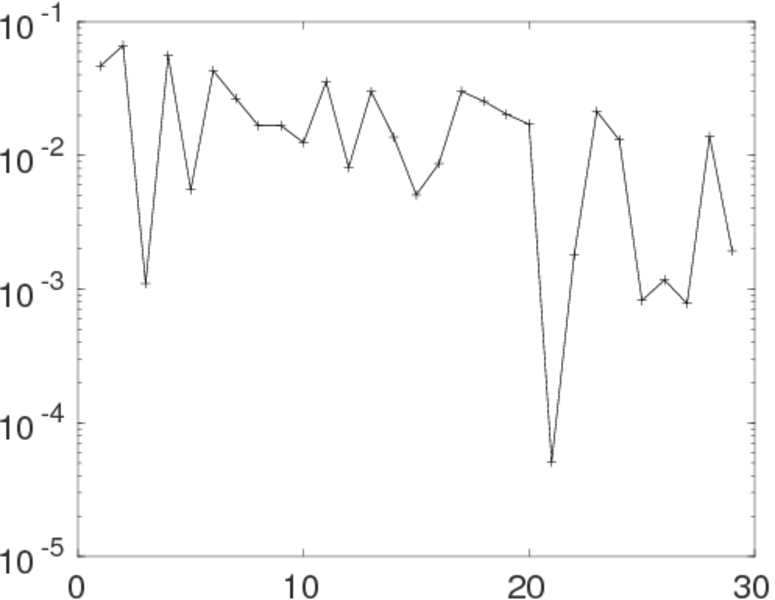
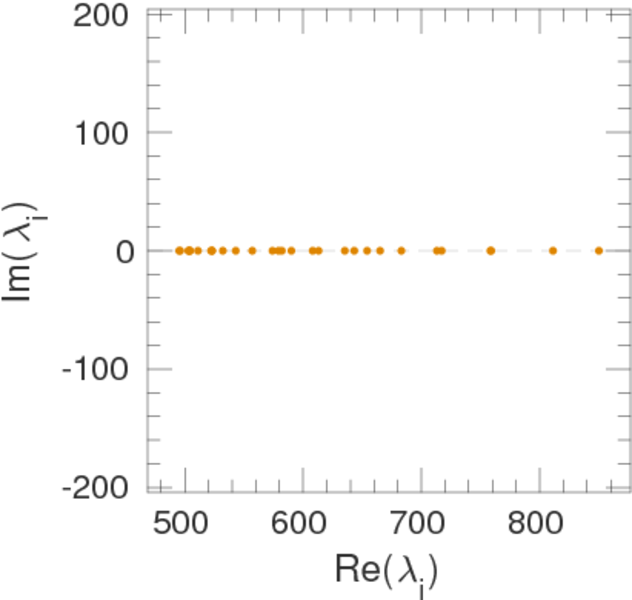
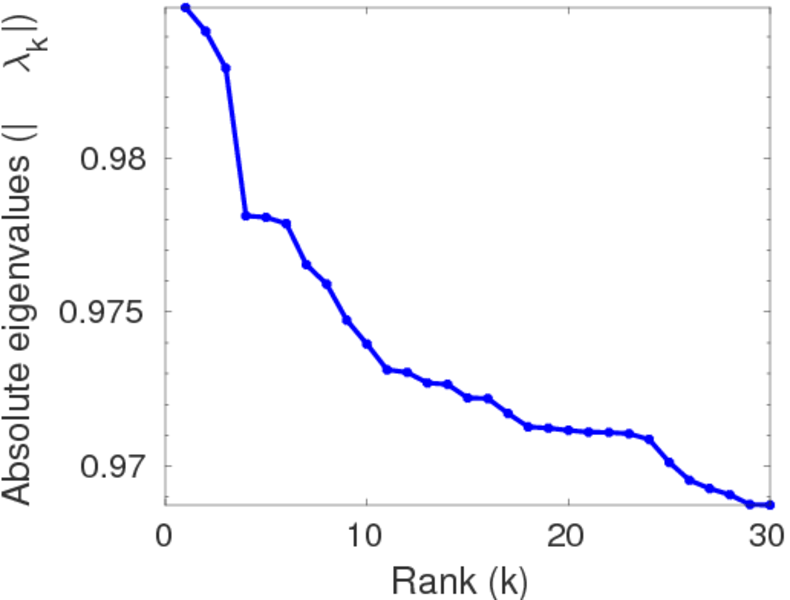
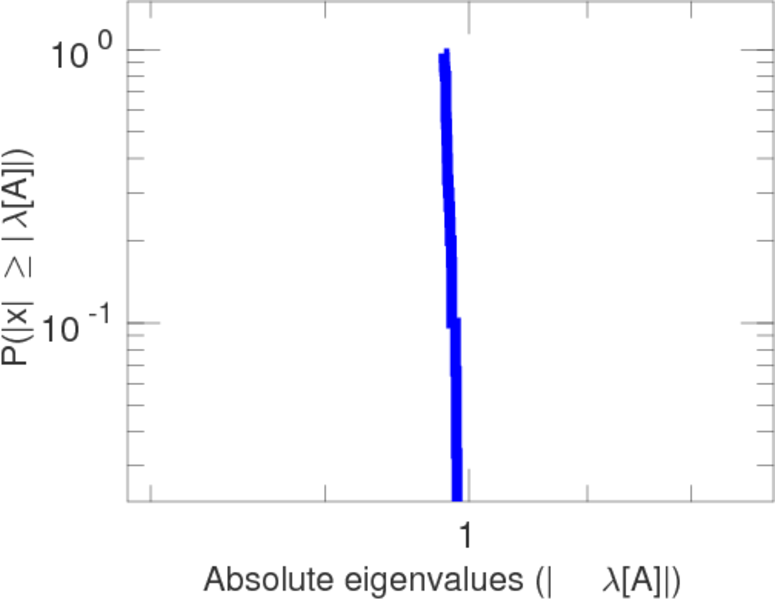
Matrix decompositions plots


Downloads
References
|
[1]
|
Jérôme Kunegis.
KONECT – The Koblenz Network Collection.
In Proc. Int. Conf. on World Wide Web Companion, pages
1343–1350, 2013.
[ http ]
|
 KONECT ‣ Networks ‣
Buy Me a Coffee
KONECT ‣ Networks ‣
Buy Me a Coffee