Wikipedia links (pl)
This network consists of the wikilinks of the Wikipedia in the Polish language
(pl). Nodes are Wikipedia articles, and directed edges are wikilinks, i.e.,
hyperlinks within one wiki. In the wiki source, these are indicated with
[[double brackets]]. Only pages in the article namespace are included.
Metadata
Statistics
| Size | n = | 1,688,608
|
| Volume | m = | 70,256,468
|
| Loop count | l = | 2,474
|
| Wedge count | s = | 313,262,513,564
|
| Claw count | z = | 20,220,280,855,116,756
|
| Cross count | x = | 1.539 97 × 1021
|
| Triangle count | t = | 3,488,602,202
|
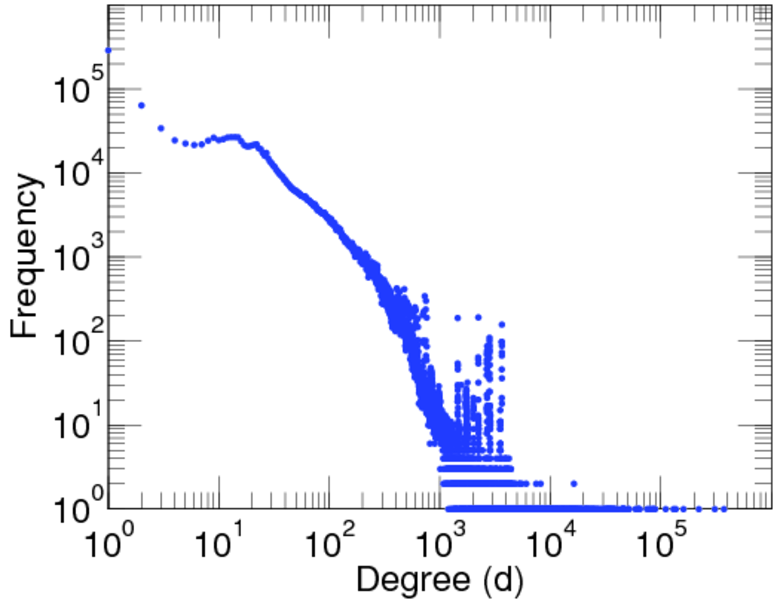
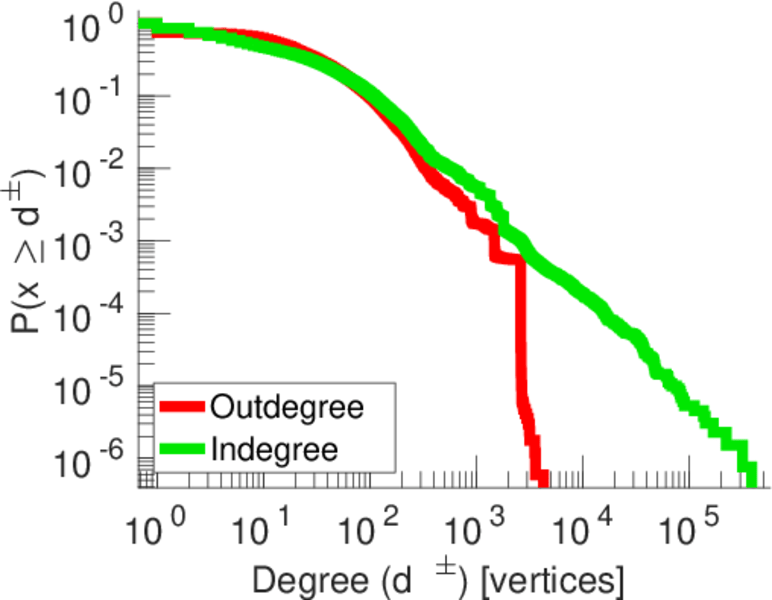
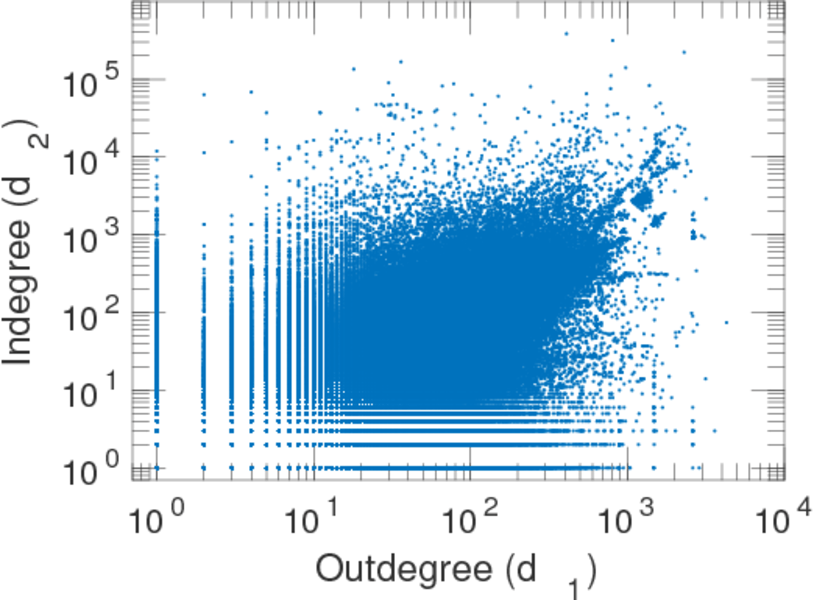
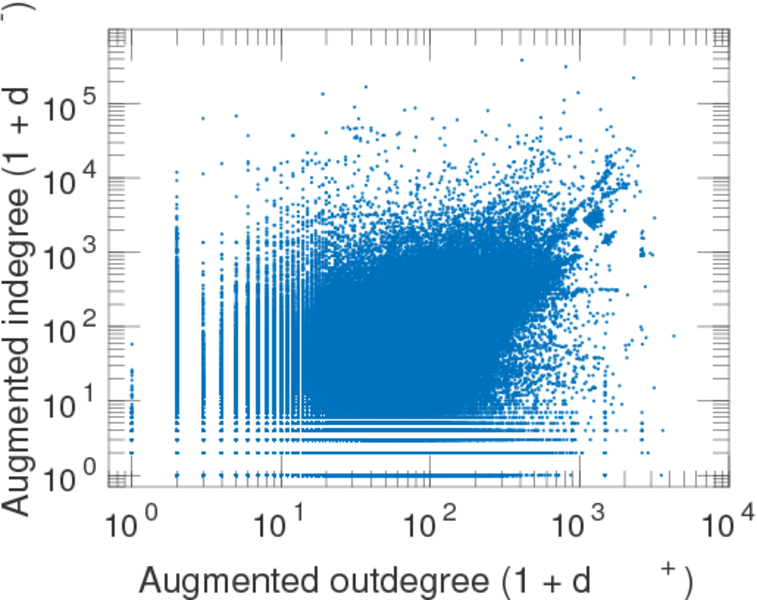
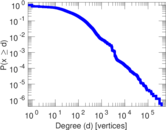
| Maximum degree | dmax = | 386,051
|
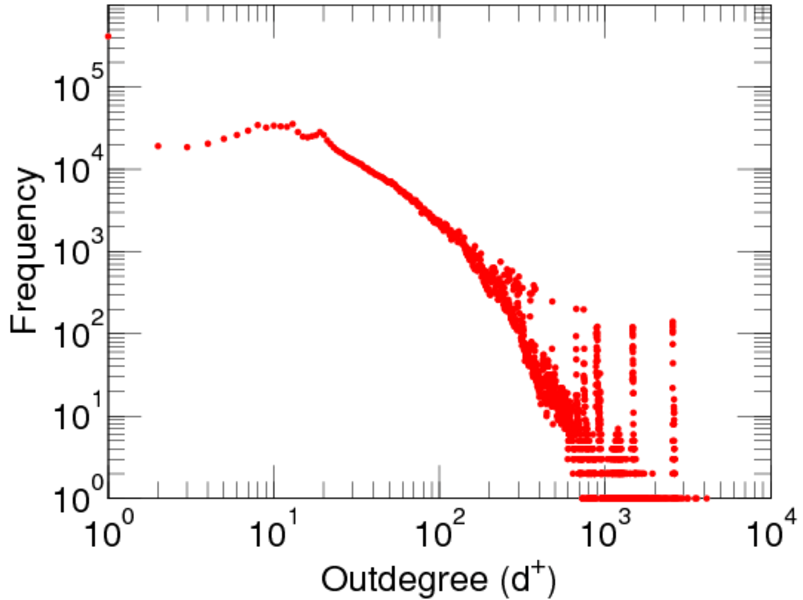
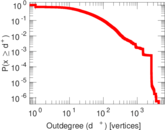
| Maximum outdegree | d+max = | 4,278
|
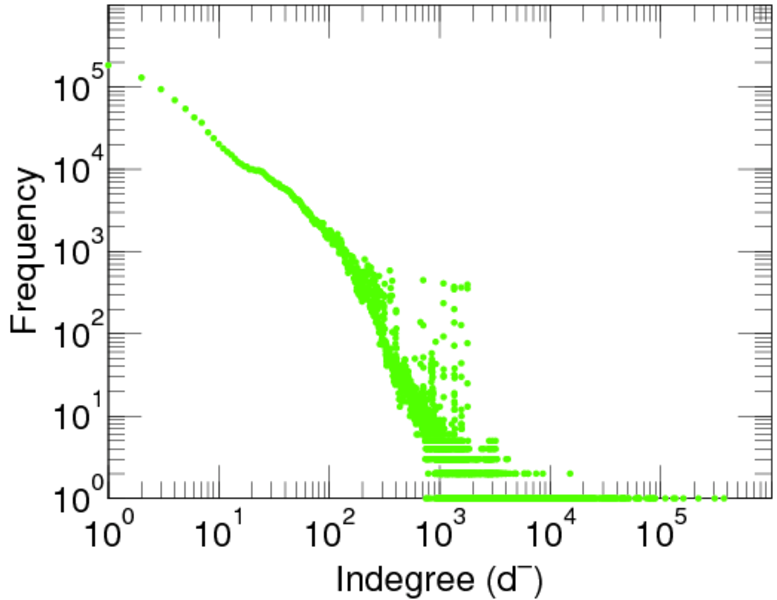
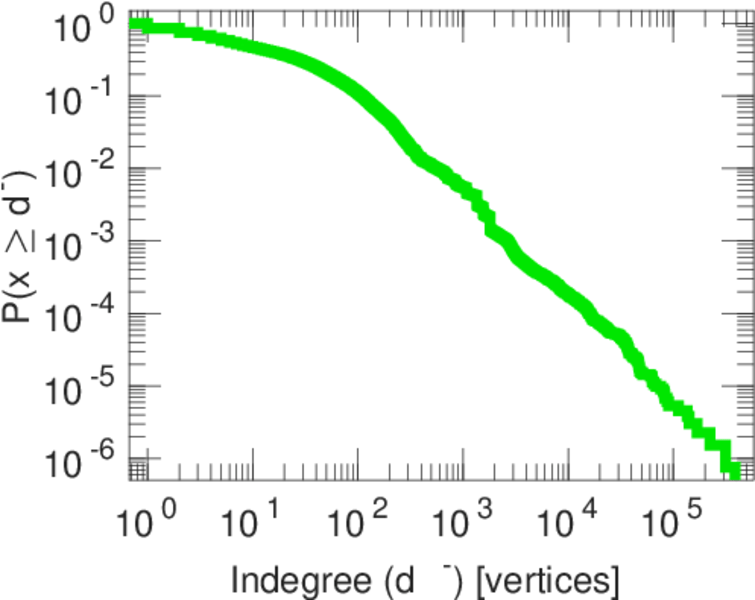
| Maximum indegree | d−max = | 385,642
|
| Average degree | d = | 83.212 3
|
| Fill | p = | 2.463 93 × 10−5
|
| Size of LCC | N = | 1,688,577
|
| Size of LSCC | Ns = | 1,169,427
|
| Relative size of LSCC | Nrs = | 0.764 764
|
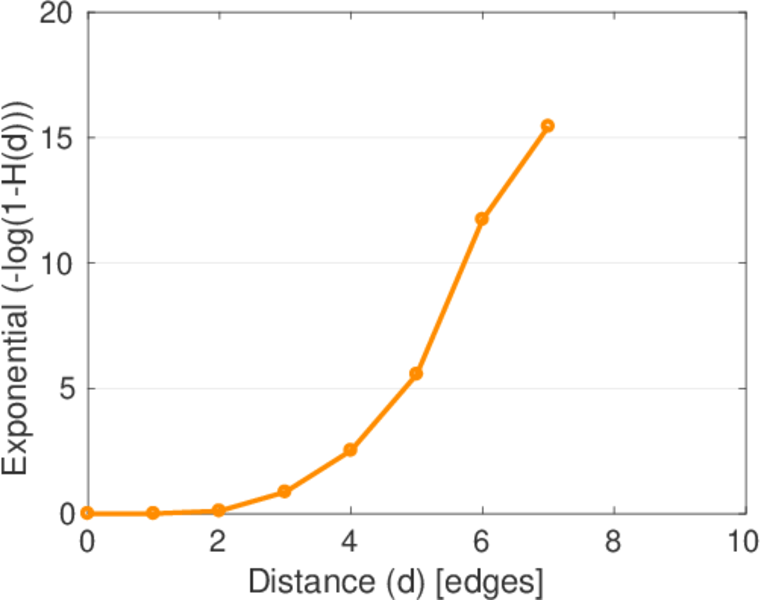
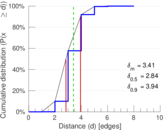
| Diameter | δ = | 10
|
| 50-Percentile effective diameter | δ0.5 = | 2.838 46
|
| 90-Percentile effective diameter | δ0.9 = | 3.943 67
|
| Median distance | δM = | 3
|
| Mean distance | δm = | 3.408 01
|
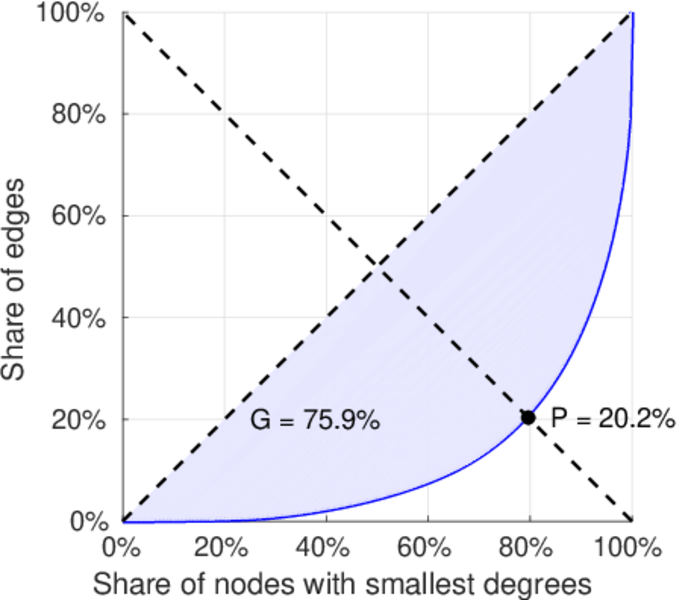
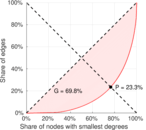
| Gini coefficient | G = | 0.730 609
|
| Balanced inequality ratio | P = | 0.202 036
|
| Outdegree balanced inequality ratio | P+ = | 0.232 768
|
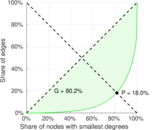
| Indegree balanced inequality ratio | P− = | 0.180 227
|
| Relative edge distribution entropy | Her = | 0.898 056
|
| Power law exponent | γ = | 1.365 74
|
| Tail power law exponent | γt = | 2.291 00
|
| Degree assortativity | ρ = | −0.031 591 5
|
| Degree assortativity p-value | pρ = | 0.000 00
|
| Clustering coefficient | c = | 0.033 409 1
|
| Directed clustering coefficient | c± = | 0.556 853
|
| Spectral norm | α = | 2,987.23
|
| Operator 2-norm | ν = | 1,688.38
|
| Cyclic eigenvalue | π = | 1,310.84
|
| Reciprocity | y = | 0.553 419
|
| Non-bipartivity | bA = | 0.662 035
|
| Normalized non-bipartivity | bN = | 0.037 584 2
|
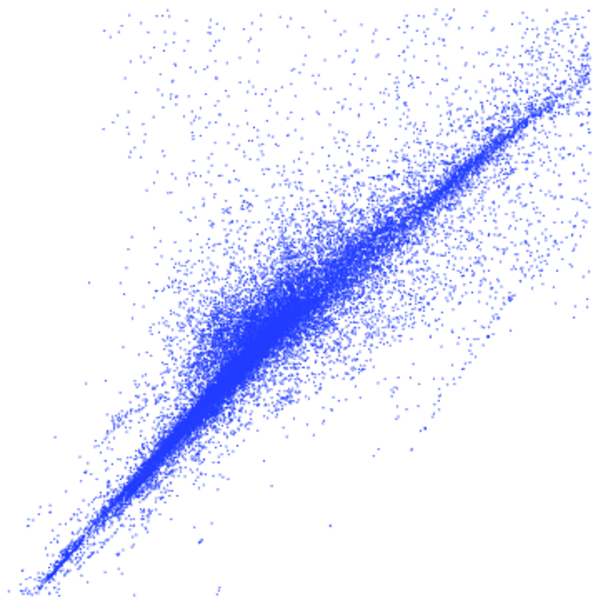
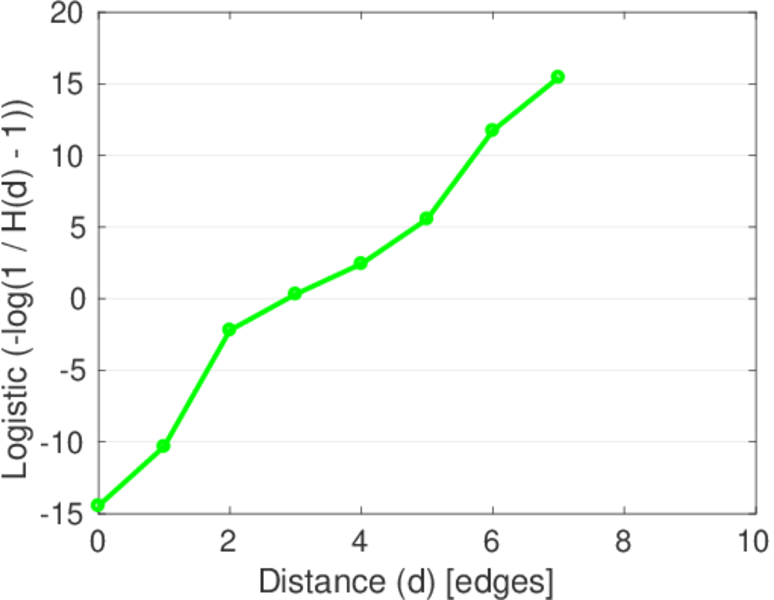
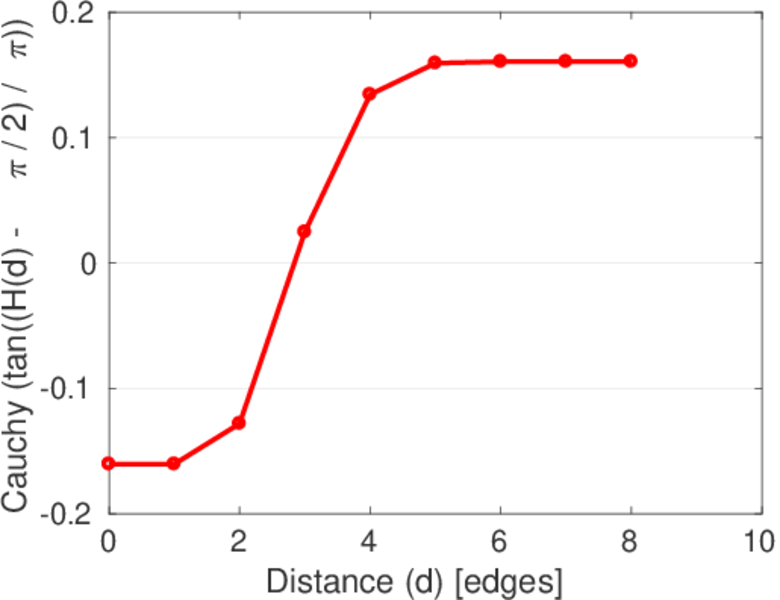
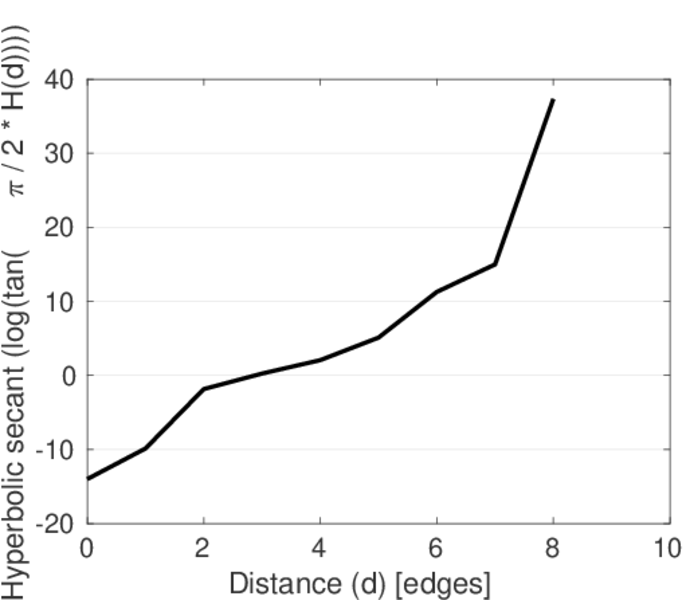
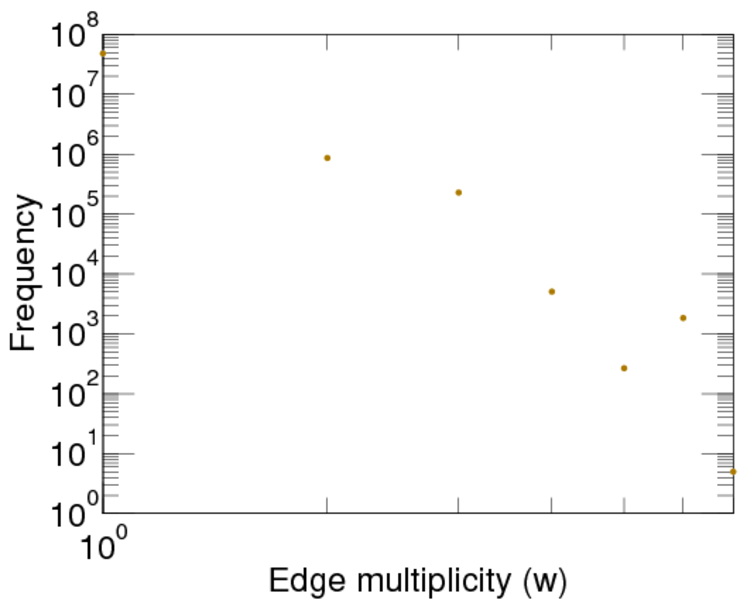
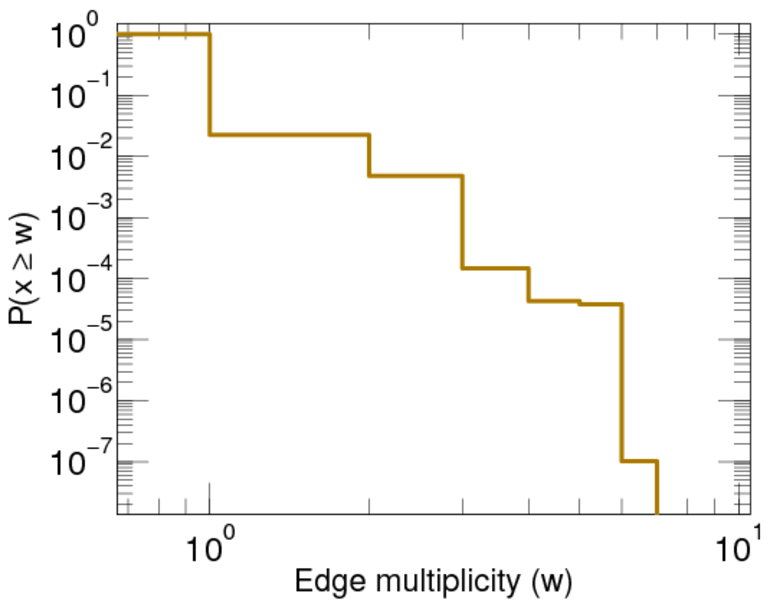
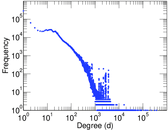
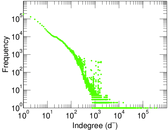
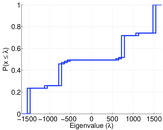
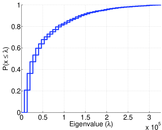
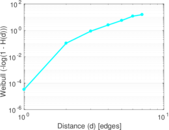
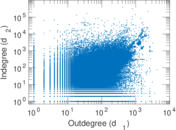
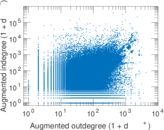
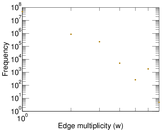
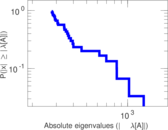
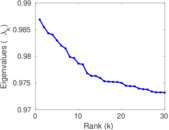
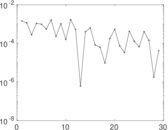
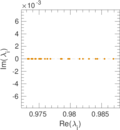
Plots


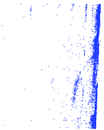
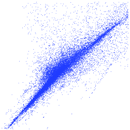


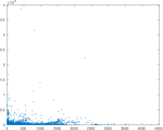

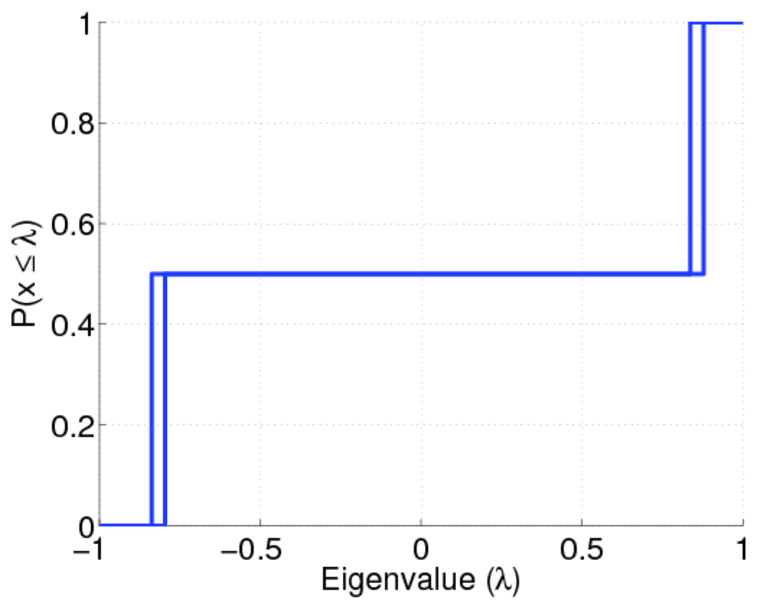
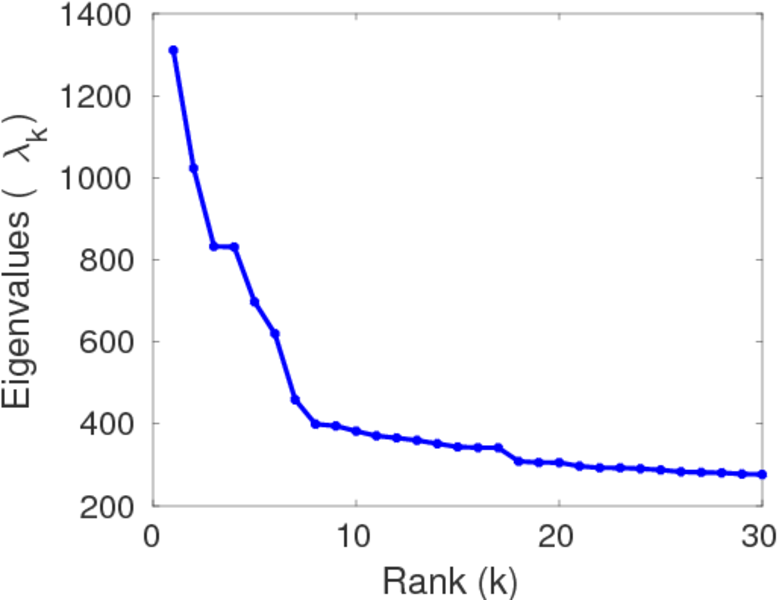
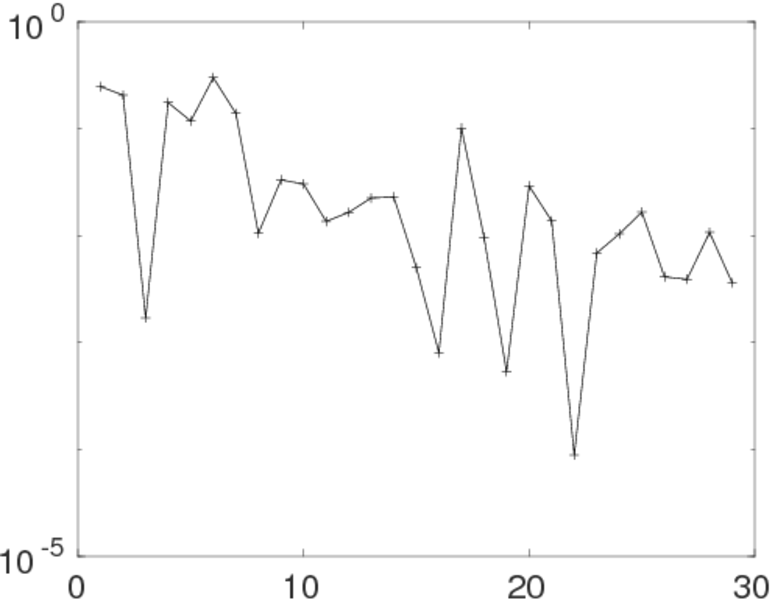
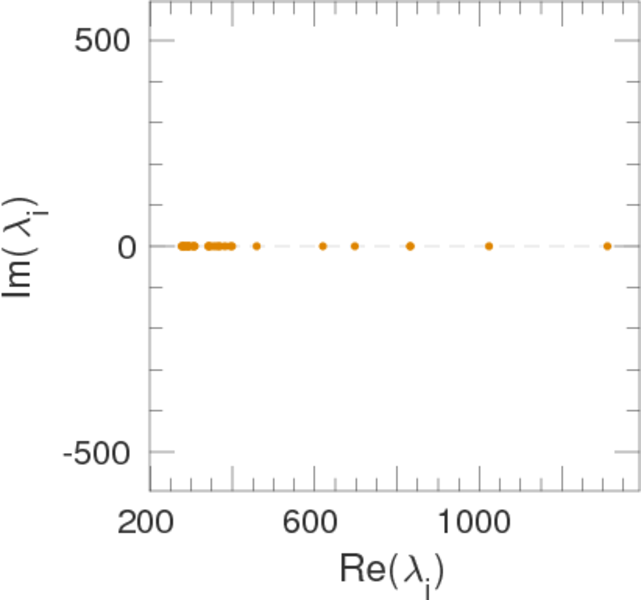
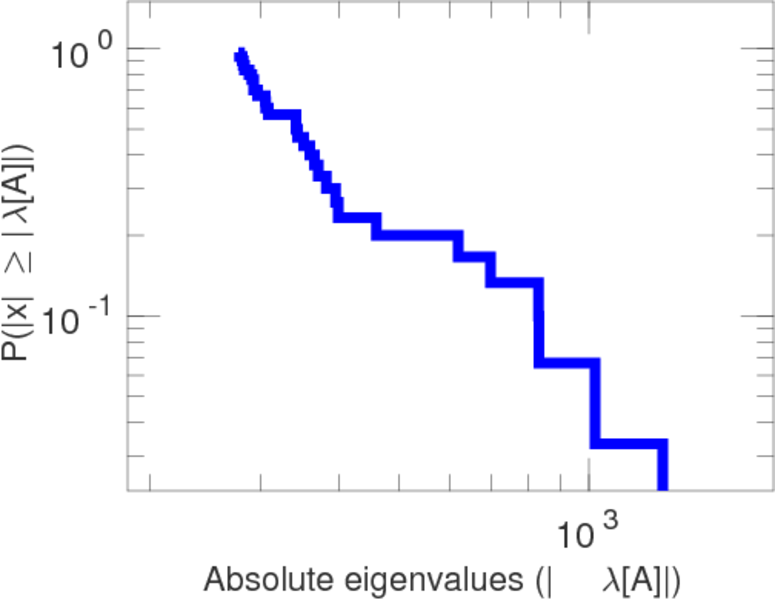
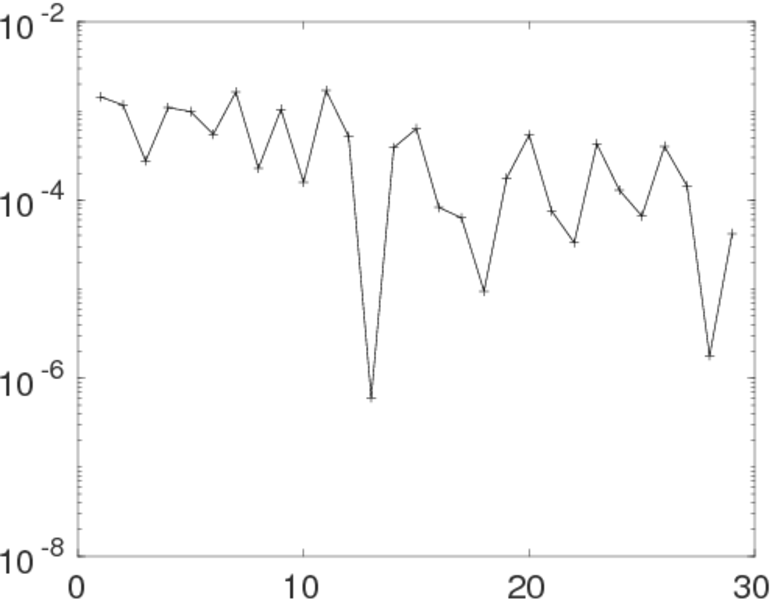
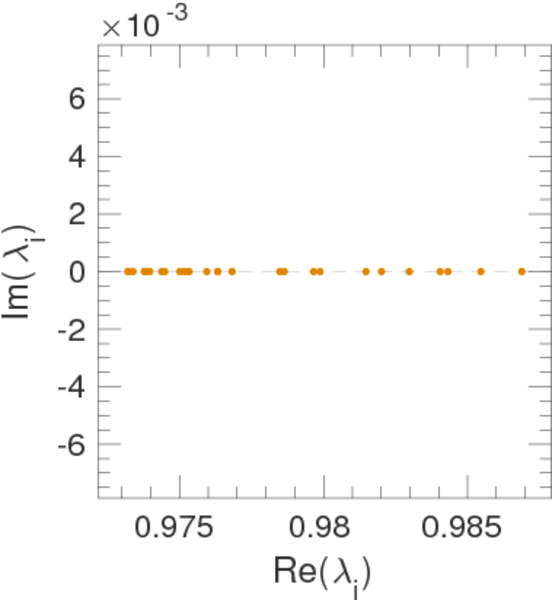
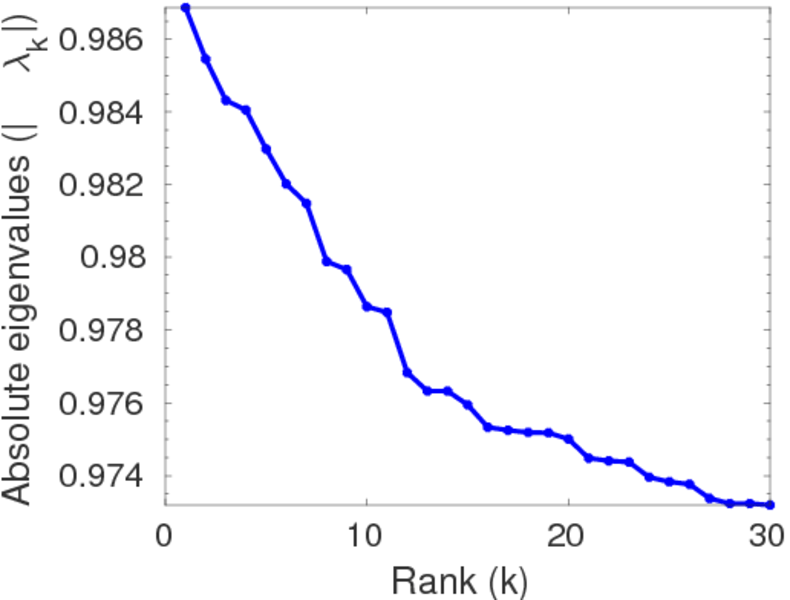
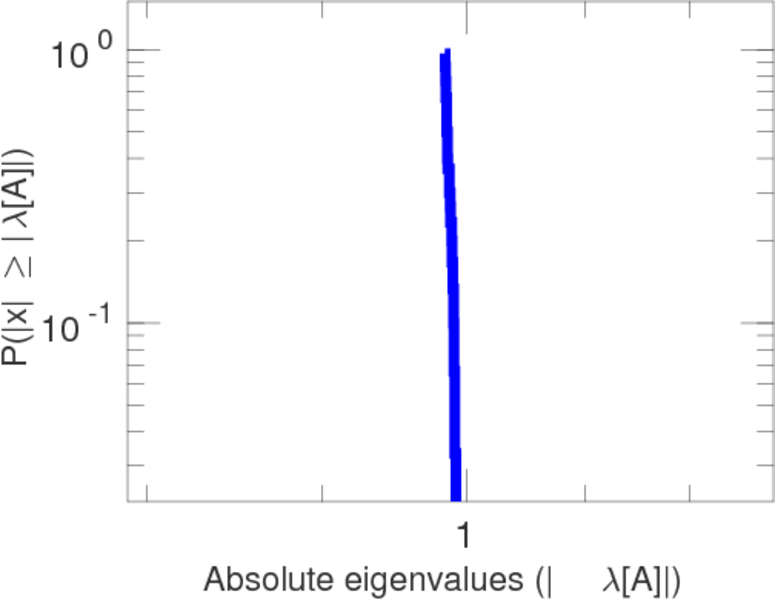
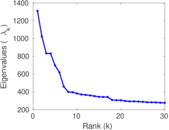
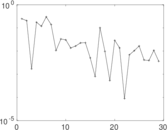
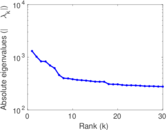
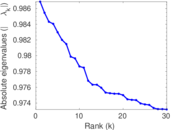
Matrix decompositions plots


Downloads
References
|
[1]
|
Jérôme Kunegis.
KONECT – The Koblenz Network Collection.
In Proc. Int. Conf. on World Wide Web Companion, pages
1343–1350, 2013.
[ http ]
|
 KONECT ‣ Networks ‣
Buy Me a Coffee
KONECT ‣ Networks ‣
Buy Me a Coffee