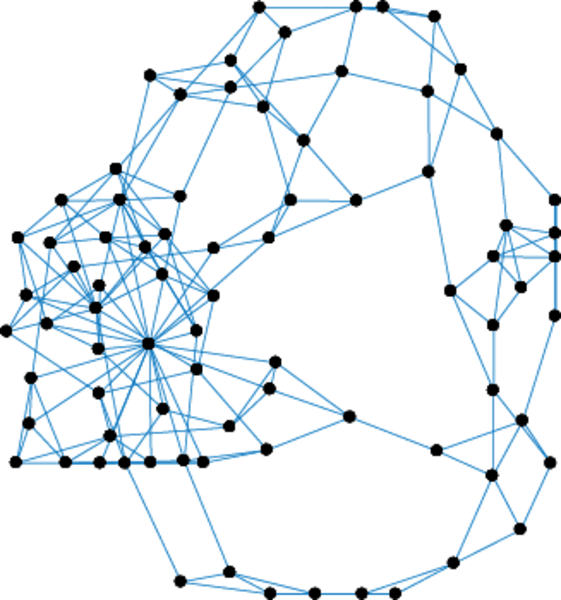
Actor collaborations
These are actor connected by an edge if they both appeared in the same movie.
Each edge is one collaboration, and thus multiple edges are possible.
Metadata
Statistics
| Size | n = | 382,219
|
| Volume | m = | 33,115,812
|
| Unique edge count | m̿ = | 30,076,166
|
| Loop count | l = | 0
|
| Wedge count | s = | 6,266,209,411
|
| Claw count | z = | 18,499,665,265,236
|
| Cross count | x = | 15,470,703,653,059,368
|
| Triangle count | t = | 346,813,199
|
| Square count | q = | 86,624,264,954
|
| 4-Tour count | T4 = | 718,089,033,442
|
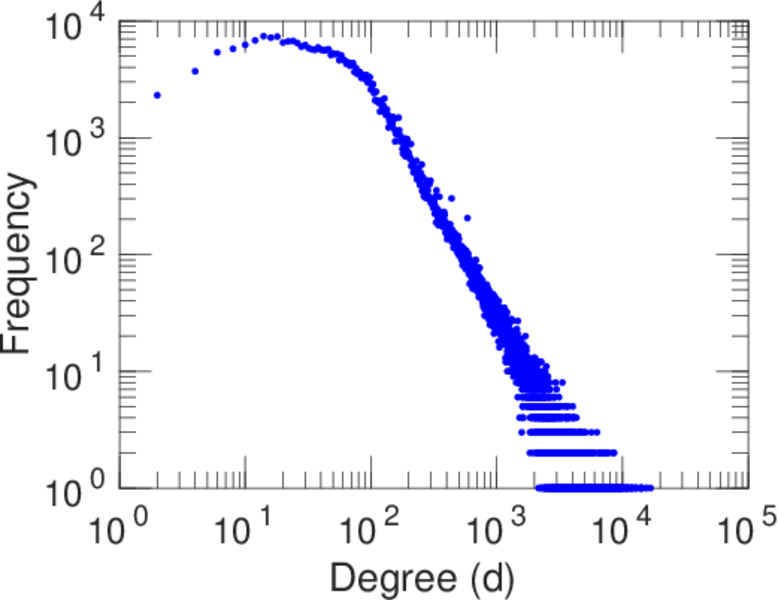
| Maximum degree | dmax = | 16,764
|
| Average degree | d = | 173.282
|
| Fill | p = | 0.000 411 746
|
| Average edge multiplicity | m̃ = | 1.101 06
|
| Size of LCC | N = | 374,511
|
| Diameter | δ = | 13
|
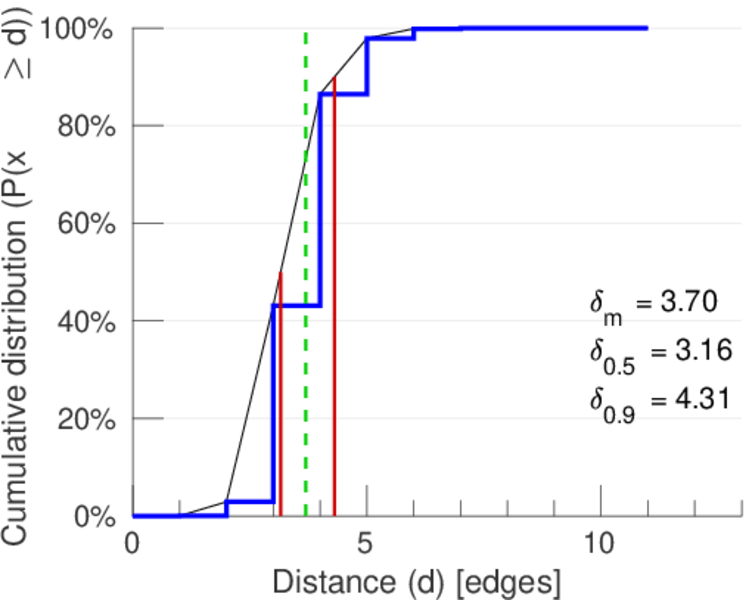
| 50-Percentile effective diameter | δ0.5 = | 3.158 73
|
| 90-Percentile effective diameter | δ0.9 = | 4.309 99
|
| Median distance | δM = | 4
|
| Mean distance | δm = | 3.698 04
|
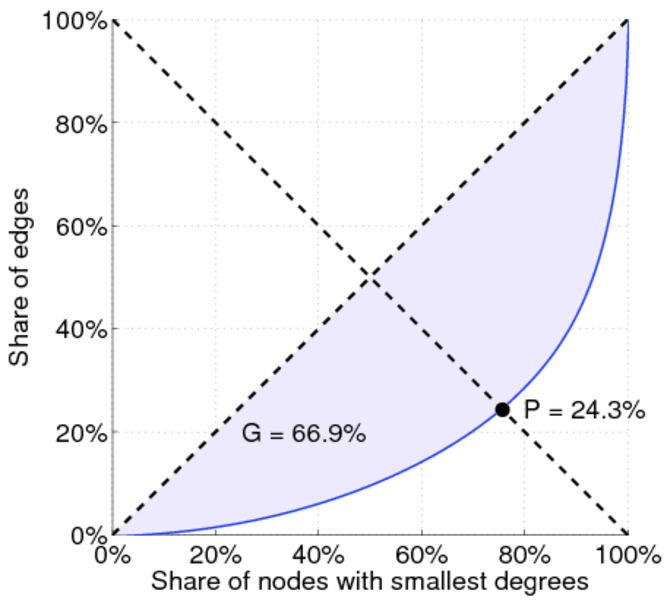
| Gini coefficient | G = | 0.668 859
|
| Balanced inequality ratio | P = | 0.242 902
|
| Relative edge distribution entropy | Her = | 0.931 486
|
| Power law exponent | γ = | 1.281 64
|
| Tail power law exponent | γt = | 2.131 00
|
| Degree assortativity | ρ = | +0.226 725
|
| Degree assortativity p-value | pρ = | 0.000 00
|
| Clustering coefficient | c = | 0.166 040
|
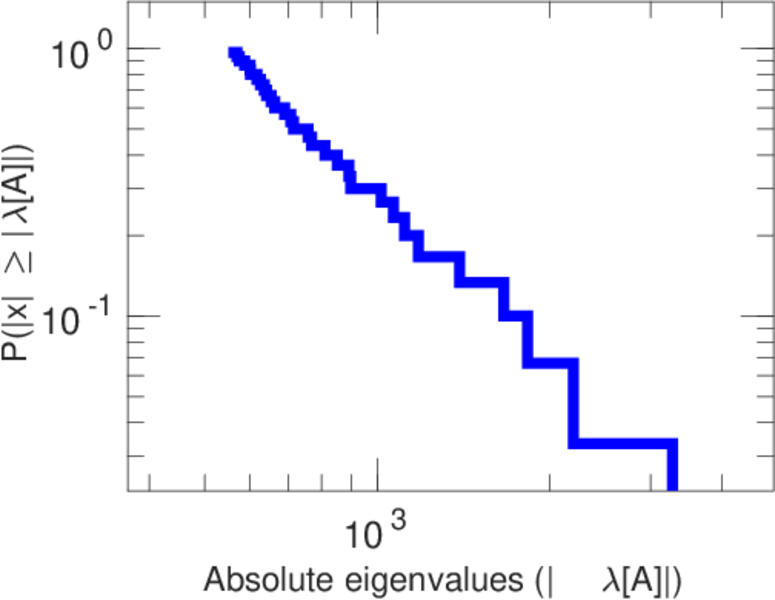
| Spectral norm | α = | 3,278.61
|
| Spectral separation | |λ1[A] / λ2[A]| = | 1.489 02
|
| Non-bipartivity | bA = | 0.867 127
|
| Normalized non-bipartivity | bN = | 0.153 139
|
| Algebraic non-bipartivity | χ = | 0.235 956
|
| Spectral bipartite frustration | bK = | 0.000 735 675
|
| Controllability | C = | 473
|
| Relative controllability | Cr = | 0.001 237 51
|
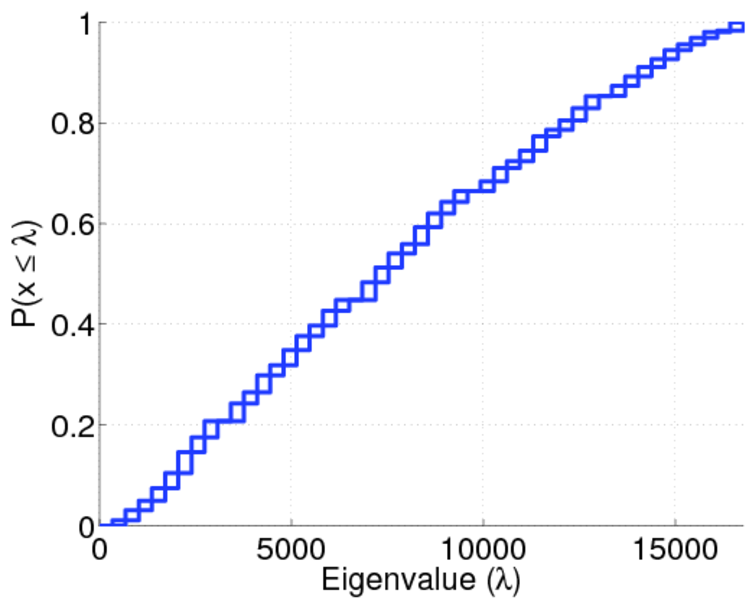
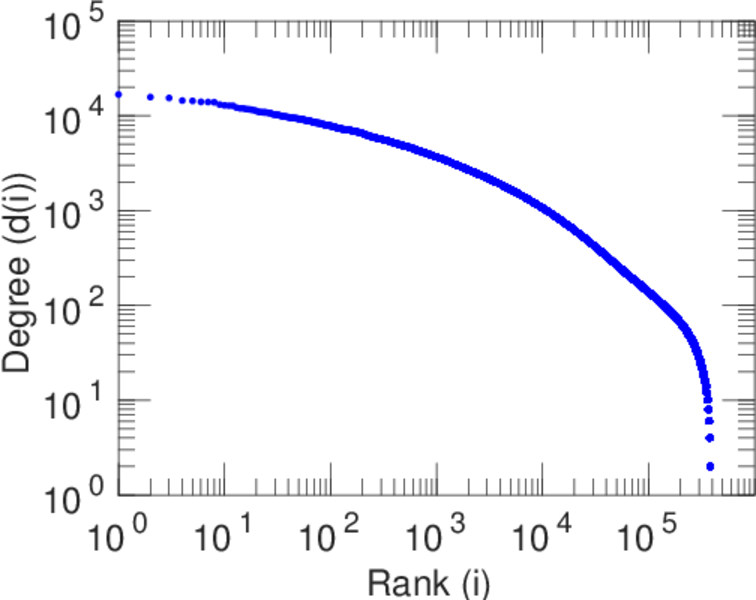
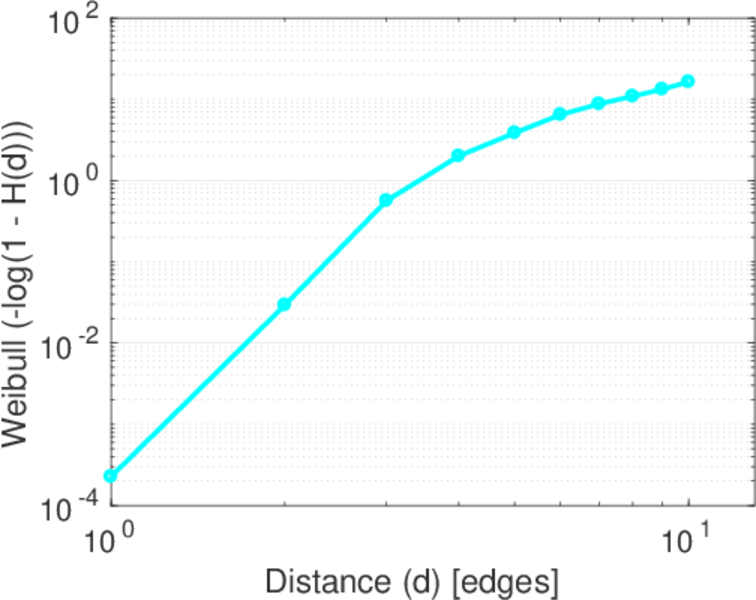
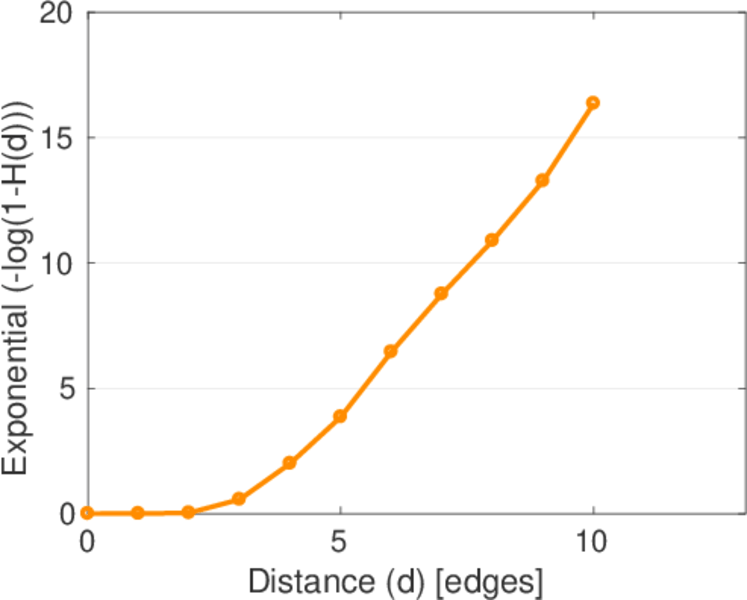
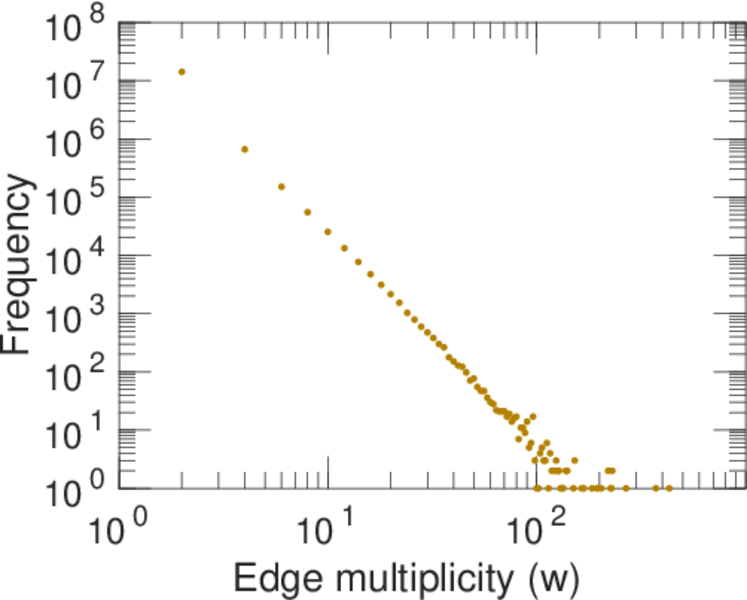
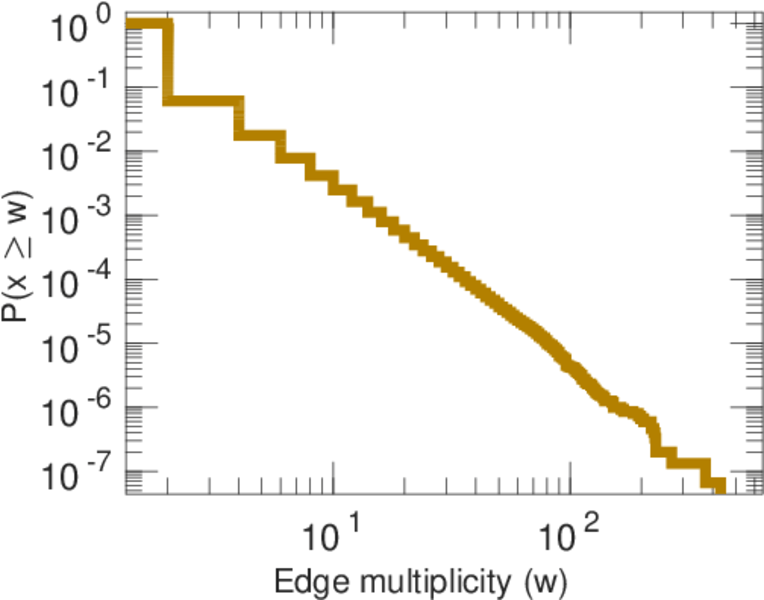
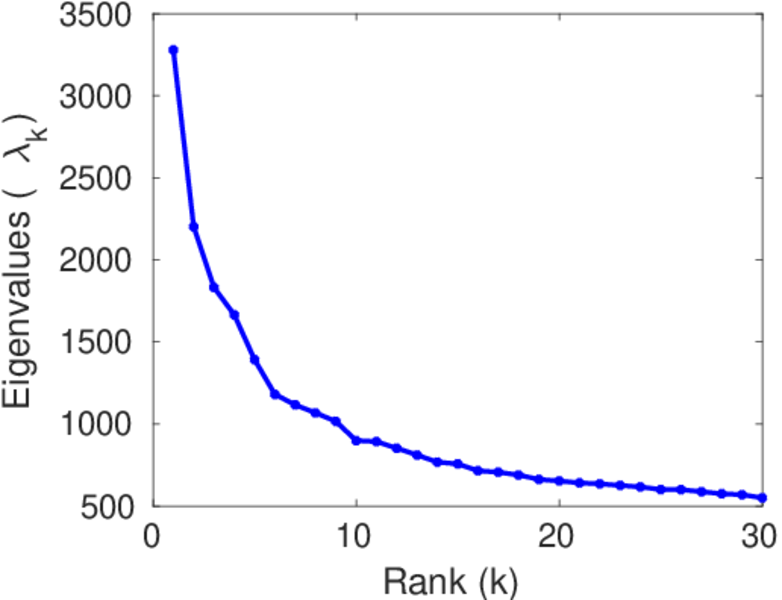
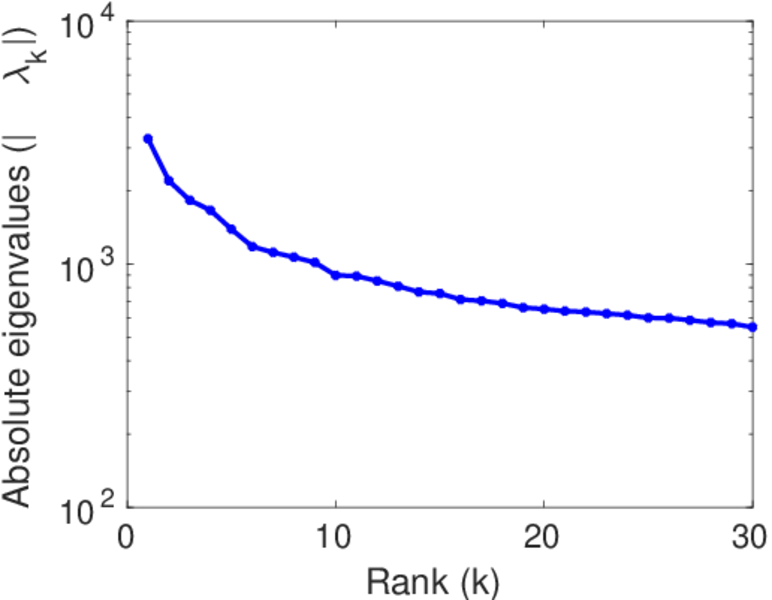
Plots


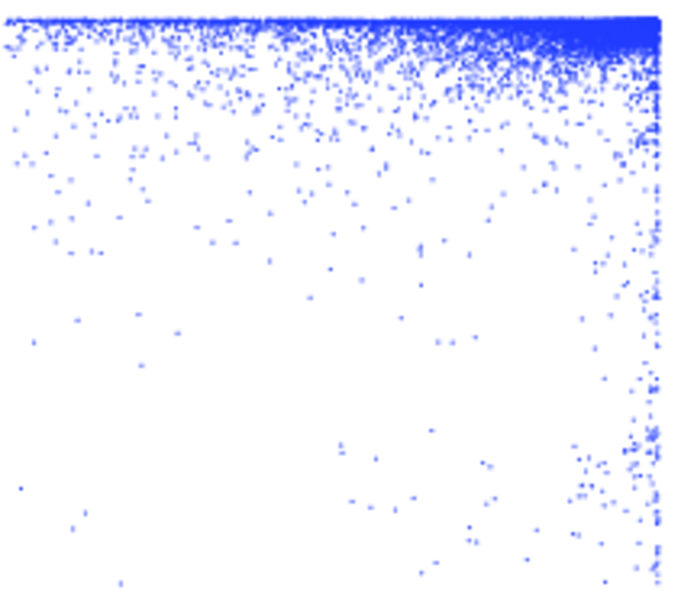
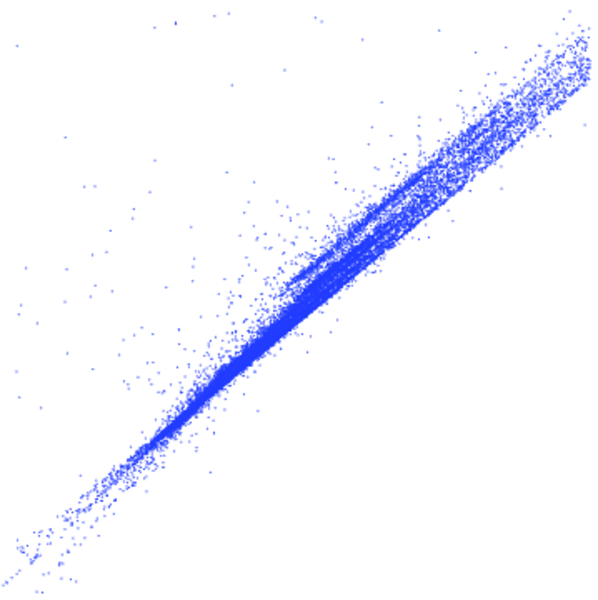
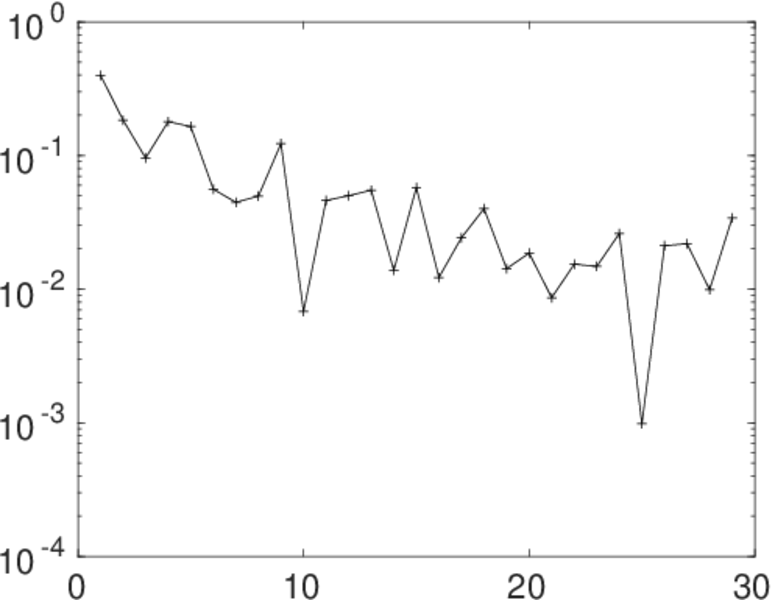
Matrix decompositions plots


Downloads
References
|
[1]
|
Jérôme Kunegis.
KONECT – The Koblenz Network Collection.
In Proc. Int. Conf. on World Wide Web Companion, pages
1343–1350, 2013.
[ http ]
|
|
[2]
|
Albert-László Barabási and Réka Albert.
Emergence of scaling in random networks.
Science, 286(5439):509–512, 1999.
|
 KONECT ‣ Networks ‣
Buy Me a Coffee
KONECT ‣ Networks ‣
Buy Me a Coffee