Actor movies
This is a bipartite network of movies and the actors that have played in them.
Metadata
Statistics
| Size | n = | 511,463
|
| Left size | n1 = | 127,823
|
| Right size | n2 = | 383,640
|
| Volume | m = | 1,470,404
|
| Wedge count | s = | 39,482,206
|
| Claw count | z = | 1,058,085,710
|
| Square count | q = | 3,503,276
|
| 4-Tour count | T4 = | 188,903,364
|
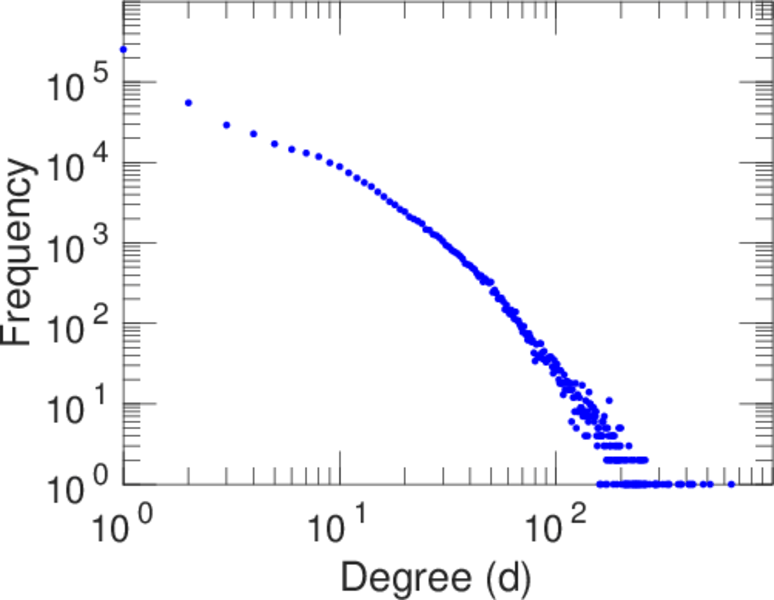
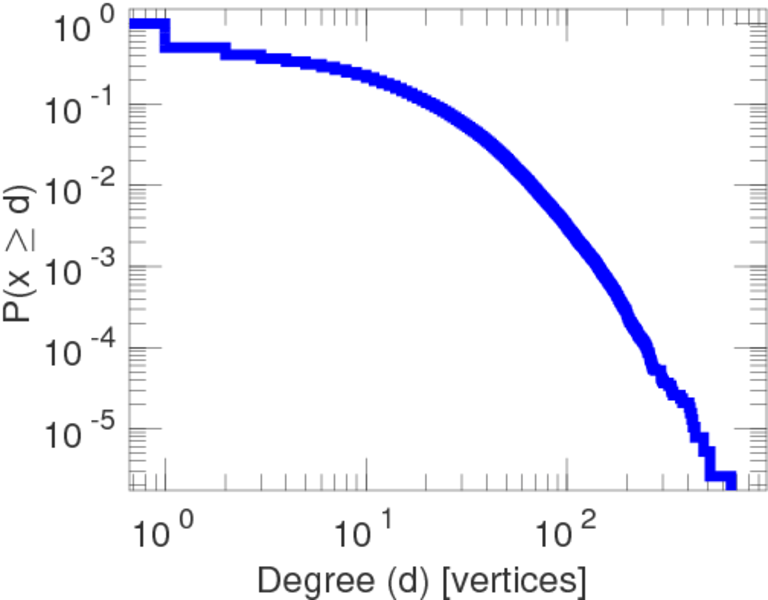
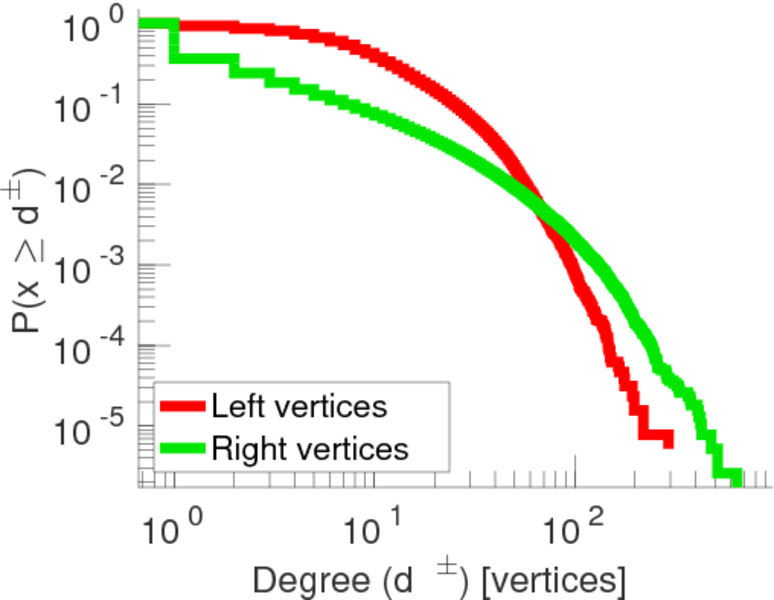
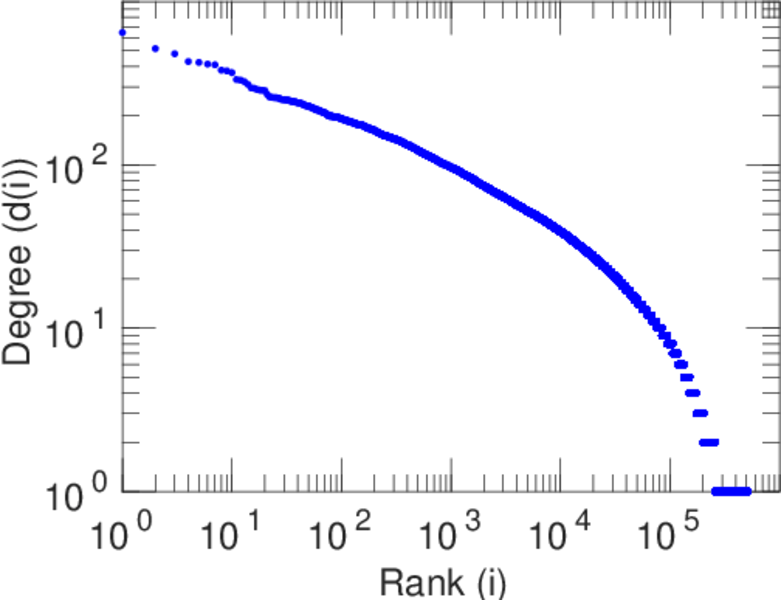
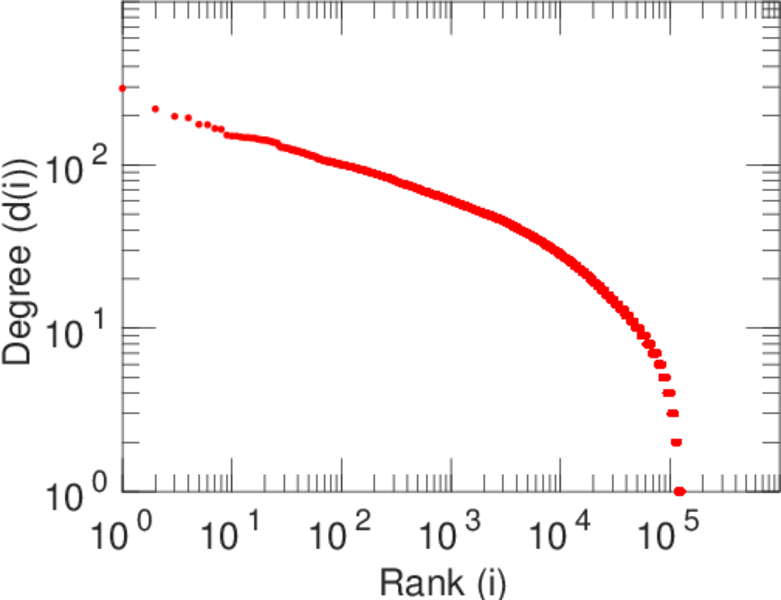
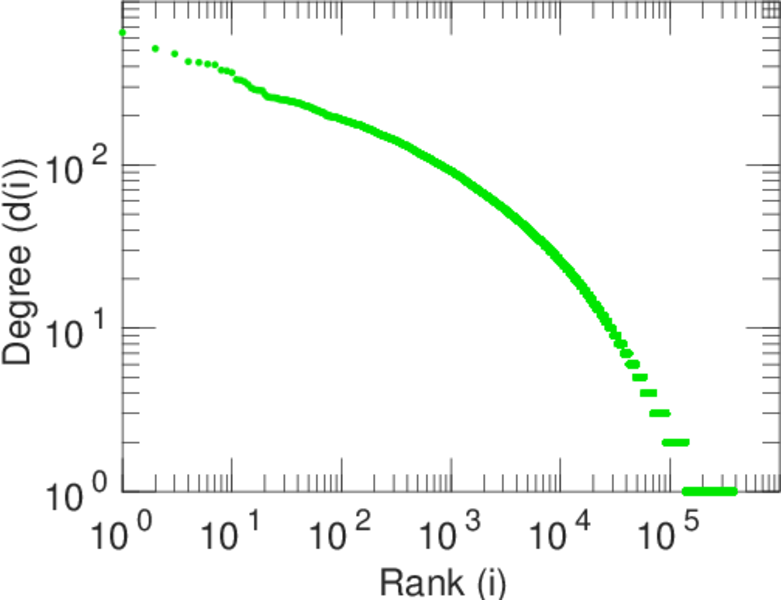
| Maximum degree | dmax = | 646
|
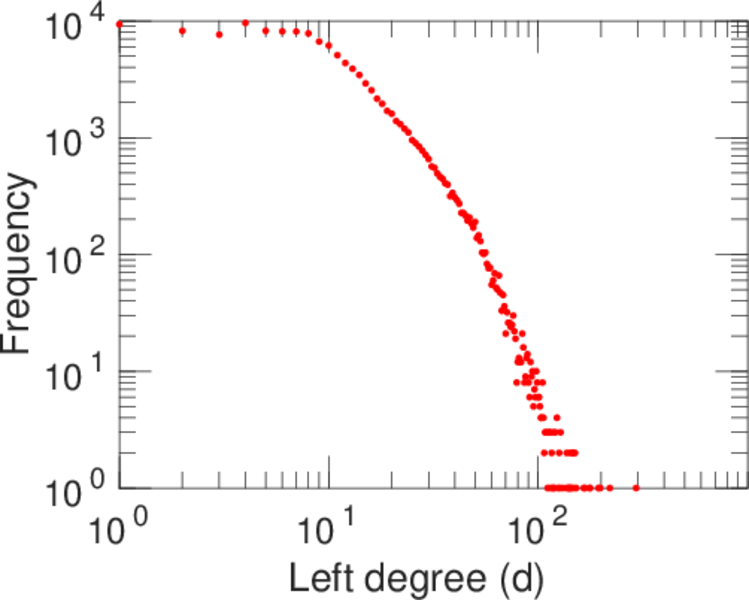
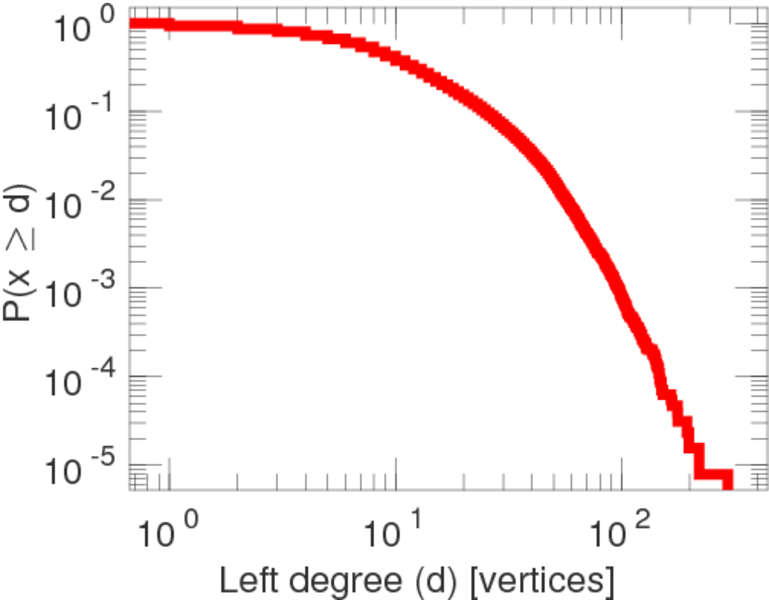
| Maximum left degree | d1max = | 294
|
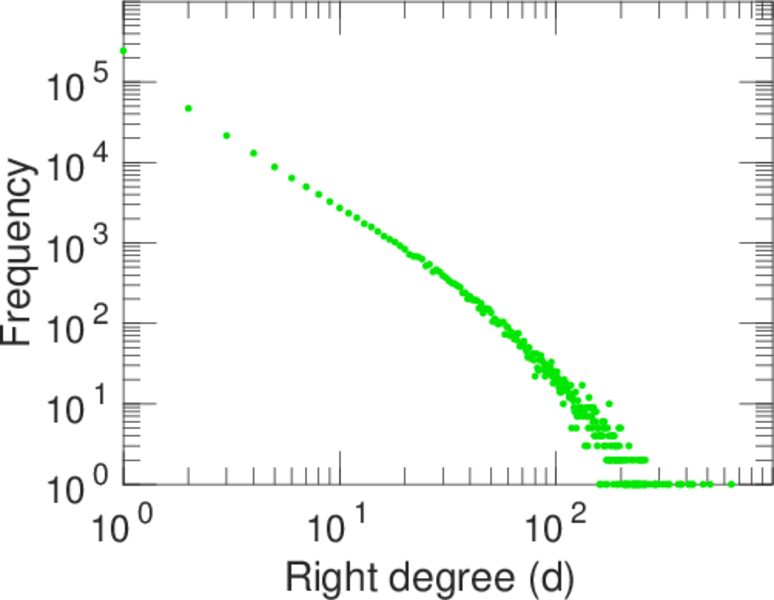
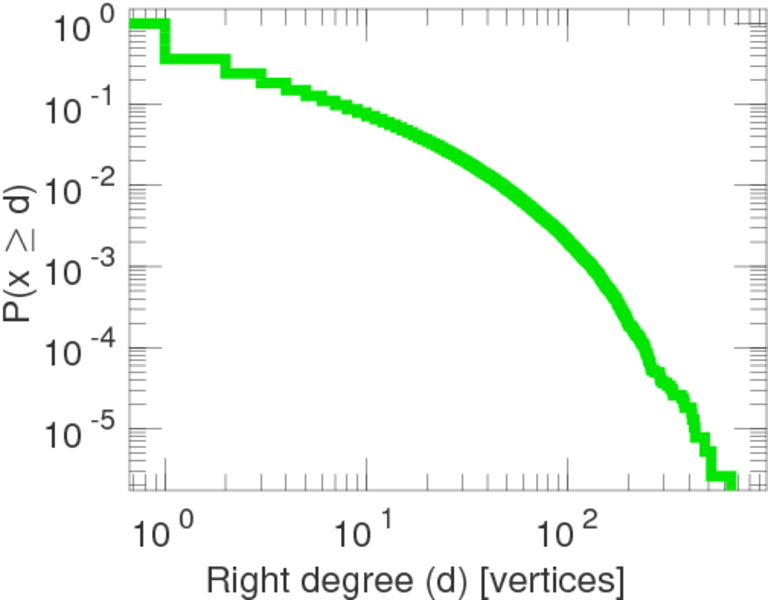
| Maximum right degree | d2max = | 646
|
| Average degree | d = | 5.749 80
|
| Average left degree | d1 = | 11.503 4
|
| Average right degree | d2 = | 3.832 77
|
| Fill | p = | 2.998 50 × 10−5
|
| Size of LCC | N = | 498,923
|
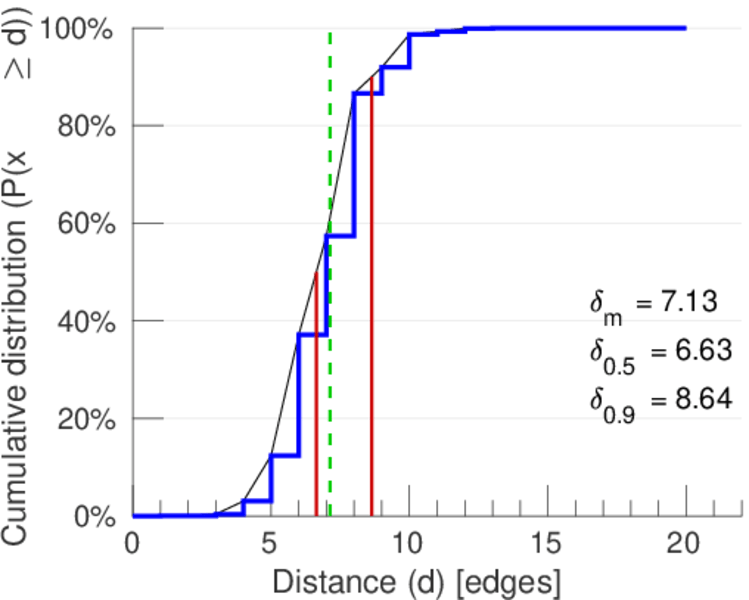
| Diameter | δ = | 27
|
| 50-Percentile effective diameter | δ0.5 = | 6.634 76
|
| 90-Percentile effective diameter | δ0.9 = | 8.636 01
|
| Median distance | δM = | 7
|
| Mean distance | δm = | 7.133 30
|
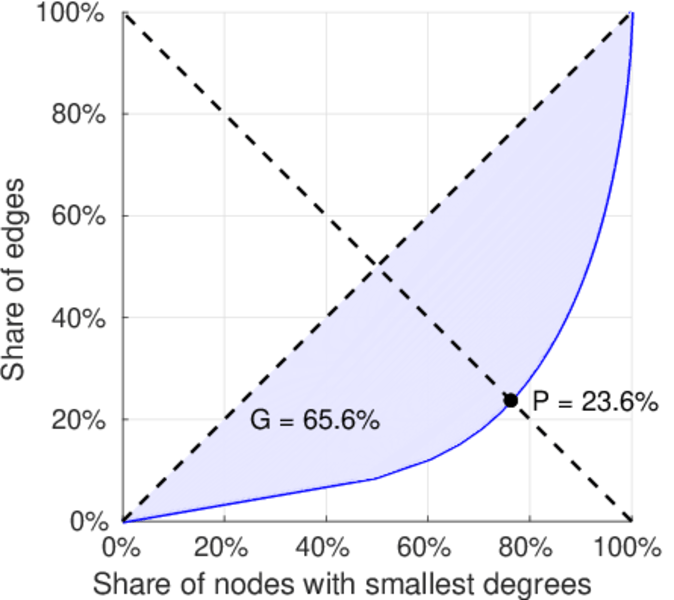
| Gini coefficient | G = | 0.687 090
|
| Balanced inequality ratio | P = | 0.224 123
|
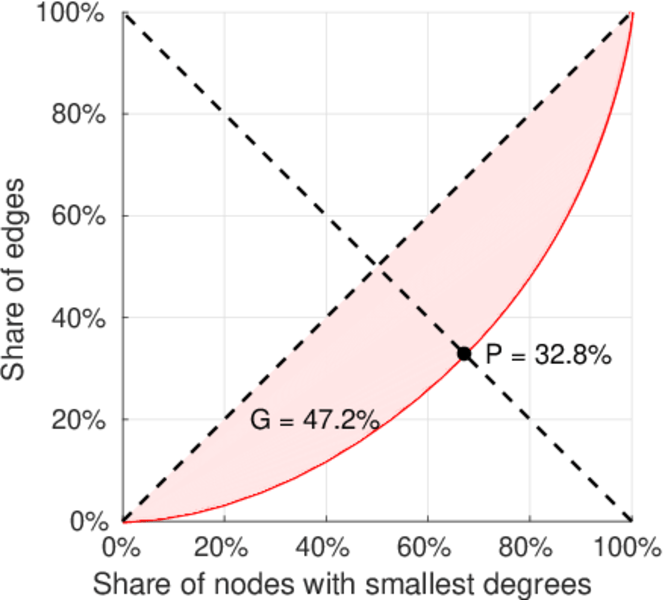
| Left balanced inequality ratio | P1 = | 0.327 646
|
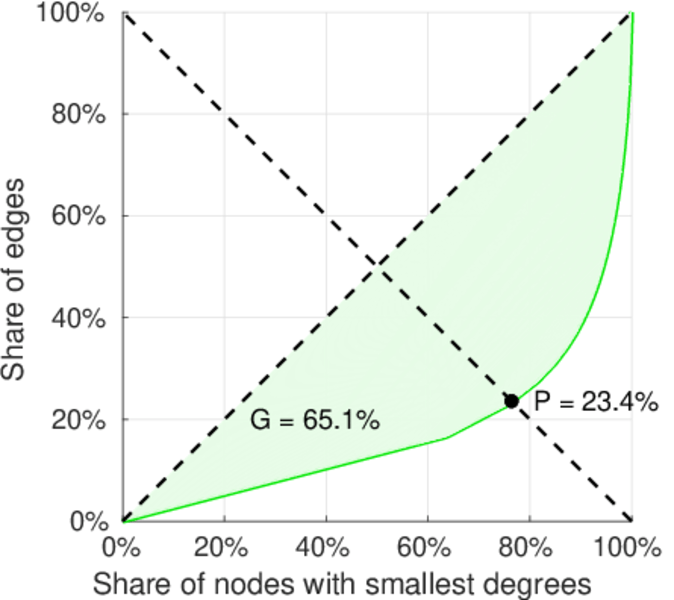
| Right balanced inequality ratio | P2 = | 0.234 349
|
| Relative edge distribution entropy | Her = | 0.932 904
|
| Tail power law exponent | γt = | 3.631 00
|
| Tail power law exponent with p | γ3 = | 3.631 00
|
| p-value | p = | 0.000 00
|
| Left tail power law exponent with p | γ3,1 = | 5.071 00
|
| Left p-value | p1 = | 0.017 000 0
|
| Right tail power law exponent with p | γ3,2 = | 2.001 00
|
| Right p-value | p2 = | 0.000 00
|
| Degree assortativity | ρ = | −0.117 625
|
| Degree assortativity p-value | pρ = | 0.000 00
|
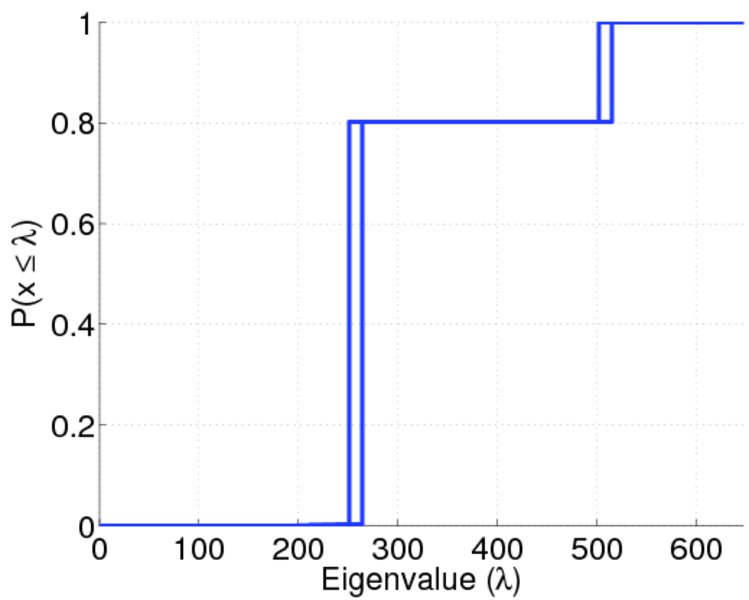
| Spectral norm | α = | 42.251 9
|
| Controllability | C = | 284,341
|
| Relative controllability | Cr = | 0.555 937
|
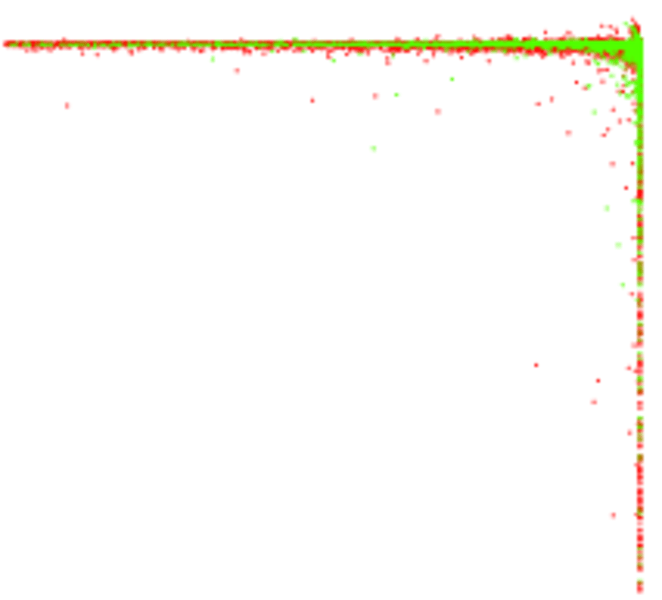
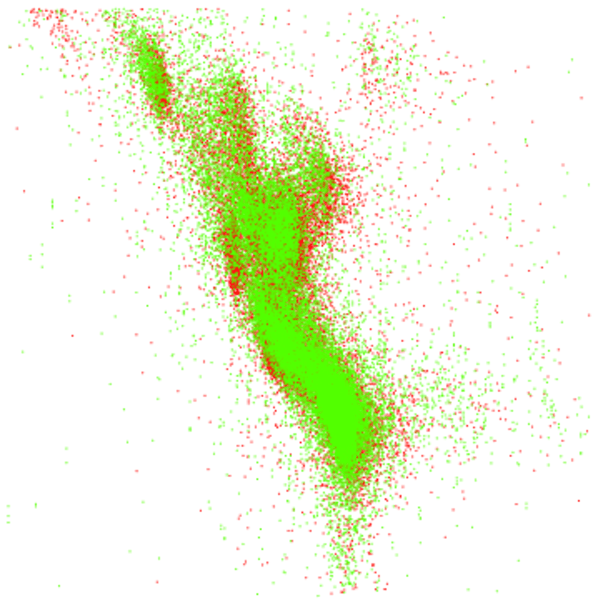
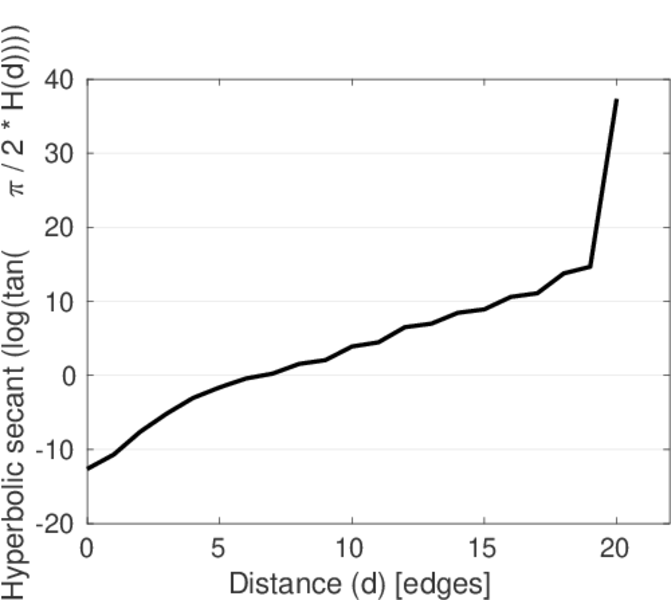
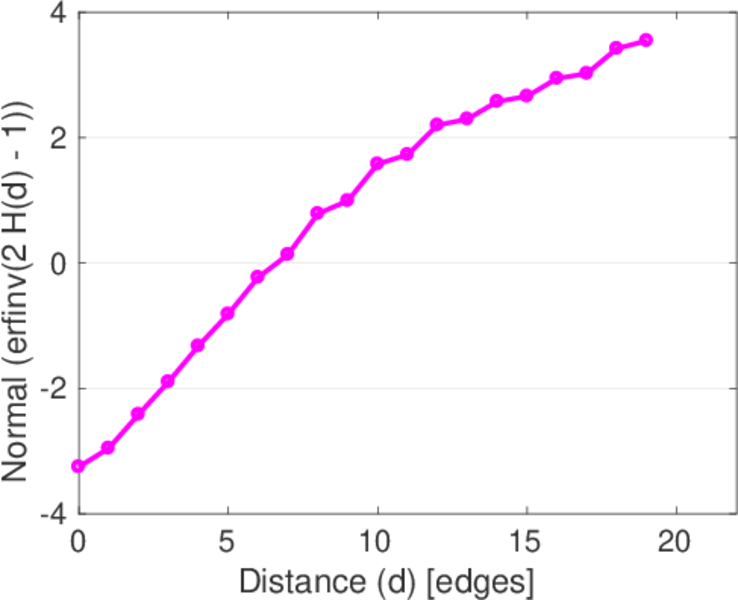
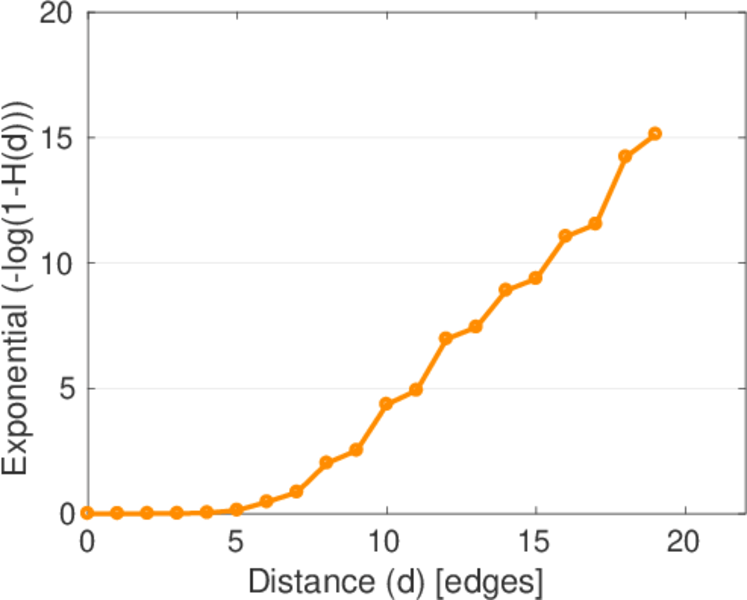
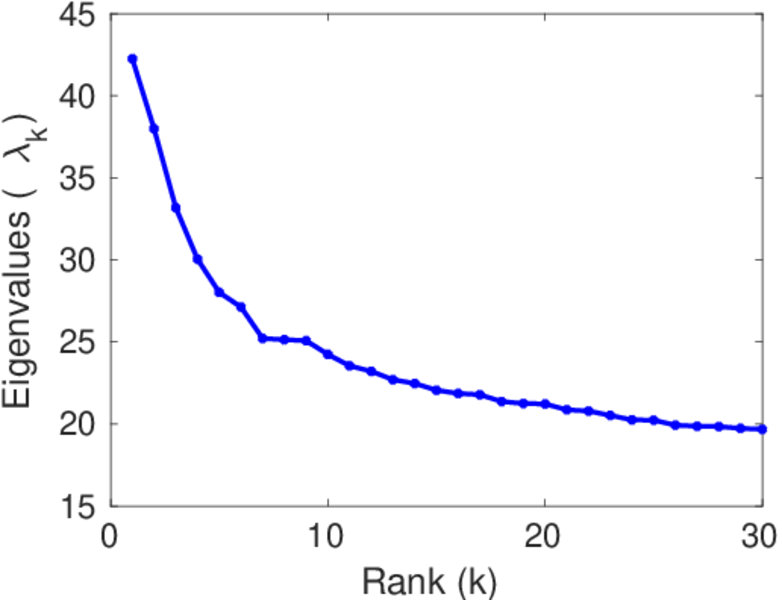
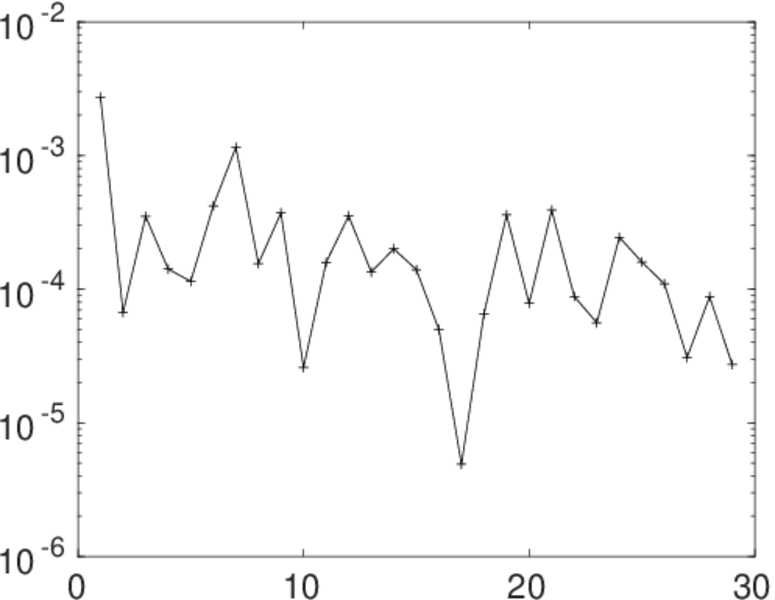
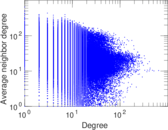
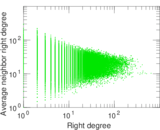
Plots


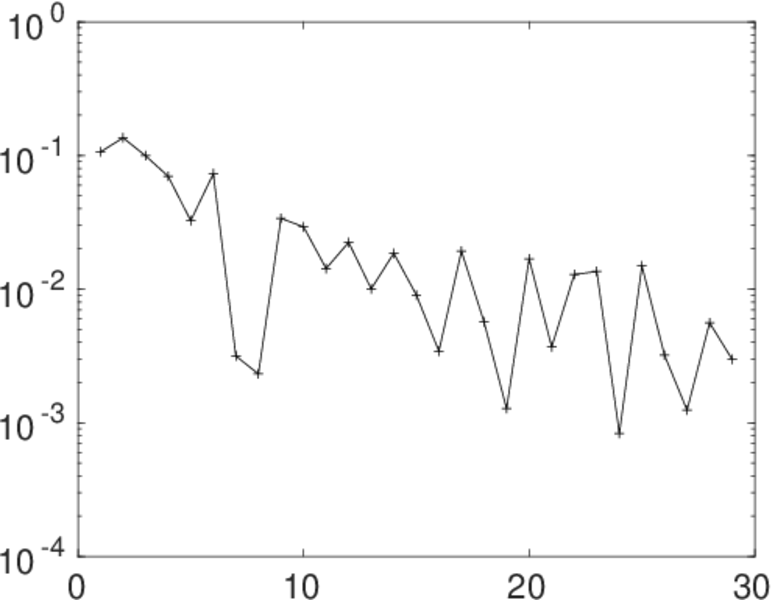
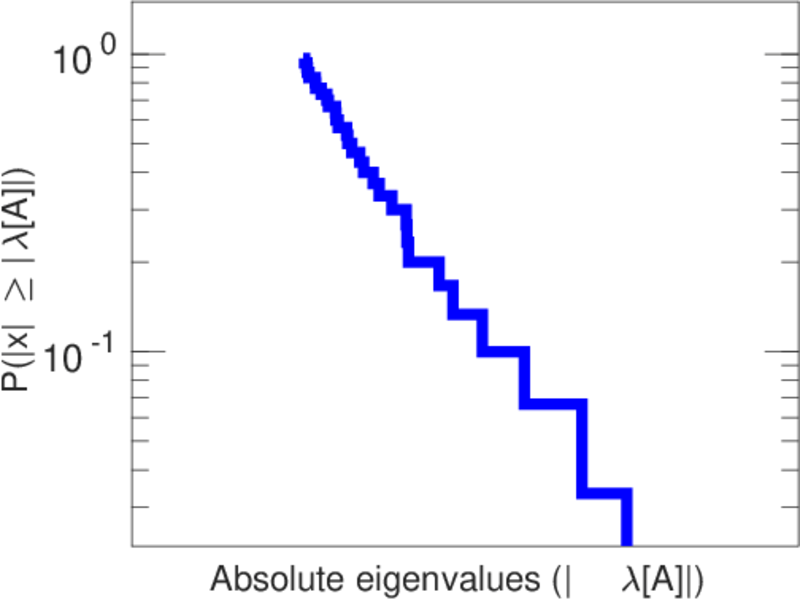
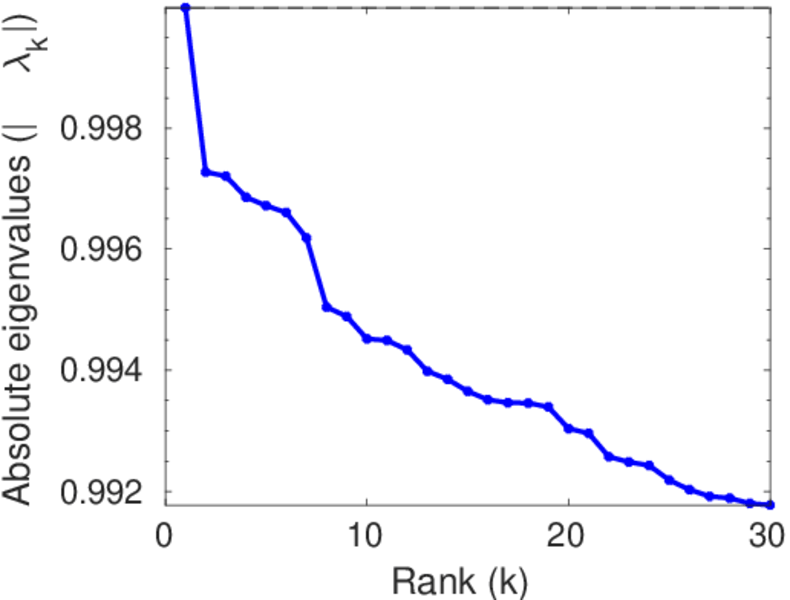
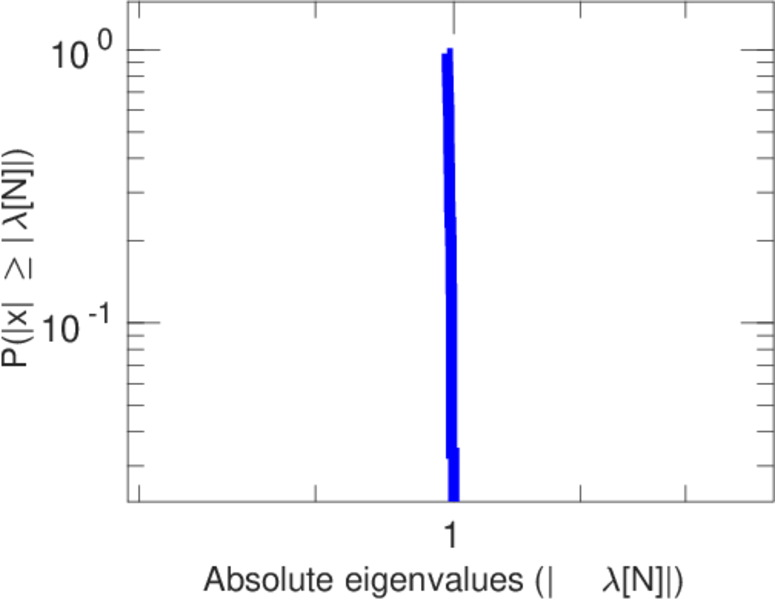
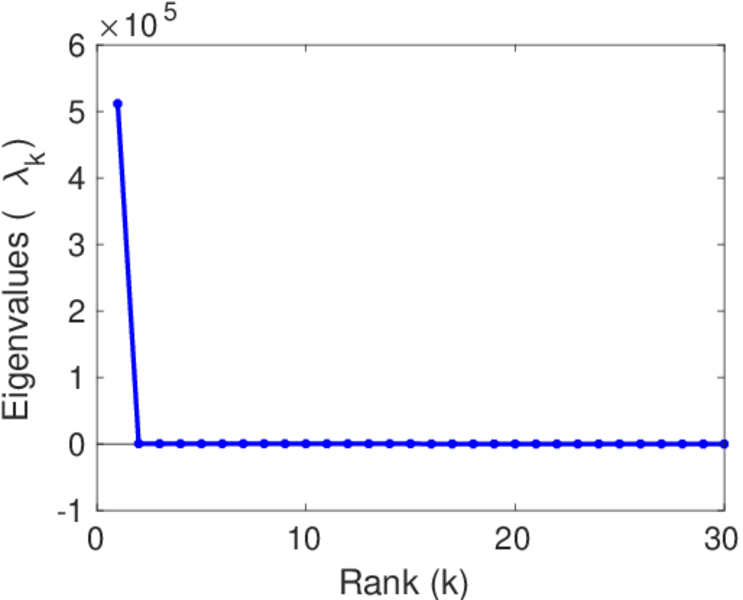
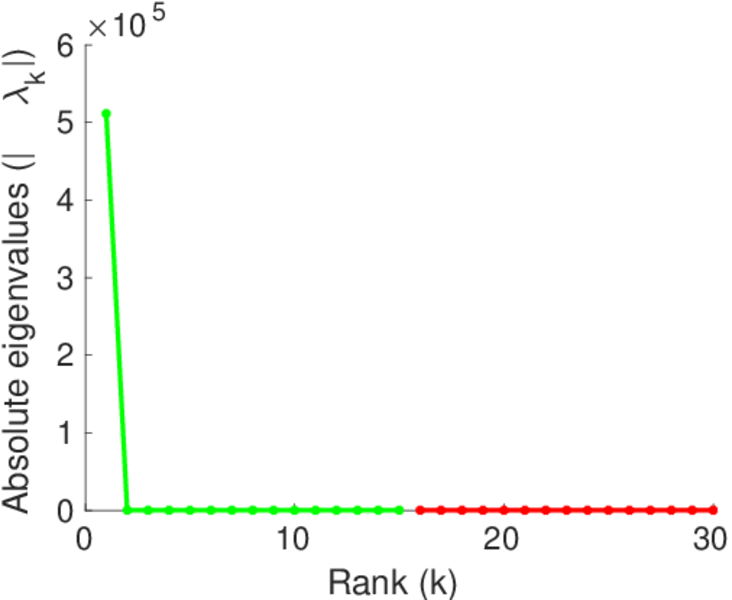
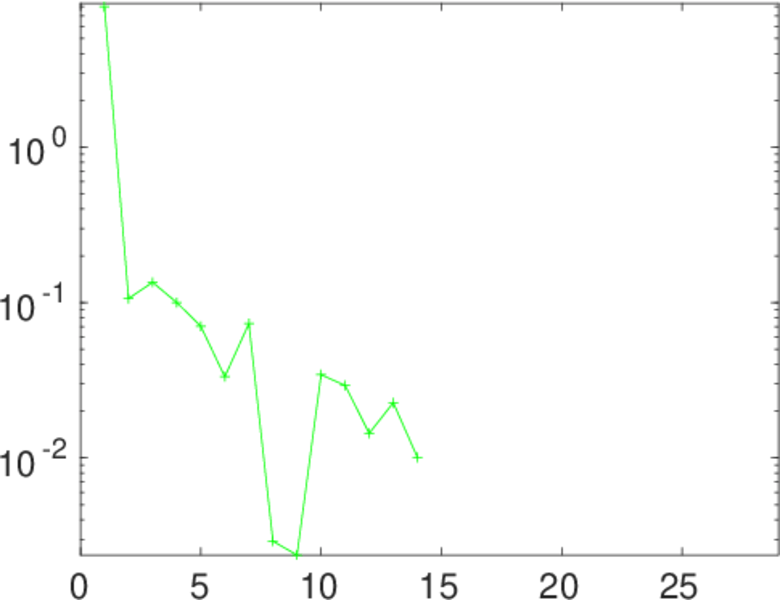
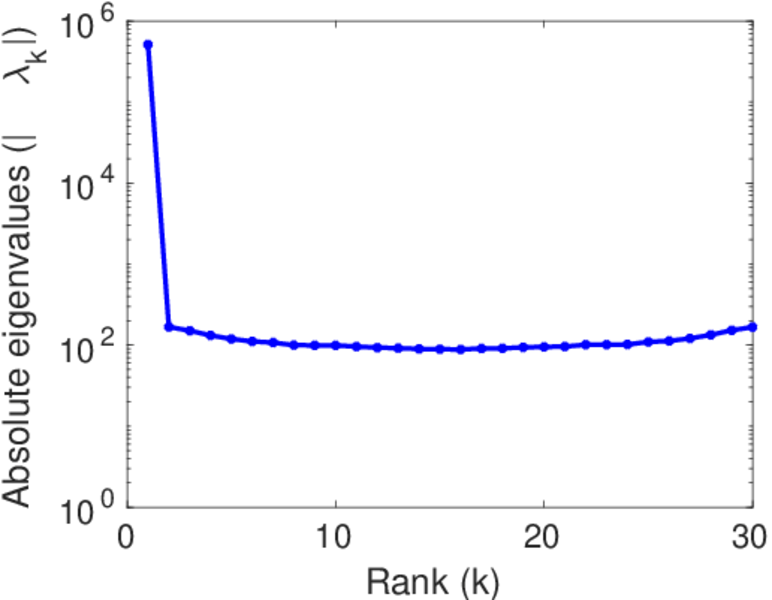
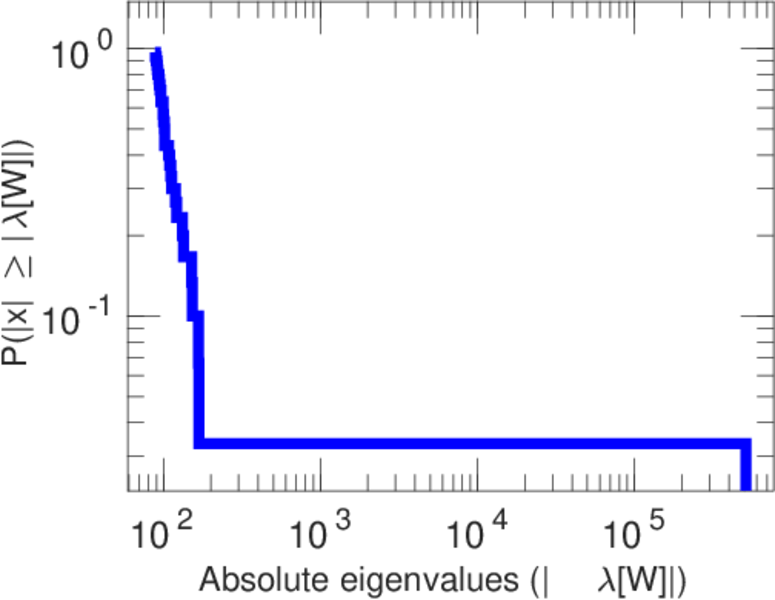
Matrix decompositions plots


Downloads
References
|
[1]
|
Jérôme Kunegis.
KONECT – The Koblenz Network Collection.
In Proc. Int. Conf. on World Wide Web Companion, pages
1343–1350, 2013.
[ http ]
|
|
[2]
|
Albert-László Barabási and Réka Albert.
Emergence of scaling in random networks.
Science, 286(5439):509–512, 1999.
|
 KONECT ‣ Networks ‣
Buy Me a Coffee
KONECT ‣ Networks ‣
Buy Me a Coffee