IMDB
This is a bipartite movie-actor network extracted from IMDB. Nodes are movies
and actors, and an edge denotes that an actor played in a movie. This is the
type of network used to calculate "Bacon numbers".
Metadata
Statistics
| Size | n = | 1,199,919
|
| Left size | n1 = | 303,617
|
| Right size | n2 = | 896,302
|
| Volume | m = | 3,782,463
|
| Wedge count | s = | 146,912,845
|
| Cross count | x = | 1,240,268,542,836
|
| Square count | q = | 23,017,846
|
| 4-Tour count | T4 = | 779,360,402
|
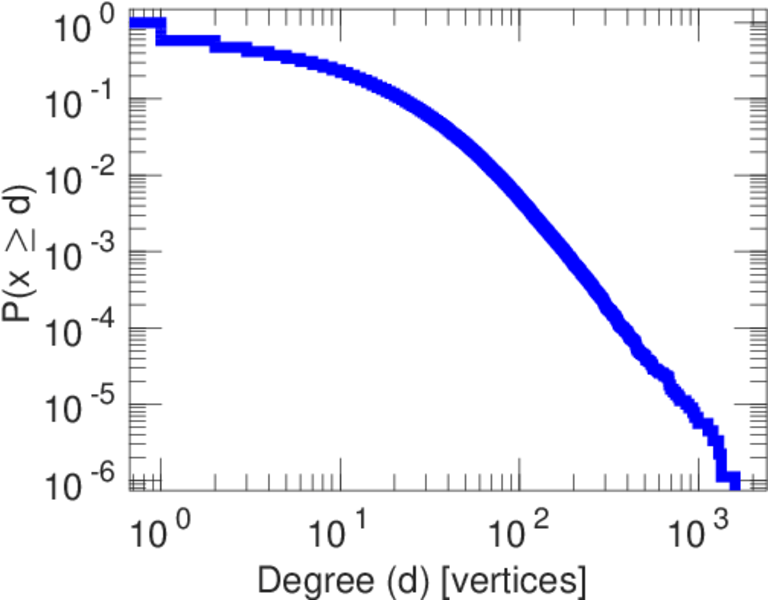
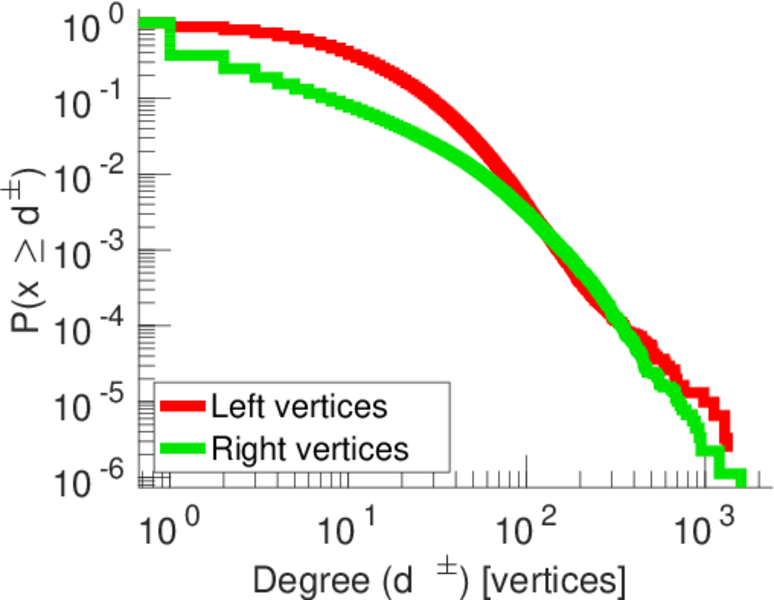
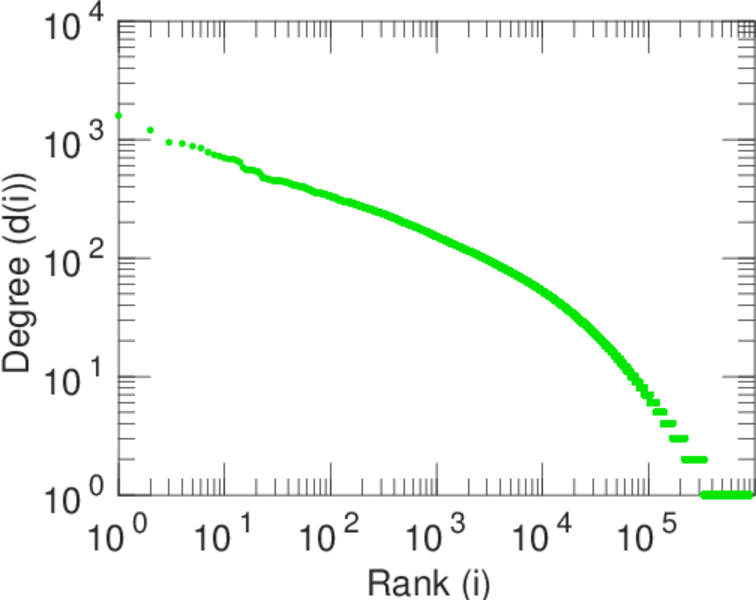
| Maximum degree | dmax = | 1,590
|
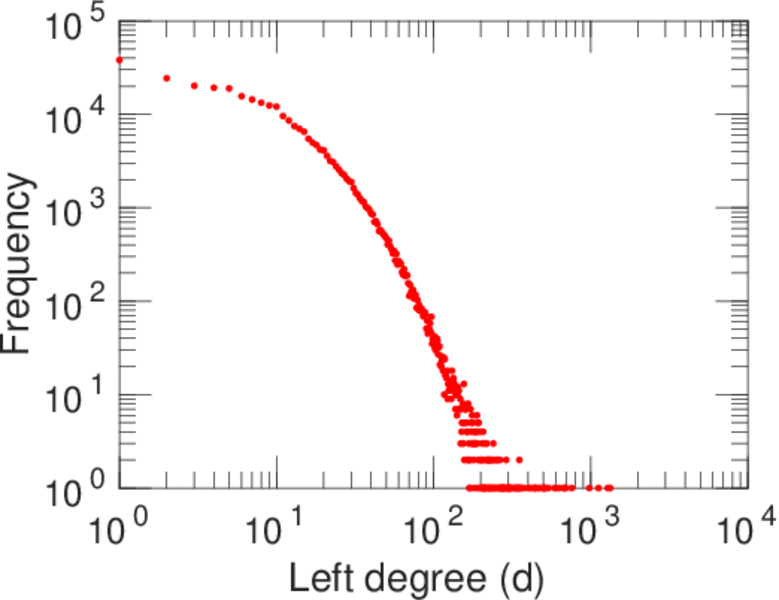
| Maximum left degree | d1max = | 1,334
|
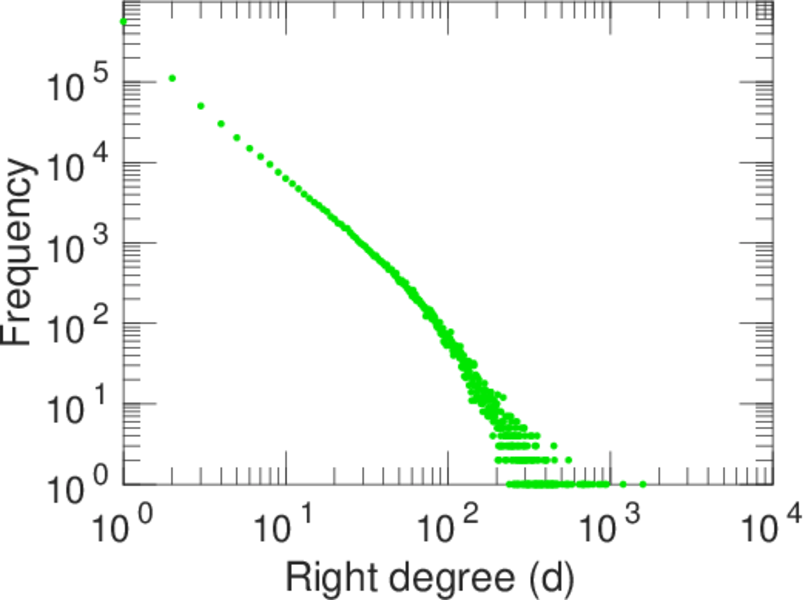
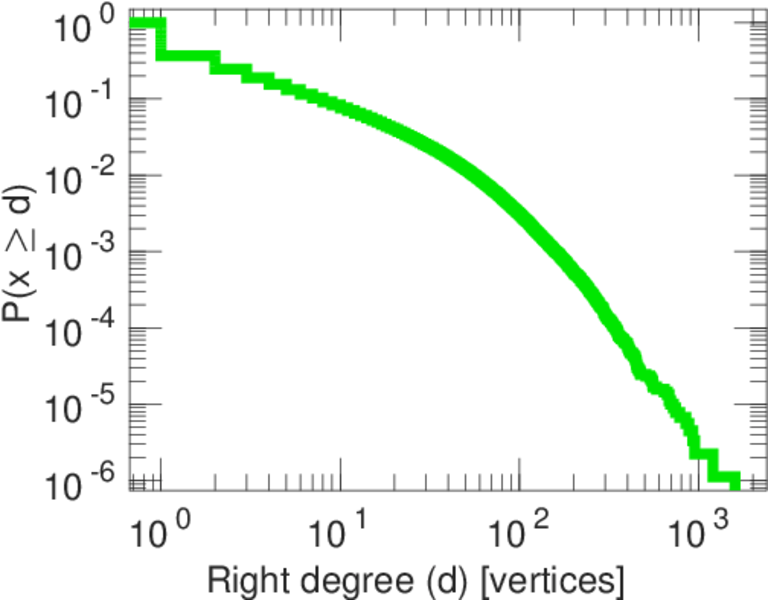
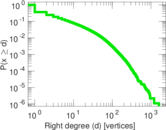
| Maximum right degree | d2max = | 1,590
|
| Average degree | d = | 6.304 53
|
| Average left degree | d1 = | 12.458 0
|
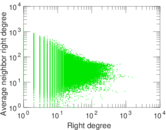
| Average right degree | d2 = | 4.220 08
|
| Fill | p = | 1.389 93 × 10−5
|
| Size of LCC | N = | 1,169,724
|
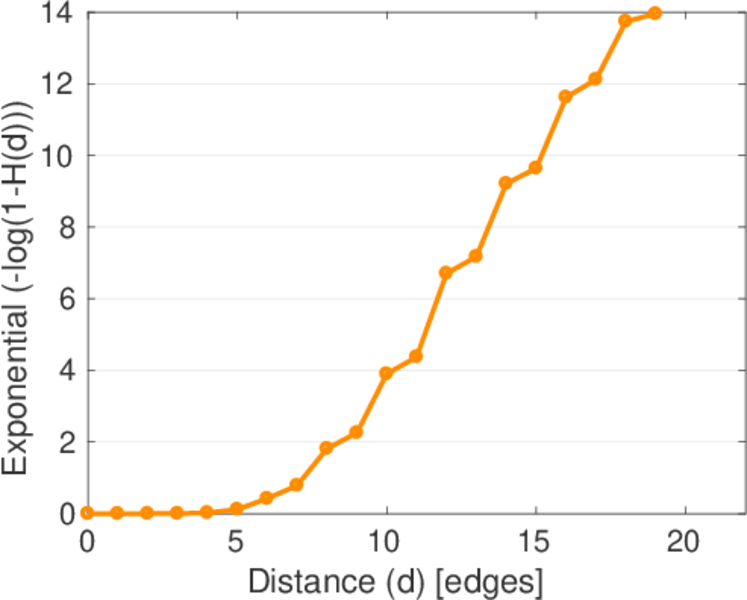
| Diameter | δ = | 26
|
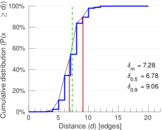
| 50-Percentile effective diameter | δ0.5 = | 6.781 67
|
| 90-Percentile effective diameter | δ0.9 = | 9.060 29
|
| Median distance | δM = | 7
|
| Mean distance | δm = | 7.278 52
|
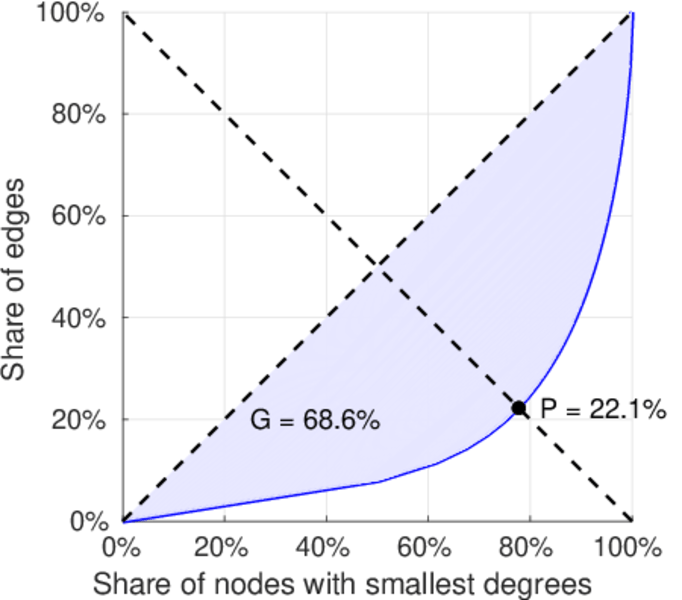
| Gini coefficient | G = | 0.681 950
|
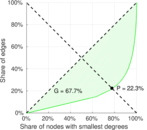
| Balanced inequality ratio | P = | 0.227 760
|
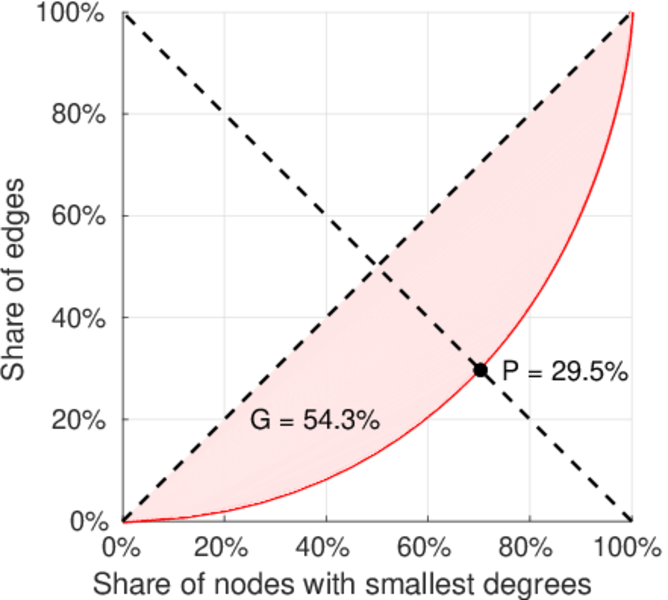
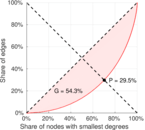
| Left balanced inequality ratio | P1 = | 0.295 251
|
| Right balanced inequality ratio | P2 = | 0.222 526
|
| Relative edge distribution entropy | Her = | 0.927 764
|
| Power law exponent | γ = | 2.076 49
|
| Tail power law exponent | γt = | 3.401 00
|
| Tail power law exponent with p | γ3 = | 3.401 00
|
| p-value | p = | 0.000 00
|
| Left tail power law exponent with p | γ3,1 = | 3.921 00
|
| Left p-value | p1 = | 0.000 00
|
| Right tail power law exponent with p | γ3,2 = | 1.871 00
|
| Right p-value | p2 = | 0.000 00
|
| Degree assortativity | ρ = | −0.051 365 3
|
| Degree assortativity p-value | pρ = | 0.000 00
|
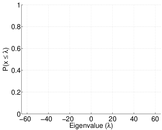
| Spectral norm | α = | 65.227 0
|
| Controllability | C = | 702,995
|
| Relative controllability | Cr = | 0.585 869
|
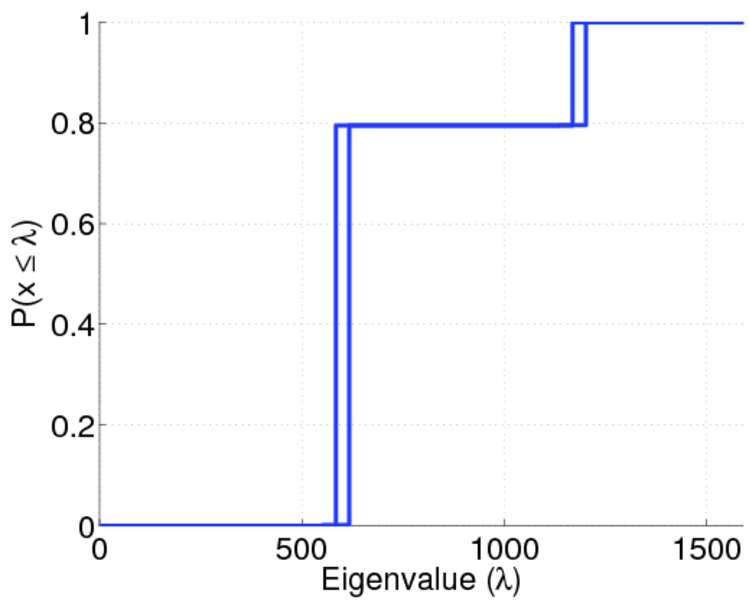
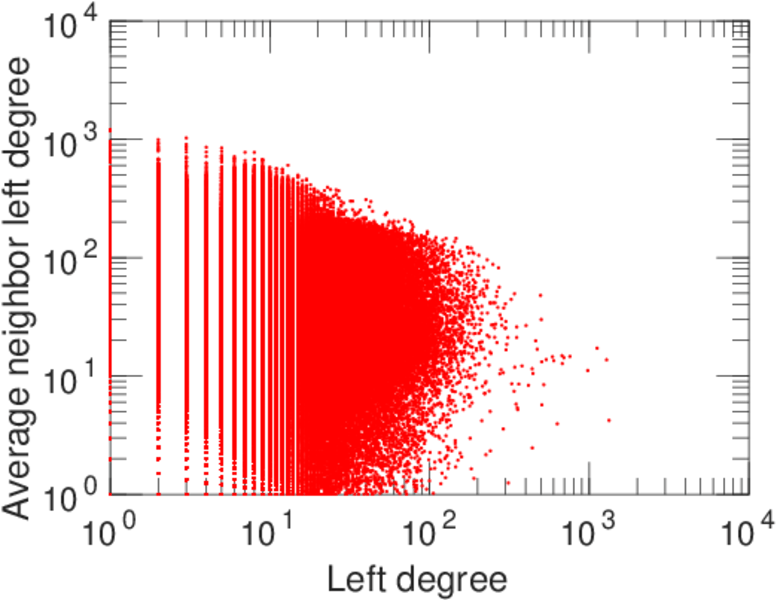
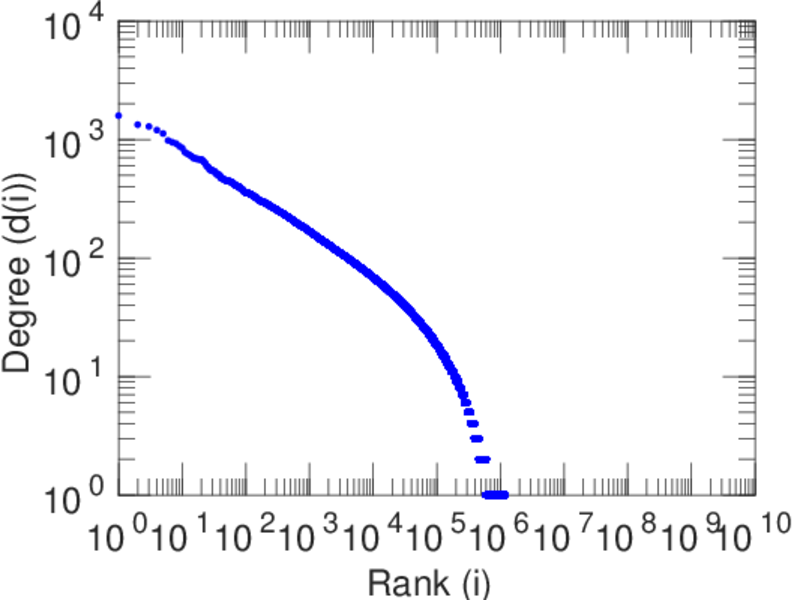
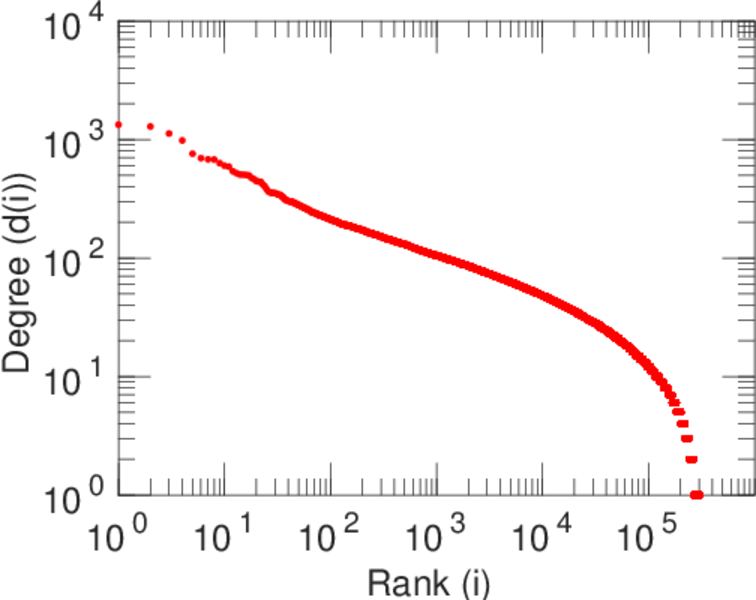
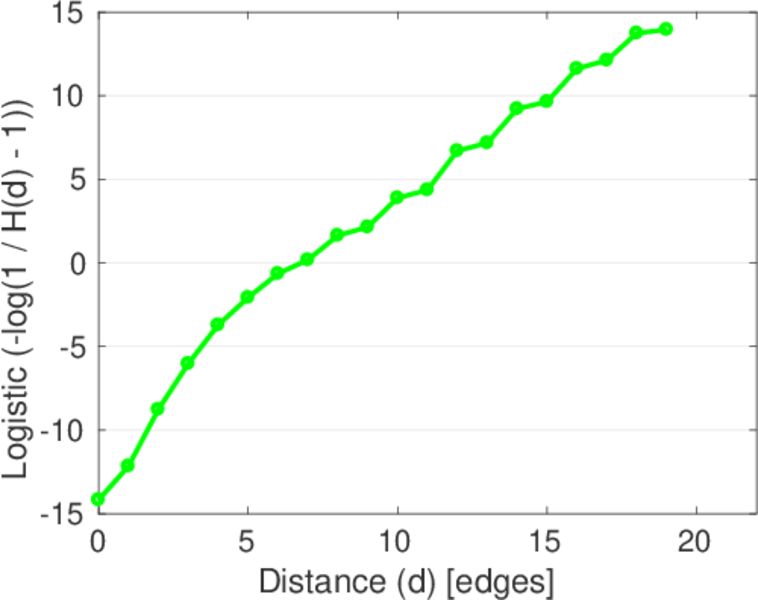
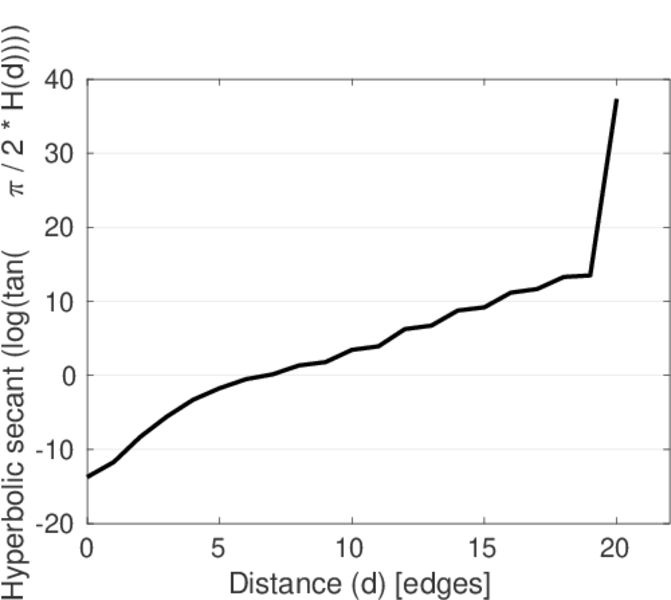
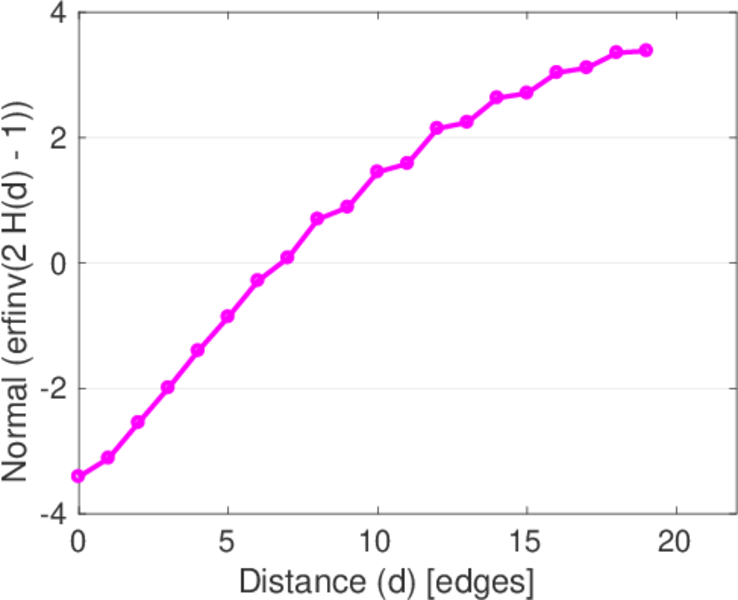
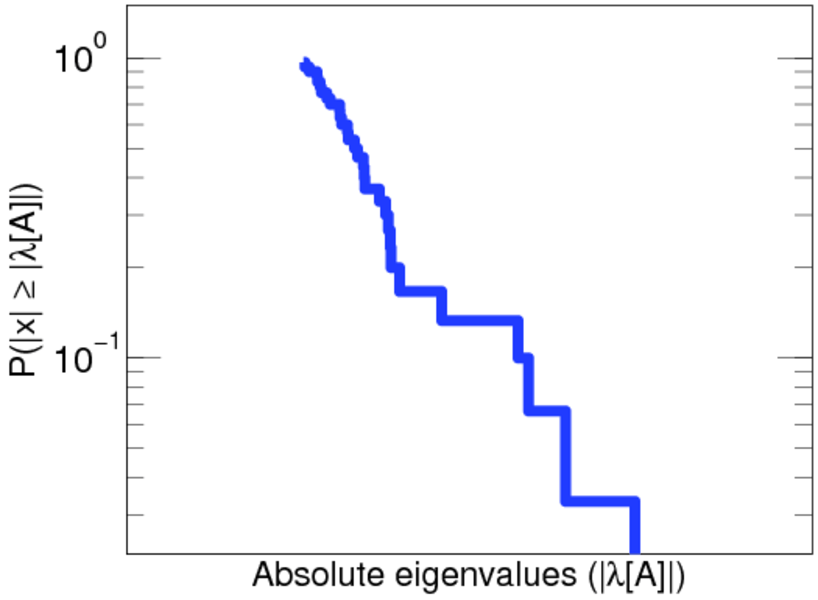
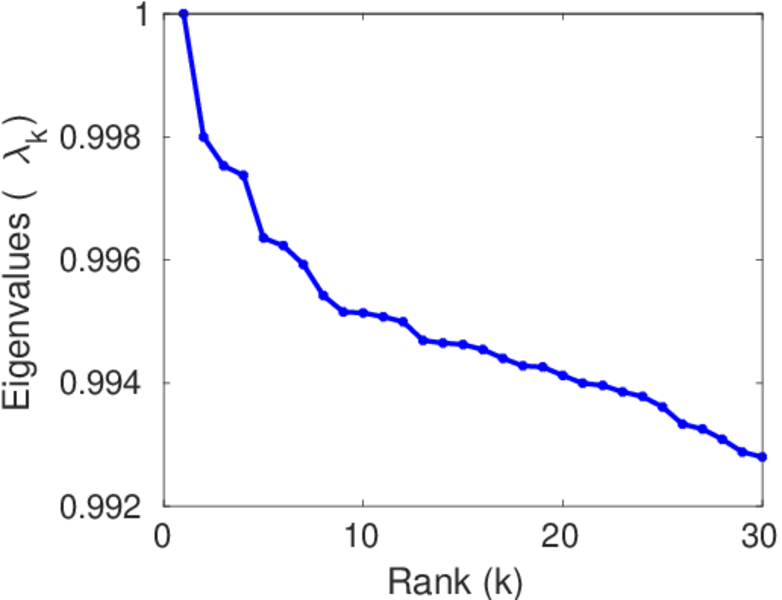
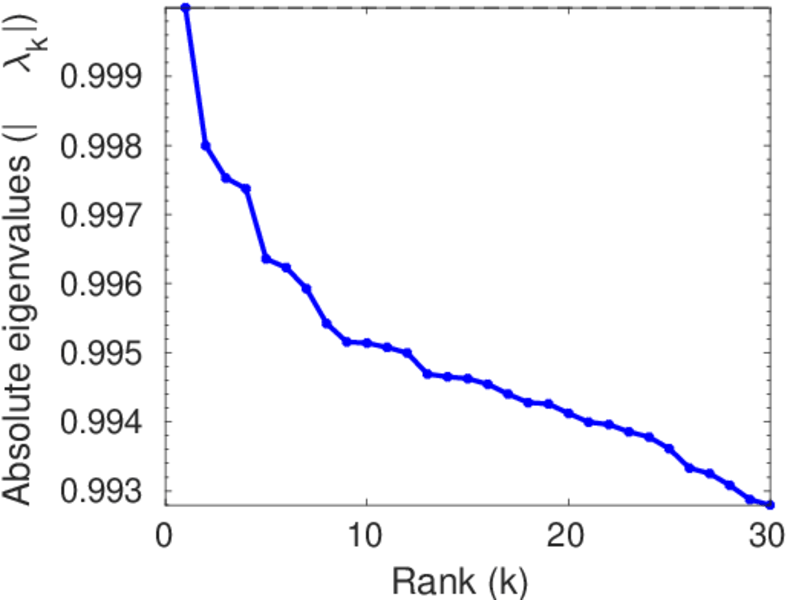
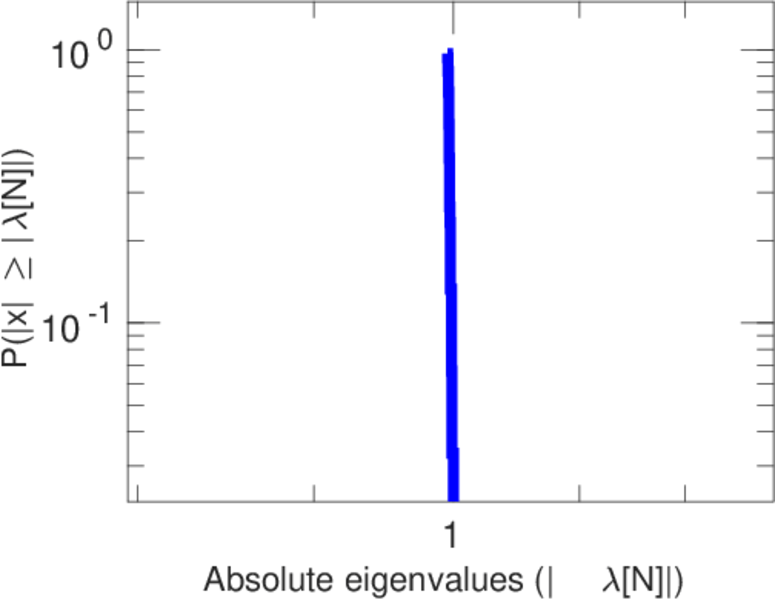
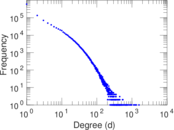
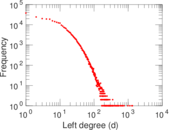
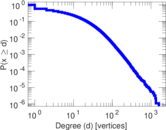
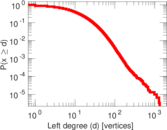
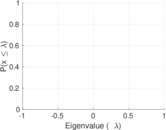
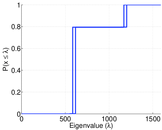
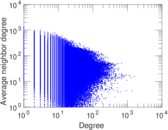
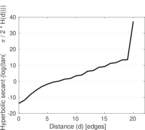
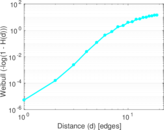
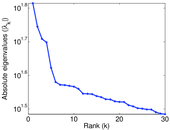
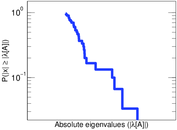
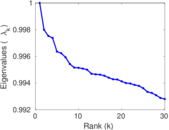
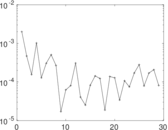
Plots


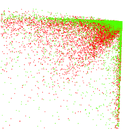


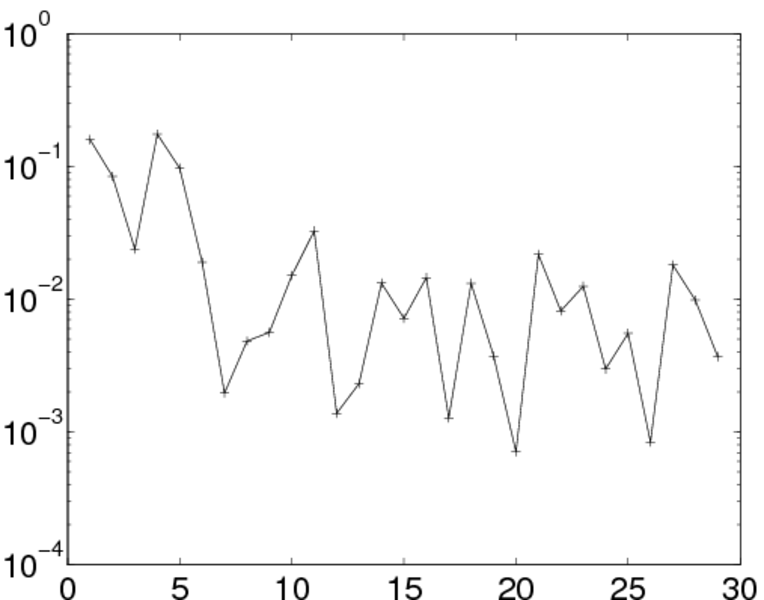
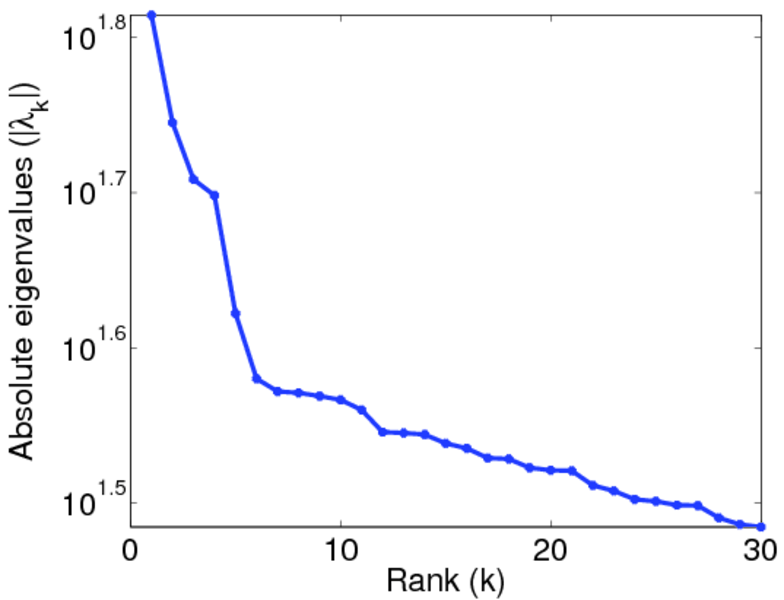
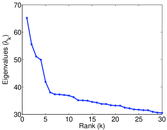
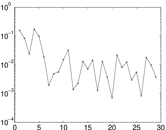
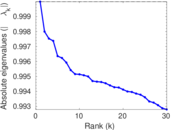
Matrix decompositions plots

Downloads
References
|
[1]
|
Jérôme Kunegis.
KONECT – The Koblenz Network Collection.
In Proc. Int. Conf. on World Wide Web Companion, pages
1343–1350, 2013.
[ http ]
|
 KONECT ‣ Networks ‣
Buy Me a Coffee
KONECT ‣ Networks ‣
Buy Me a Coffee