U. Rovira i Virgili
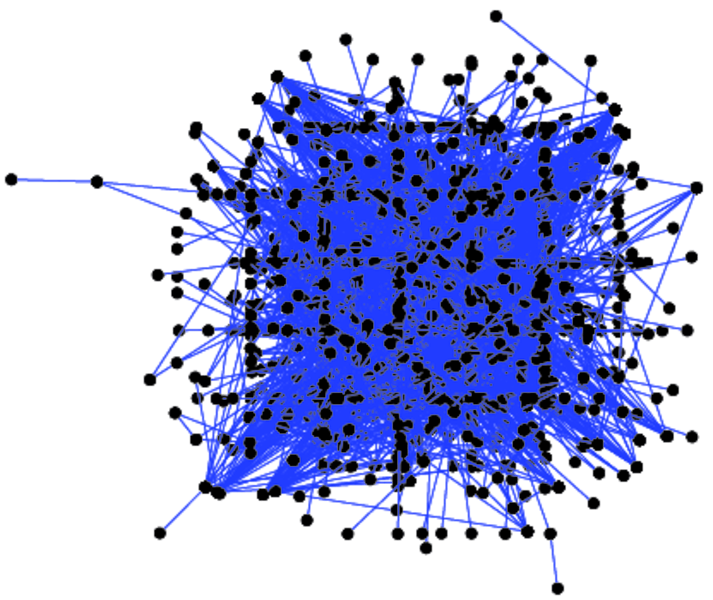
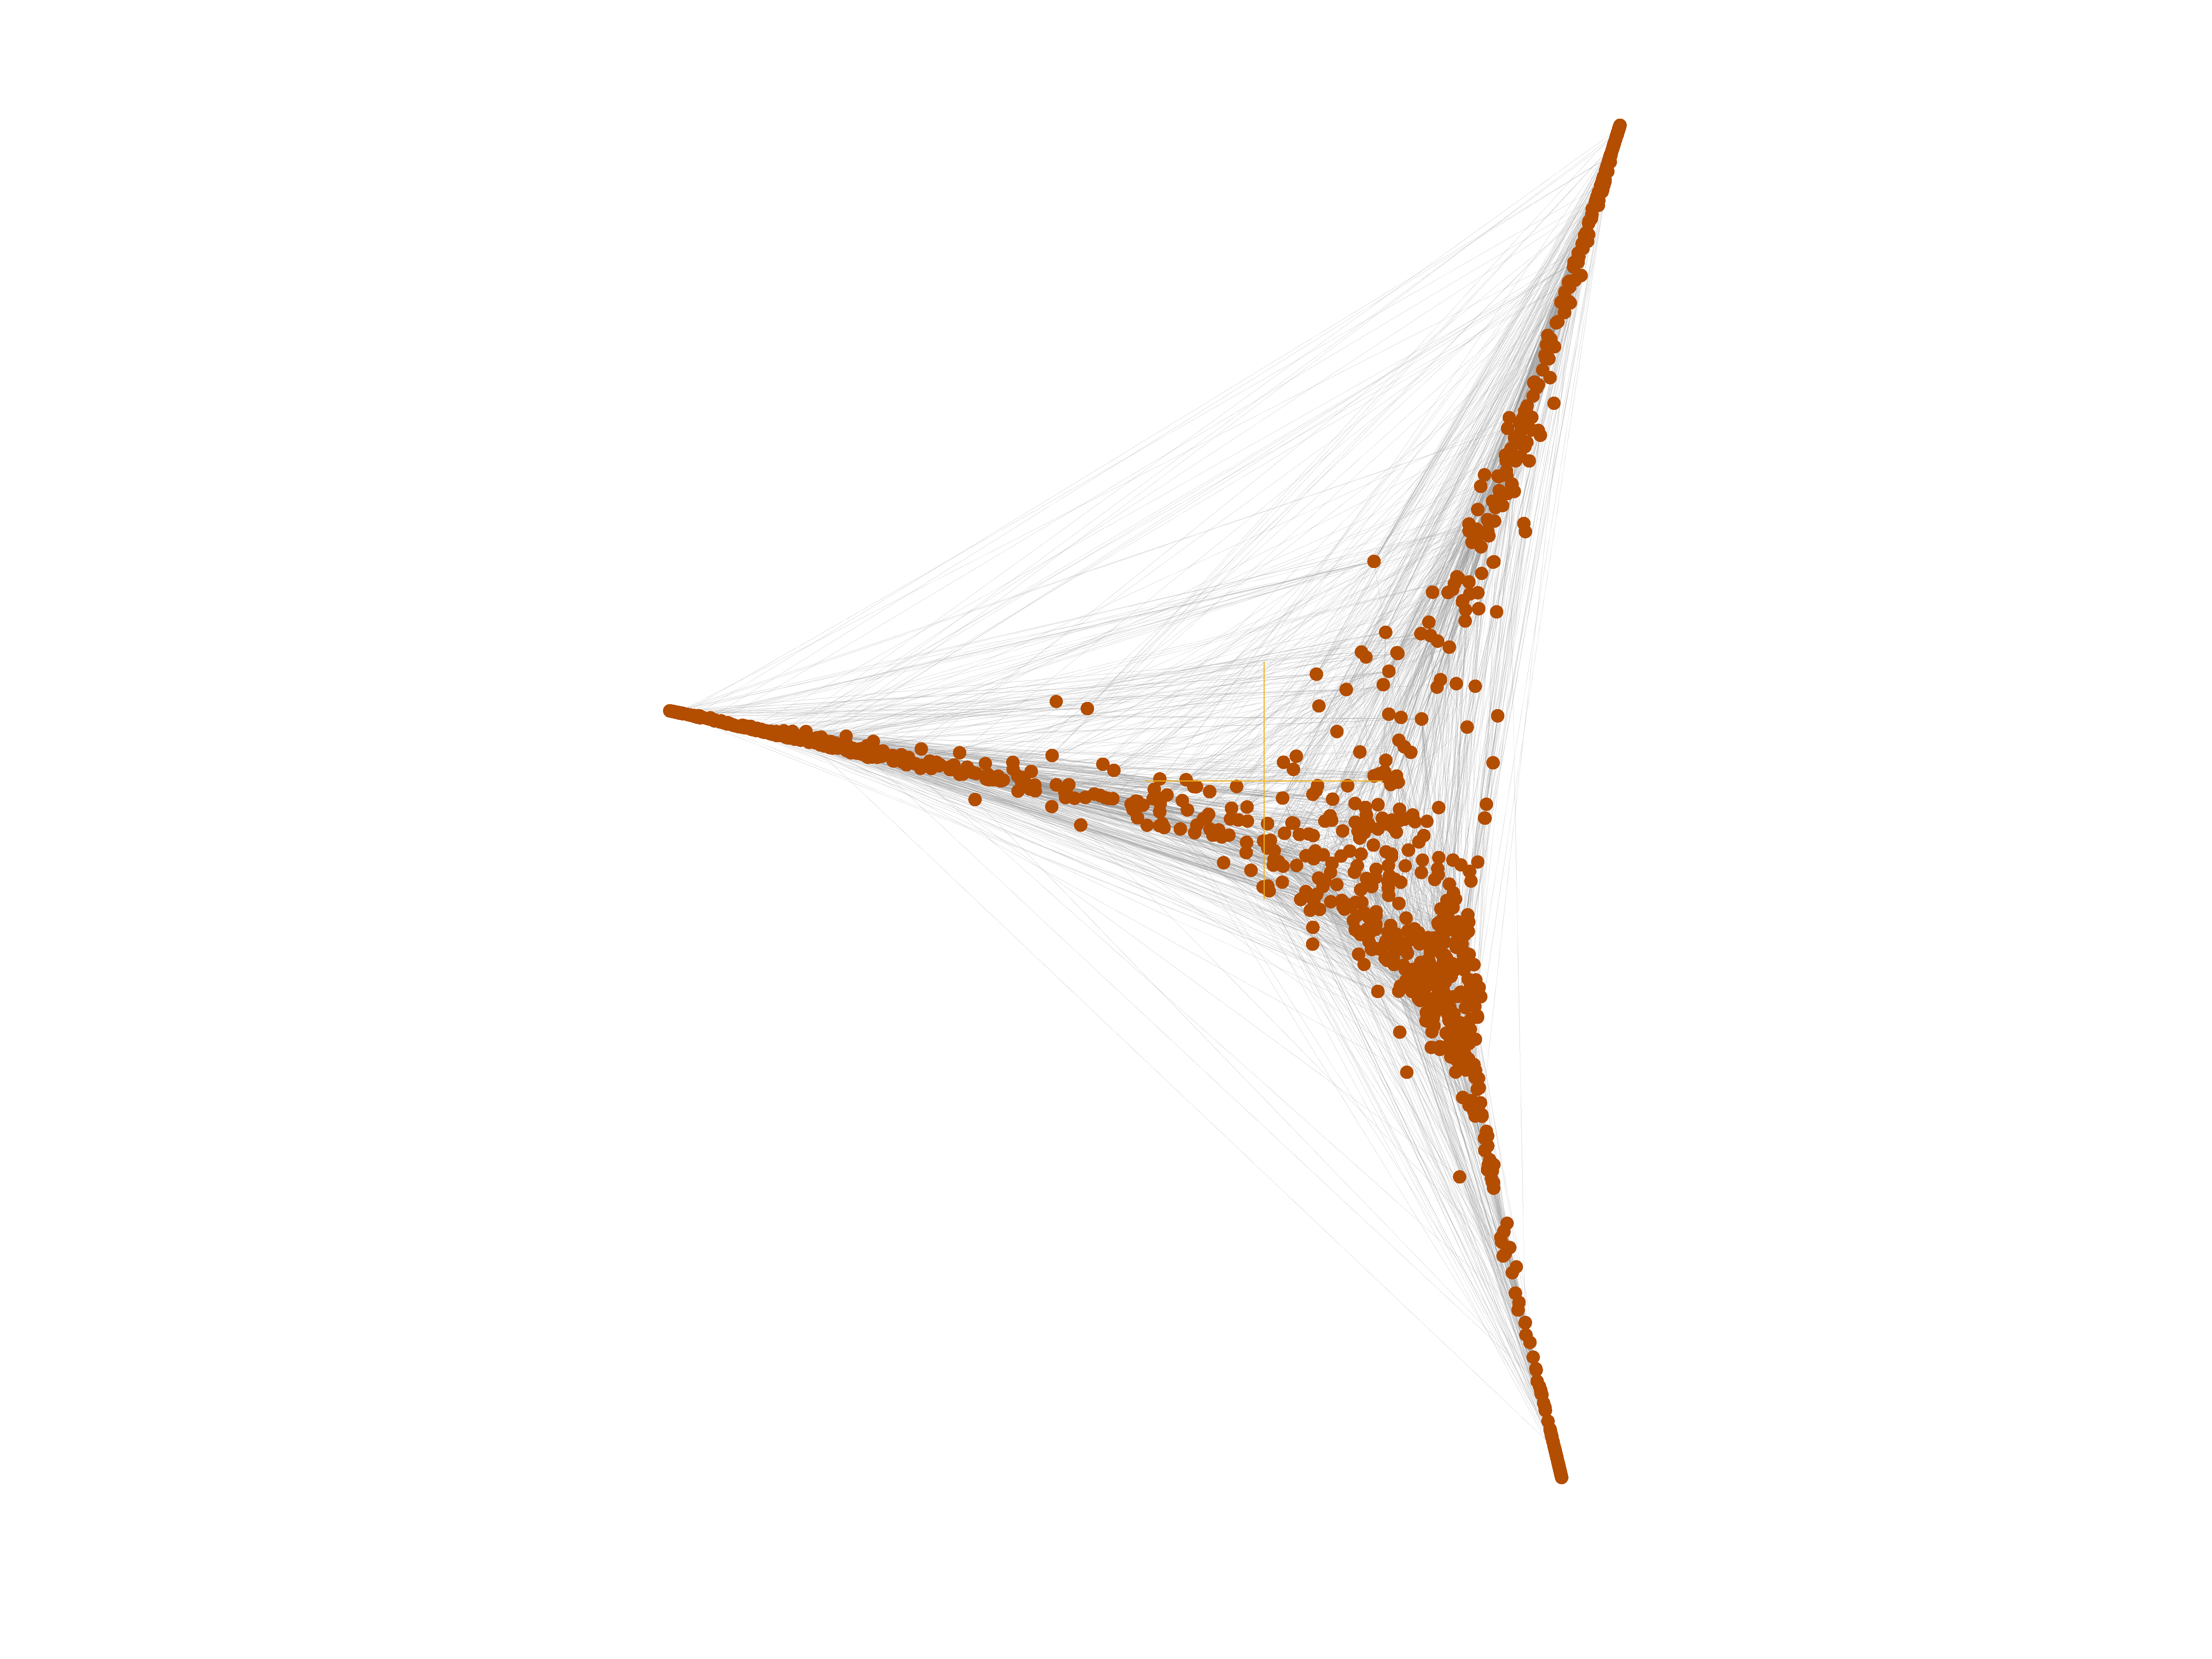
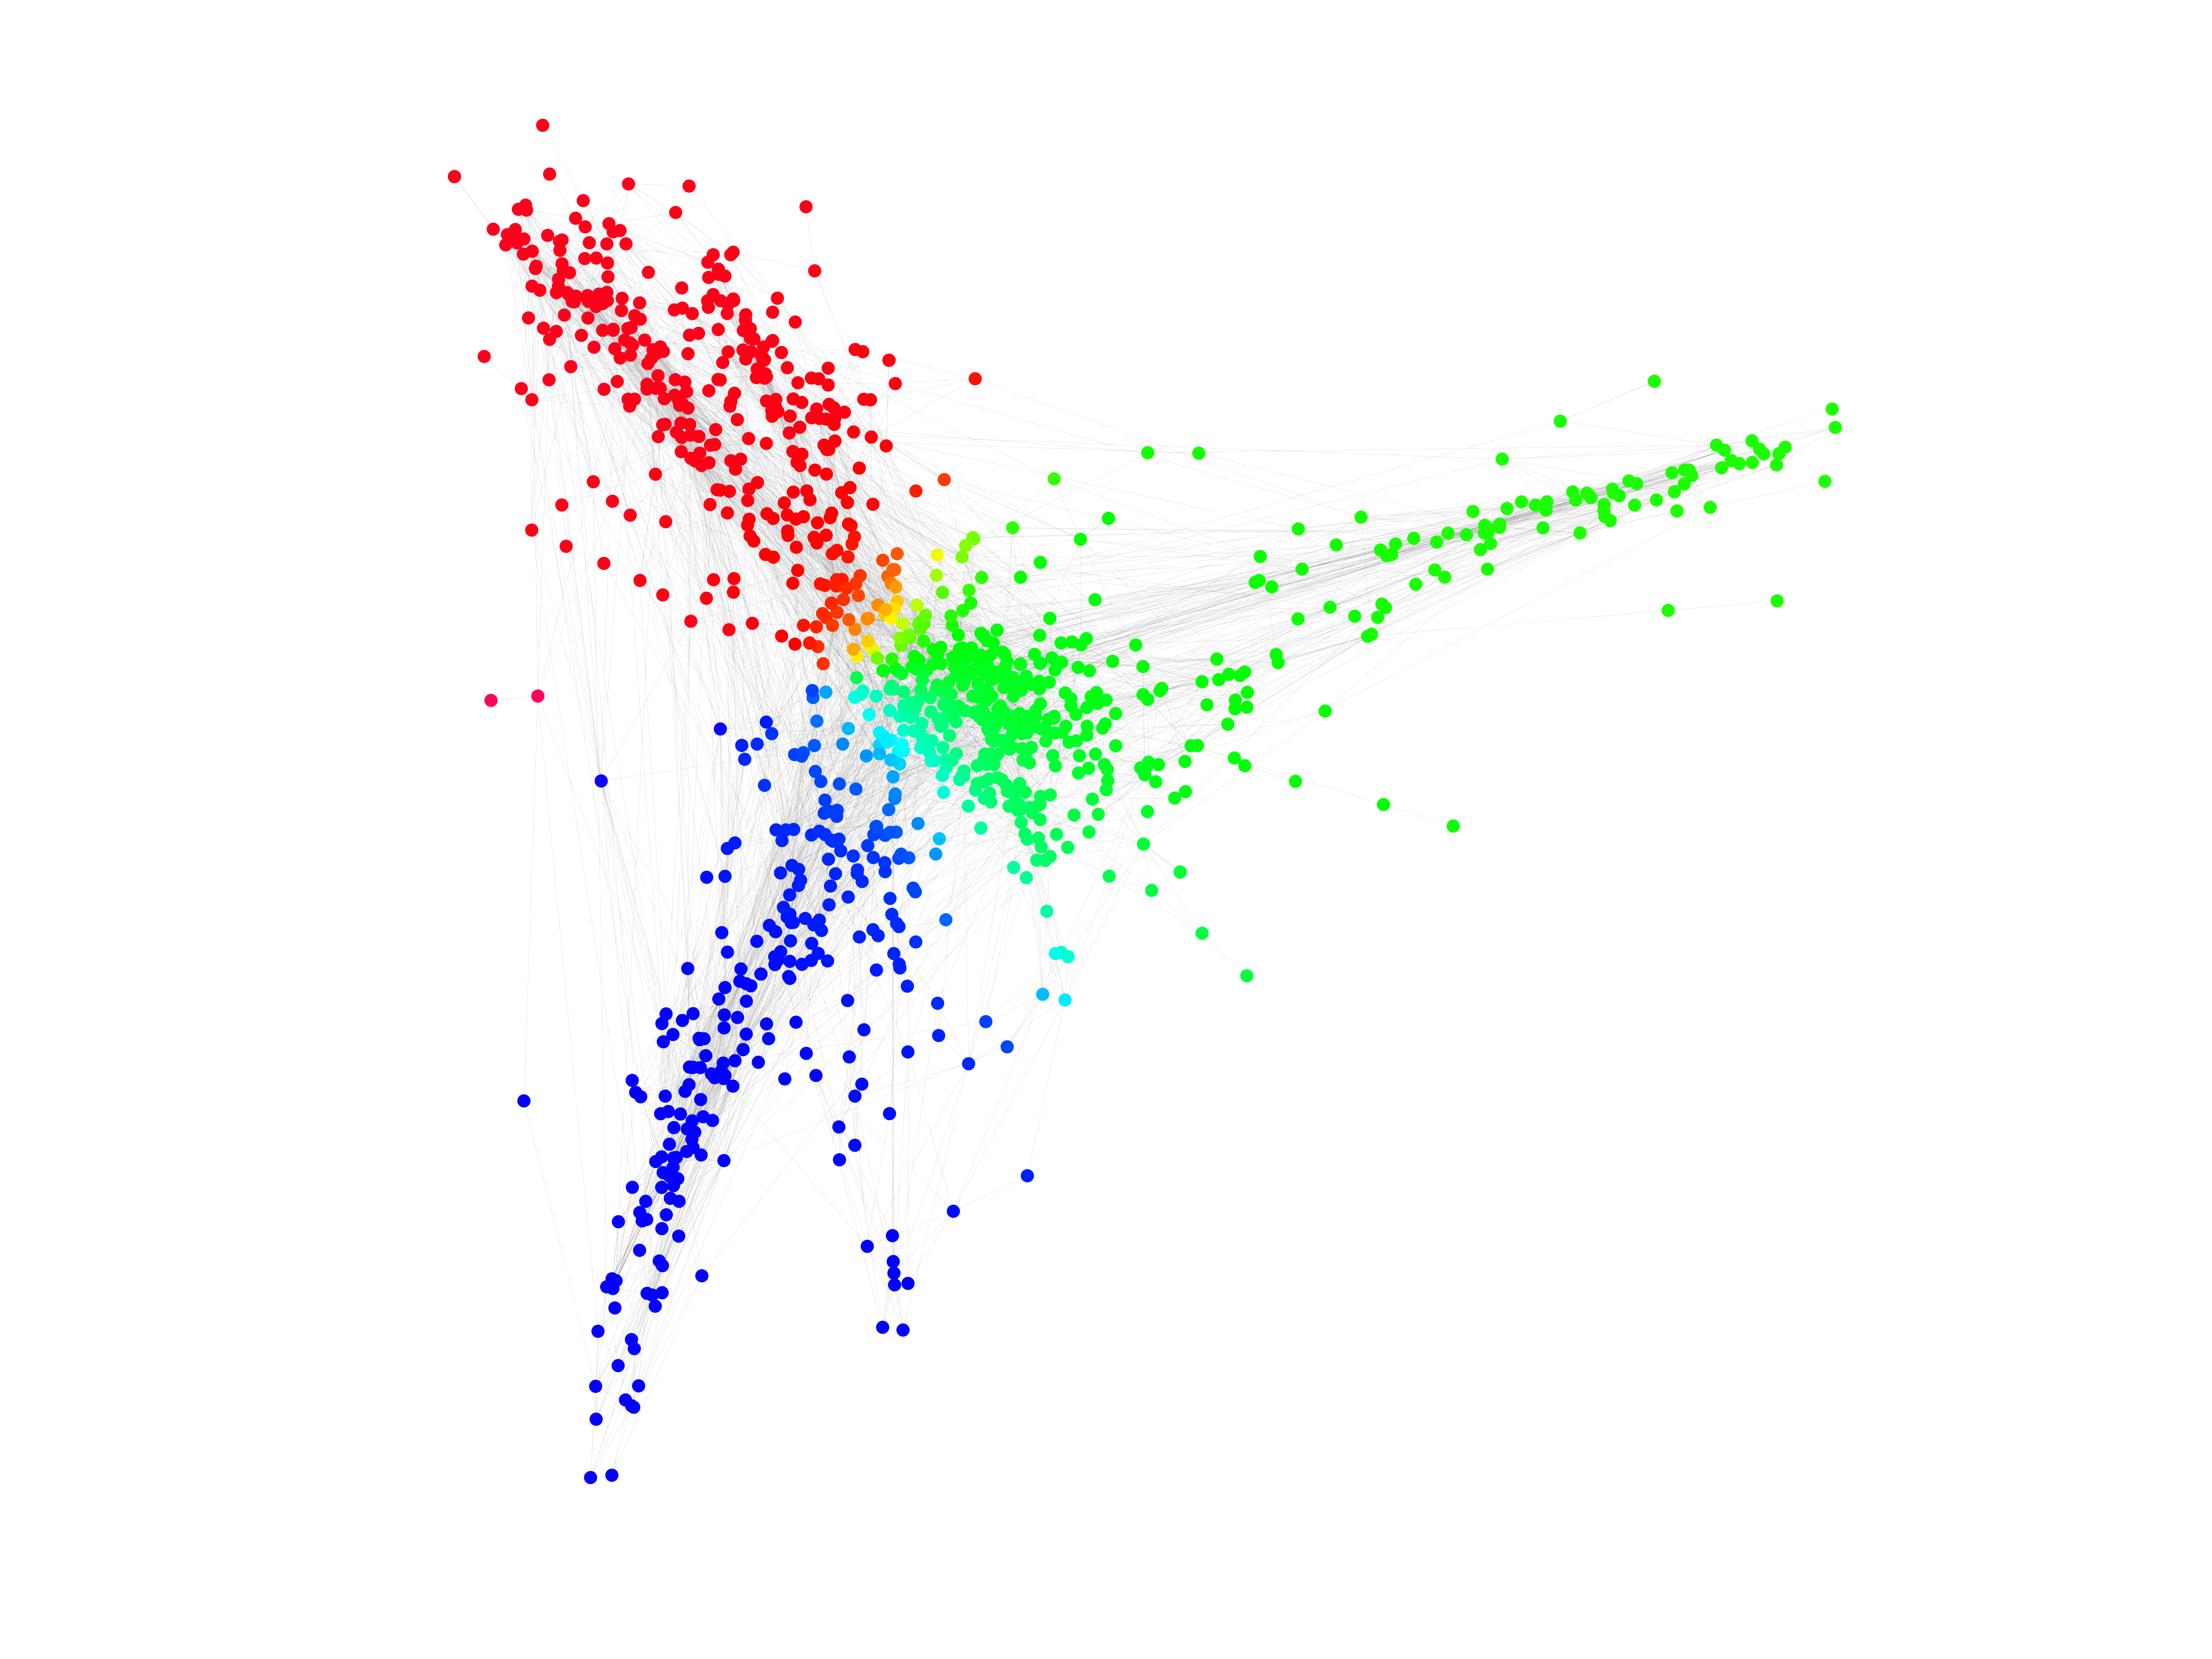
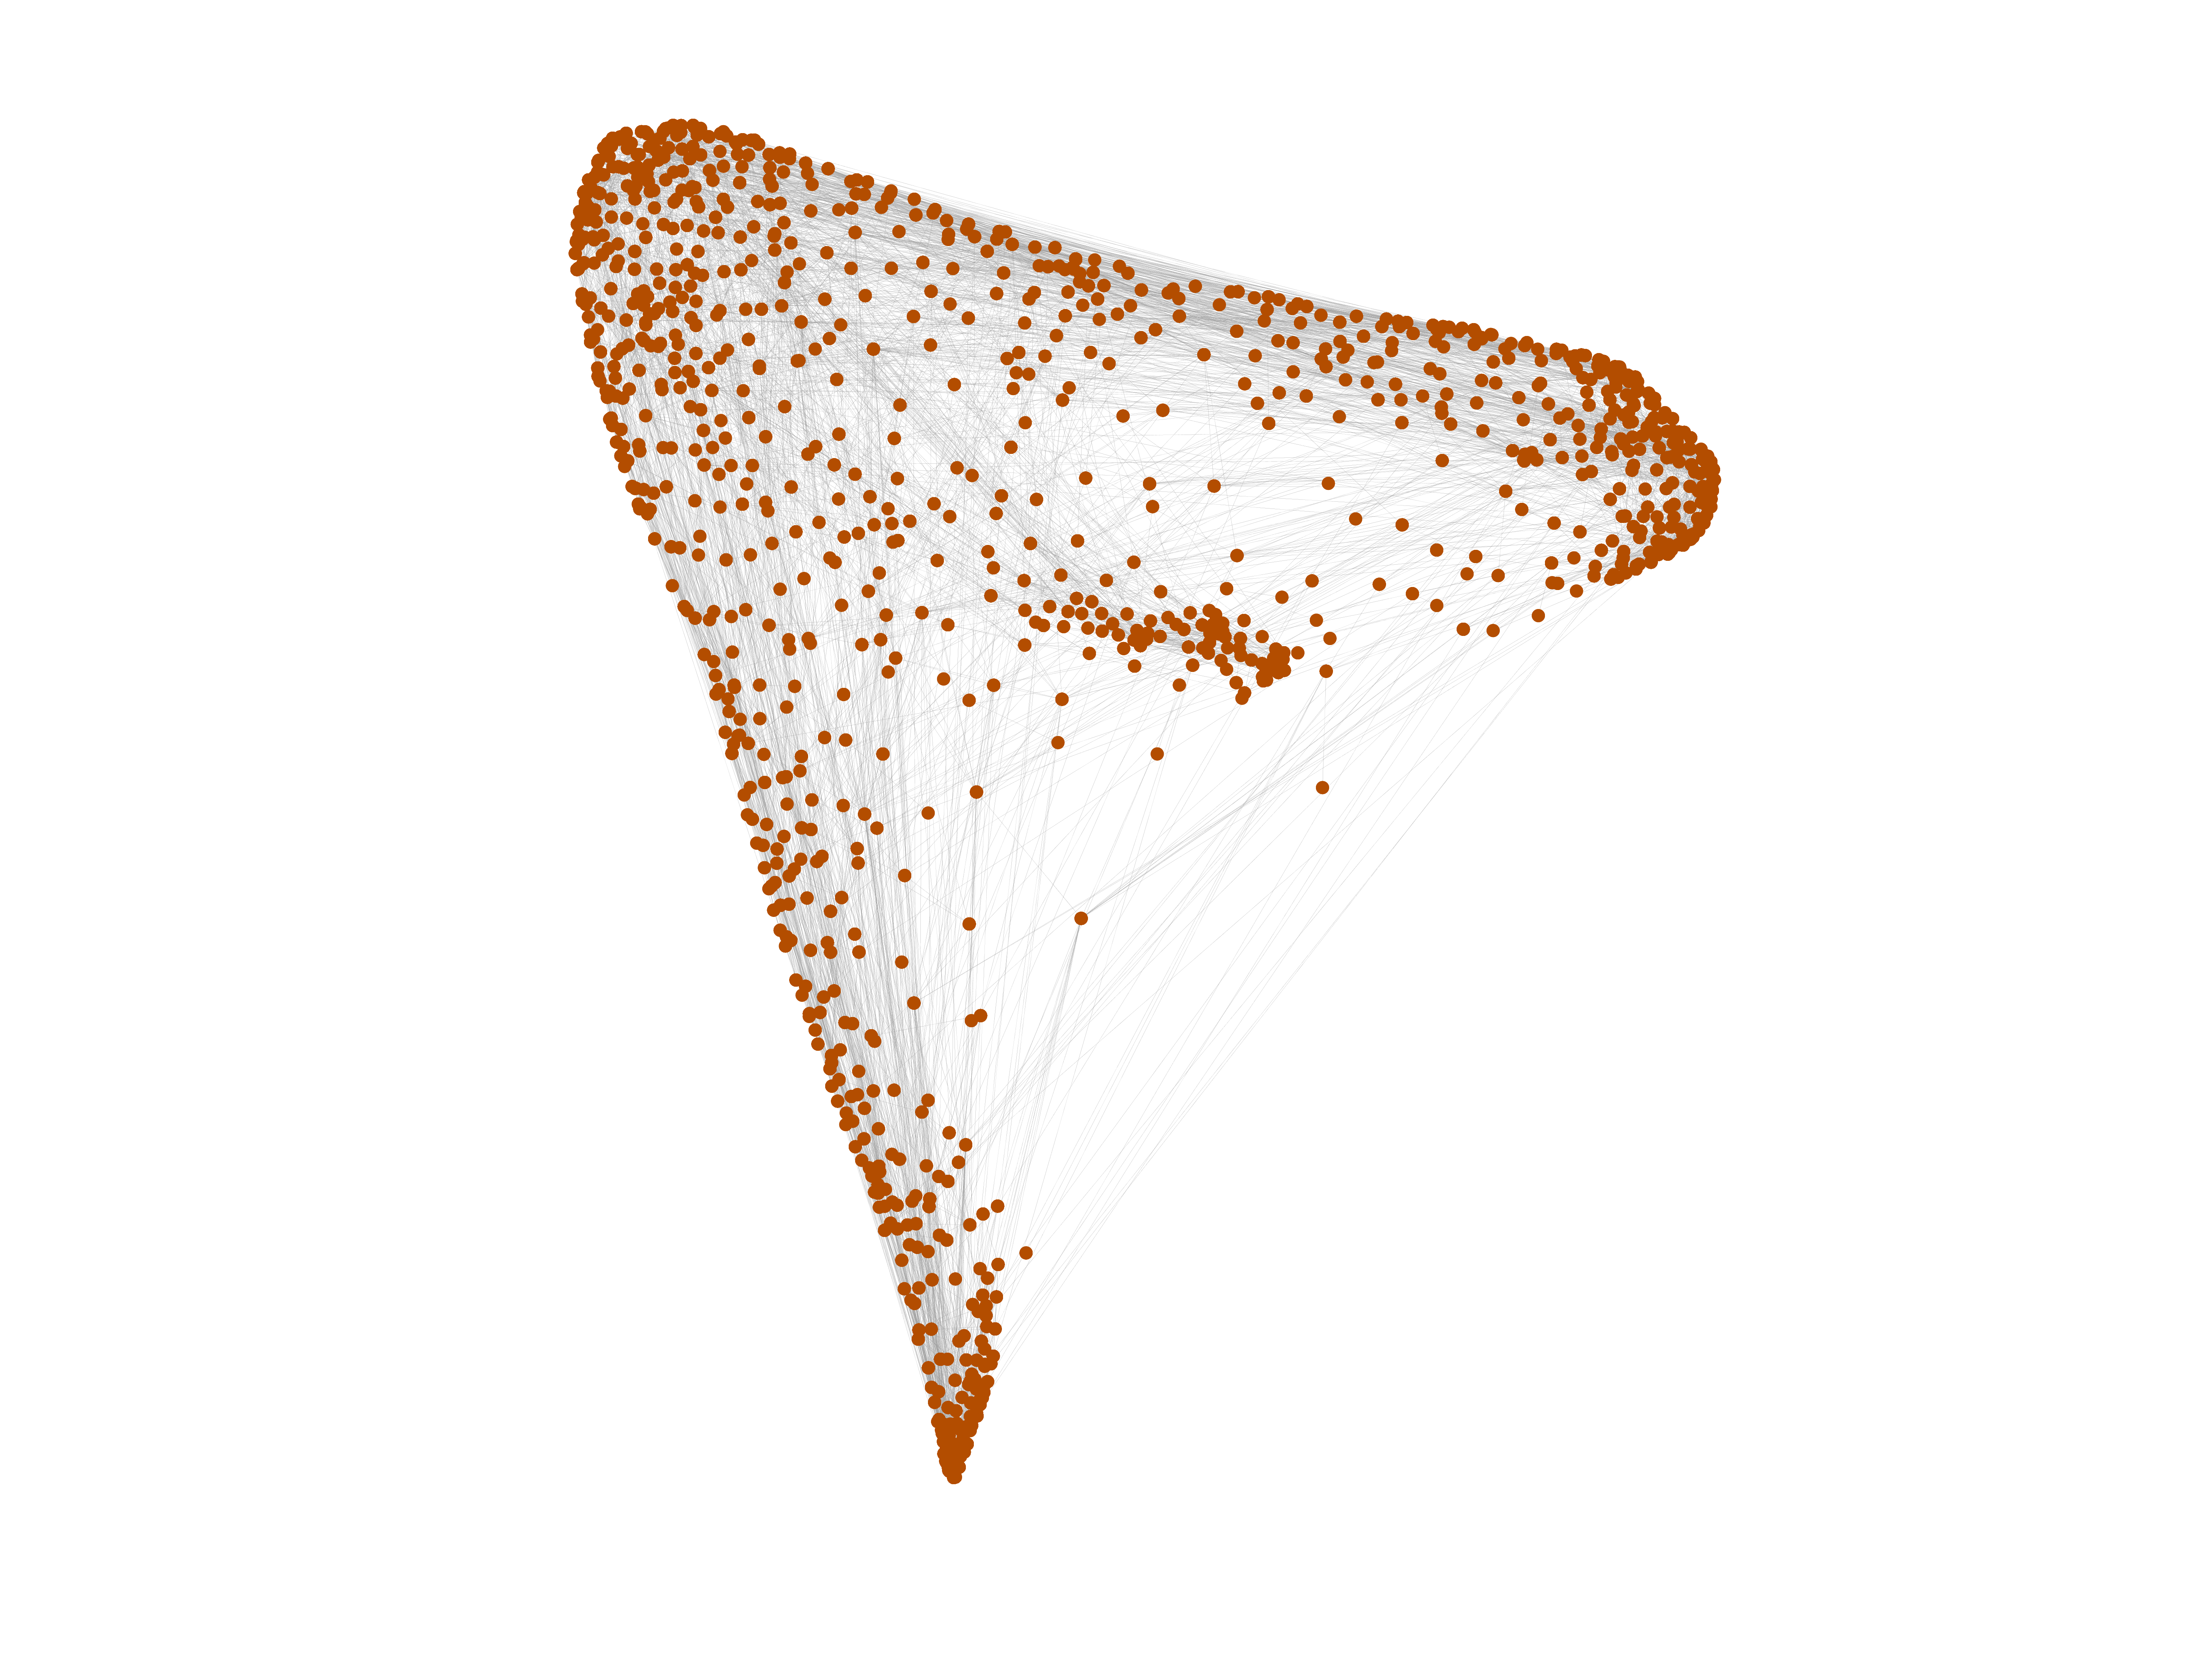
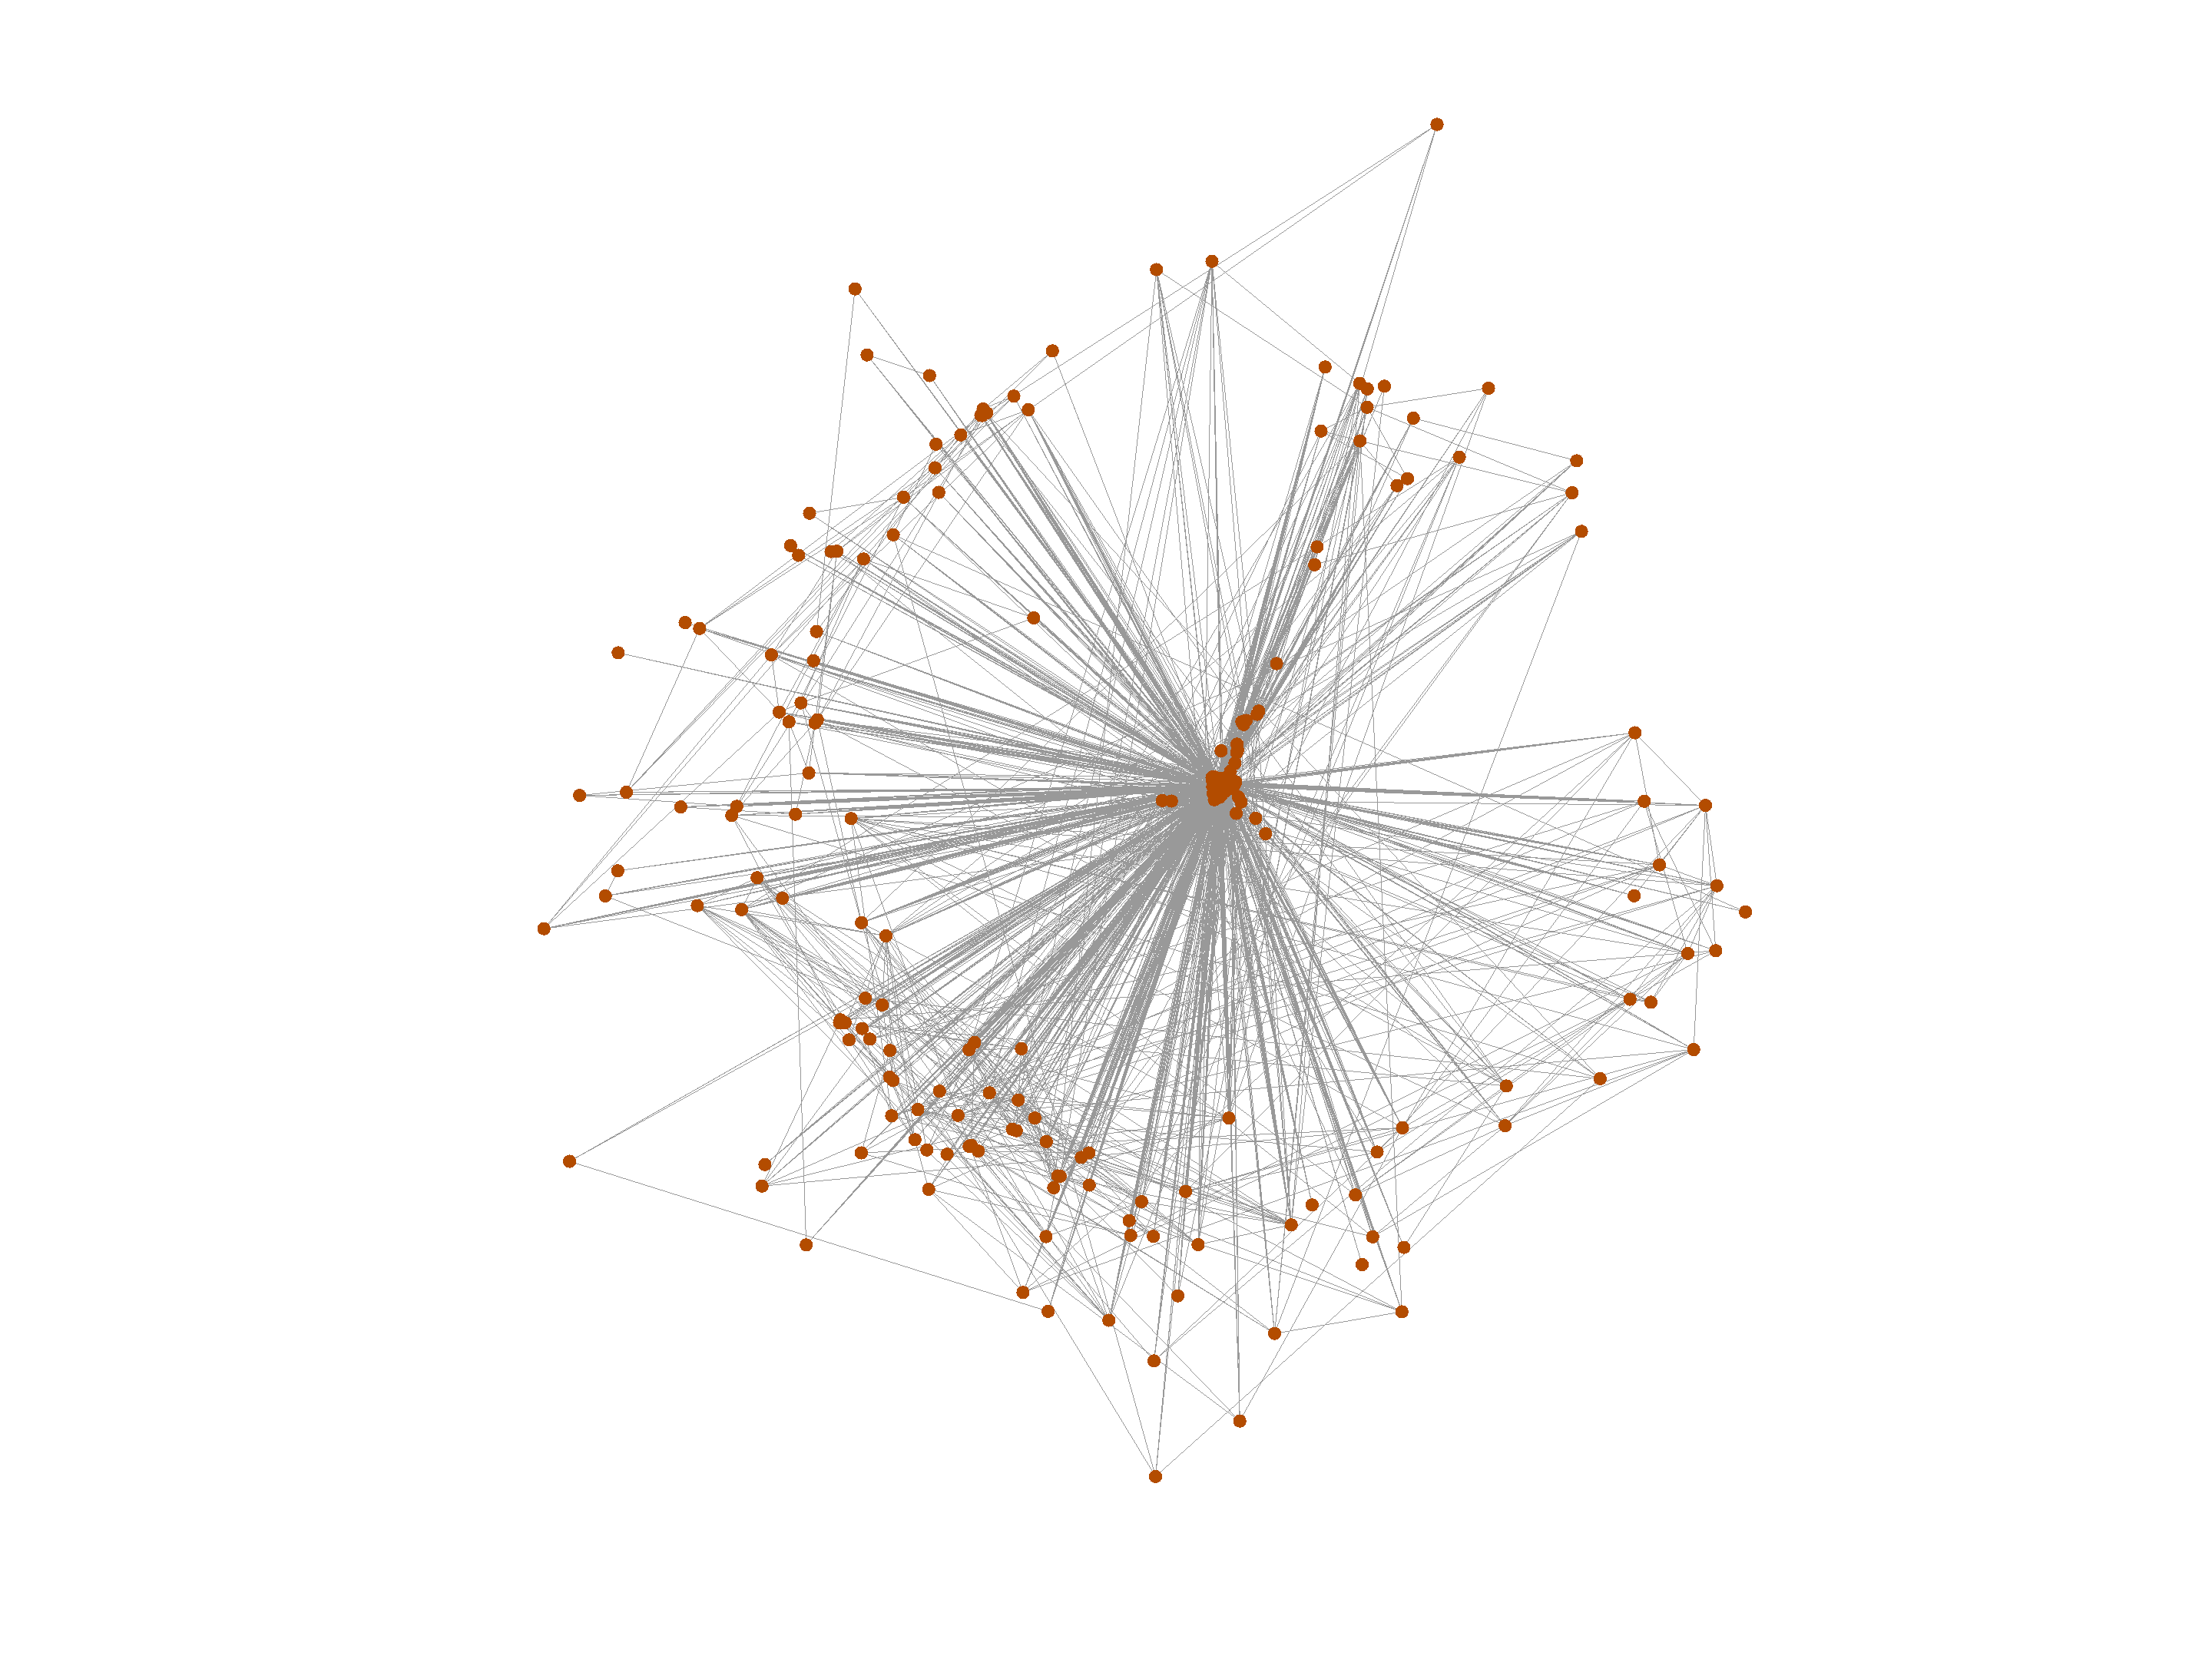
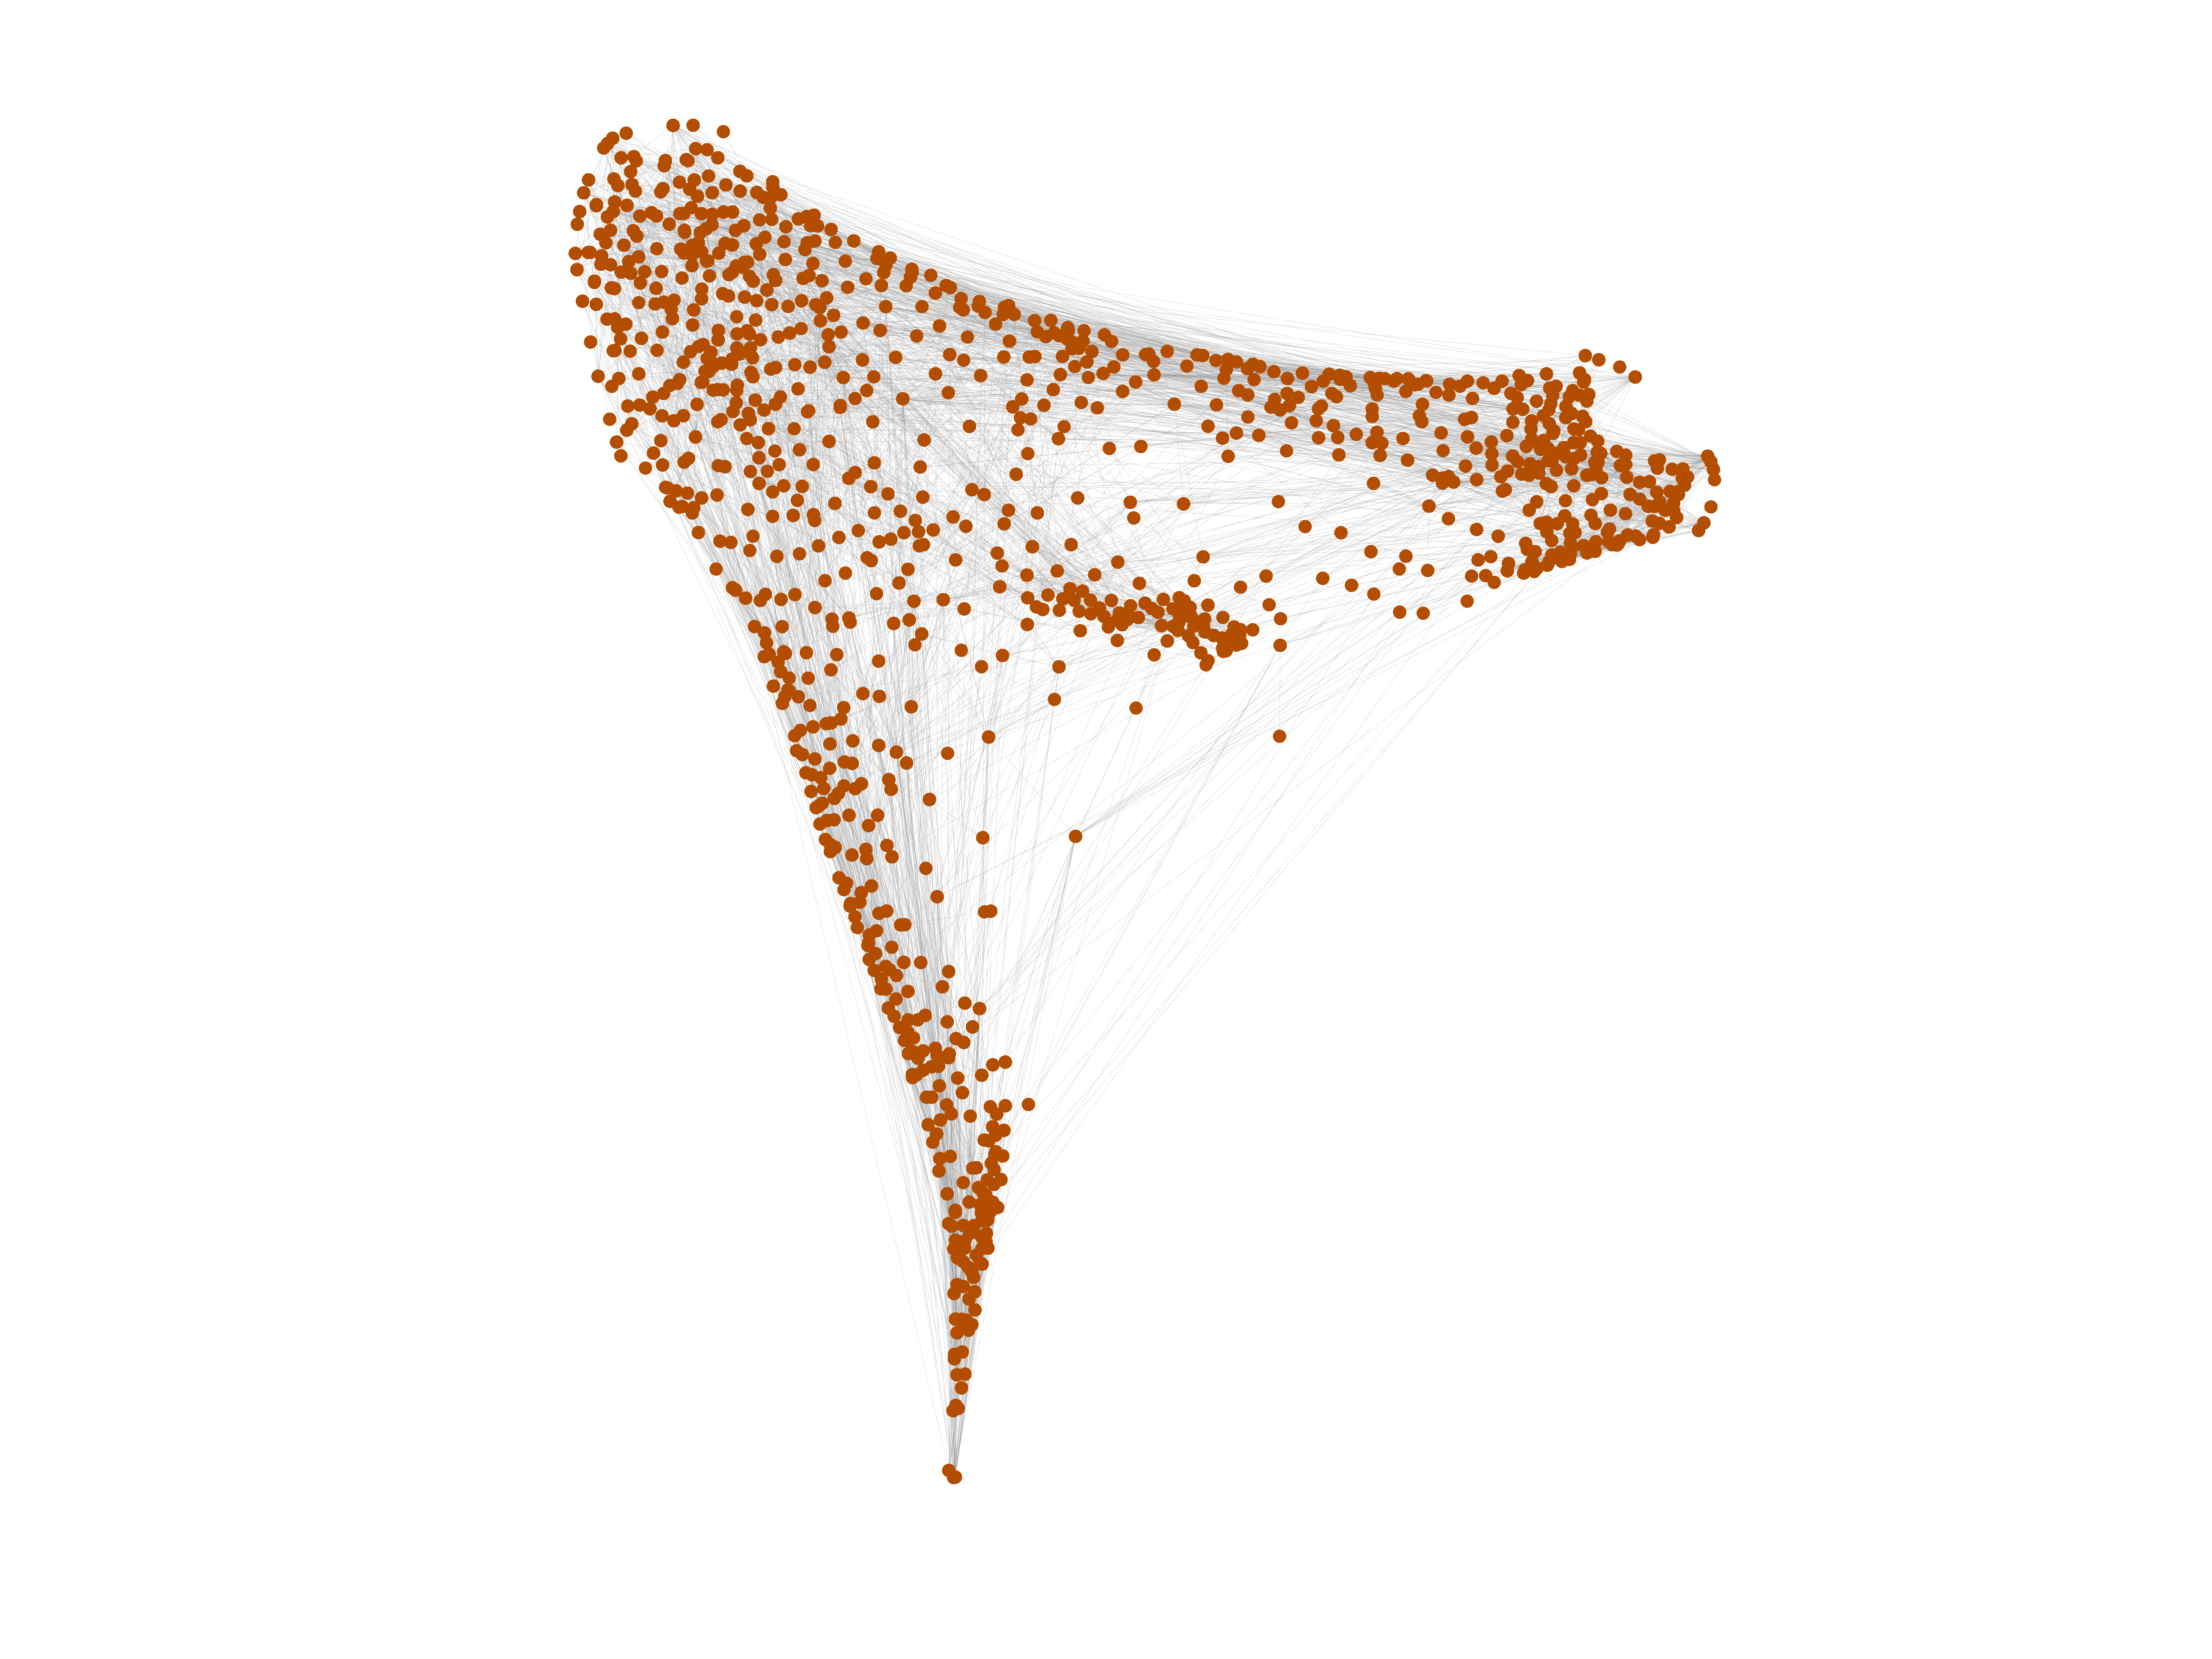
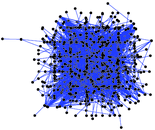
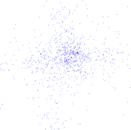
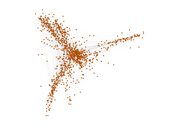
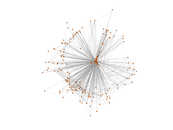
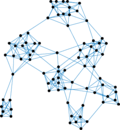
This is the email communication network at the University Rovira i Virgili in
Tarragona in the south of Catalonia in Spain. Nodes are users and each edge
represents that at least one email was sent. The direction of emails and the
number of emails between two persons are not stored.
Metadata
Statistics
| Size | n = | 1,133
|
| Volume | m = | 5,451
|
| Loop count | l = | 0
|
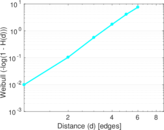
| Wedge count | s = | 96,415
|
| Claw count | z = | 817,974
|
| Cross count | x = | 6,550,542
|
| Triangle count | t = | 5,343
|
| Square count | q = | 43,591
|
| 4-Tour count | T4 = | 745,290
|
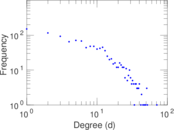
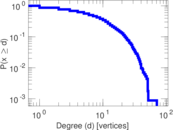
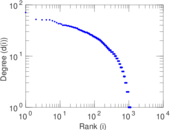
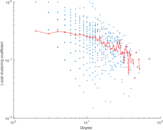
| Maximum degree | dmax = | 71
|
| Average degree | d = | 9.622 24
|
| Fill | p = | 0.008 500 21
|
| Size of LCC | N = | 1,133
|
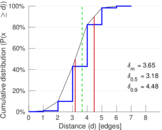
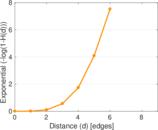
| Diameter | δ = | 8
|
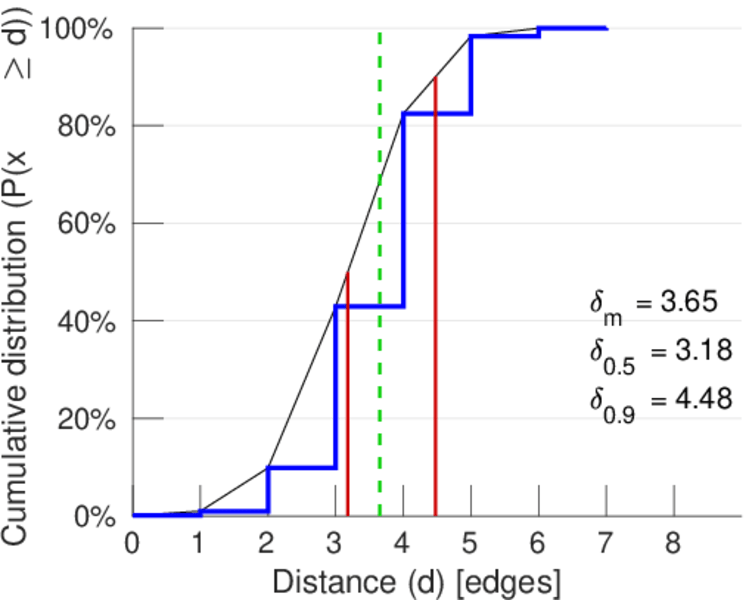
| 50-Percentile effective diameter | δ0.5 = | 3.179 35
|
| 90-Percentile effective diameter | δ0.9 = | 4.475 95
|
| Median distance | δM = | 4
|
| Mean distance | δm = | 3.654 76
|
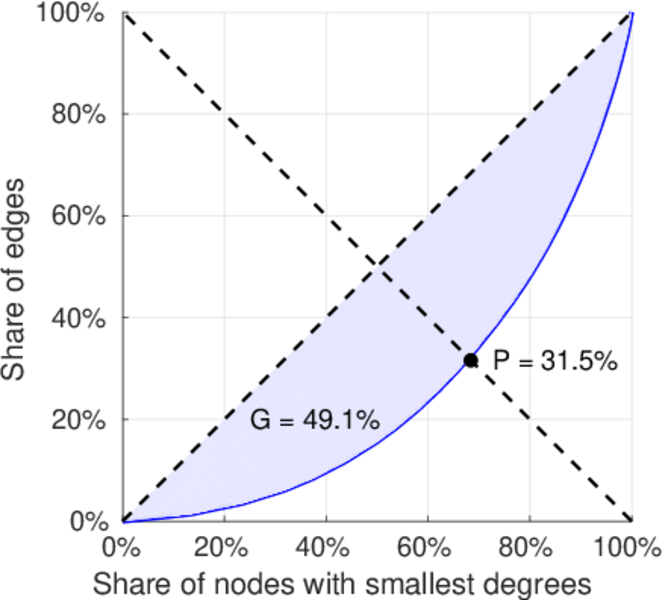
| Gini coefficient | G = | 0.491 113
|
| Balanced inequality ratio | P = | 0.314 529
|
| Relative edge distribution entropy | Her = | 0.942 894
|
| Power law exponent | γ = | 1.561 09
|
| Tail power law exponent | γt = | 6.771 00
|
| Tail power law exponent with p | γ3 = | 6.771 00
|
| p-value | p = | 0.752 000
|
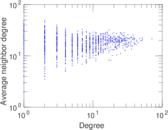
| Degree assortativity | ρ = | +0.078 201 0
|
| Degree assortativity p-value | pρ = | 2.915 87 × 10−16
|
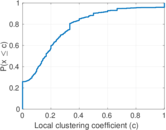
| Clustering coefficient | c = | 0.166 250
|
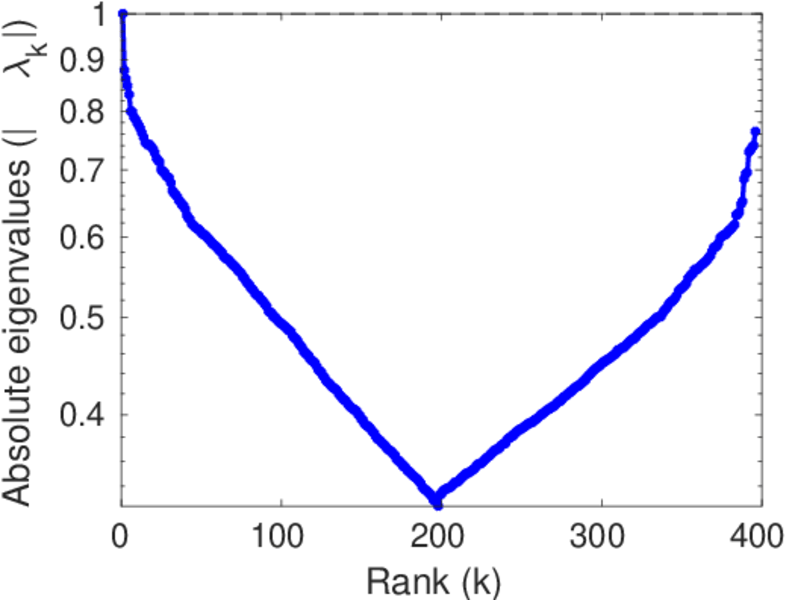
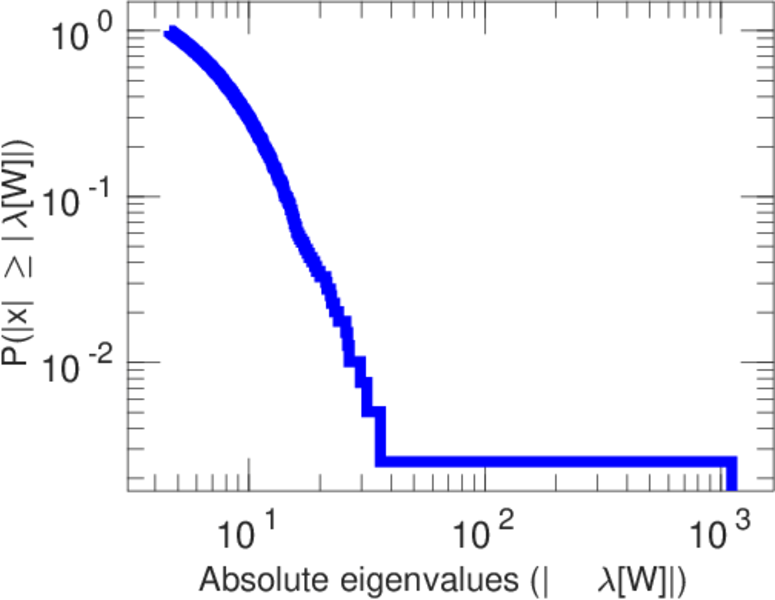
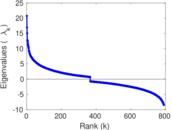
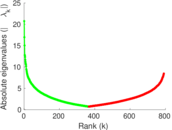
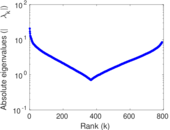
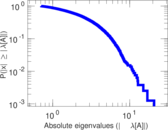
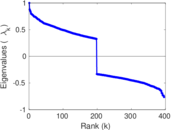
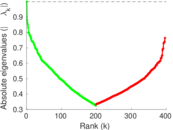
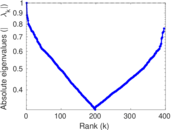
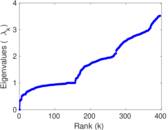
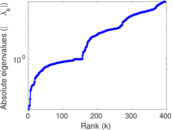
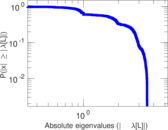
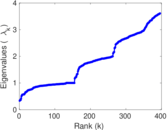
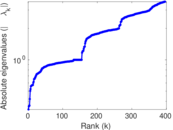
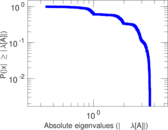
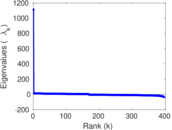
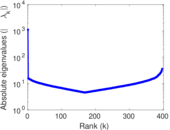
| Spectral norm | α = | 20.747 0
|
| Algebraic connectivity | a = | 0.332 560
|
| Spectral separation | |λ1[A] / λ2[A]| = | 1.223 03
|
| Non-bipartivity | bA = | 0.592 240
|
| Normalized non-bipartivity | bN = | 0.235 829
|
| Algebraic non-bipartivity | χ = | 0.334 159
|
| Spectral bipartite frustration | bK = | 0.008 681 95
|
| Controllability | C = | 60
|
| Relative controllability | Cr = | 0.052 956 8
|
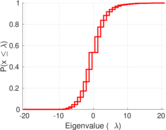
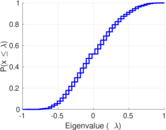
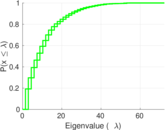
Plots

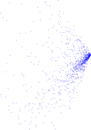


Matrix decompositions plots


Downloads
References
|
[1]
|
Jérôme Kunegis.
KONECT – The Koblenz Network Collection.
In Proc. Int. Conf. on World Wide Web Companion, pages
1343–1350, 2013.
[ http ]
|
|
[2]
|
Roger Guimerà, Leon Danon, Albert Díaz-Guilera, Francesc Giralt, and Alex
Arenas.
Self-similar community structure in a network of human interactions.
Phys. Rev. E, 68(6):065103, 2003.
|
 KONECT ‣ Networks ‣
Buy Me a Coffee
KONECT ‣ Networks ‣
Buy Me a Coffee