Jazz musicians
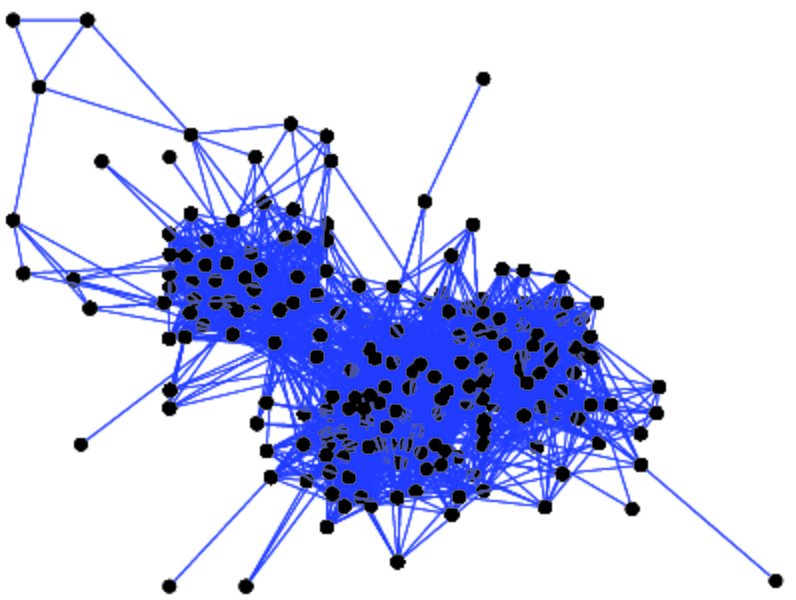
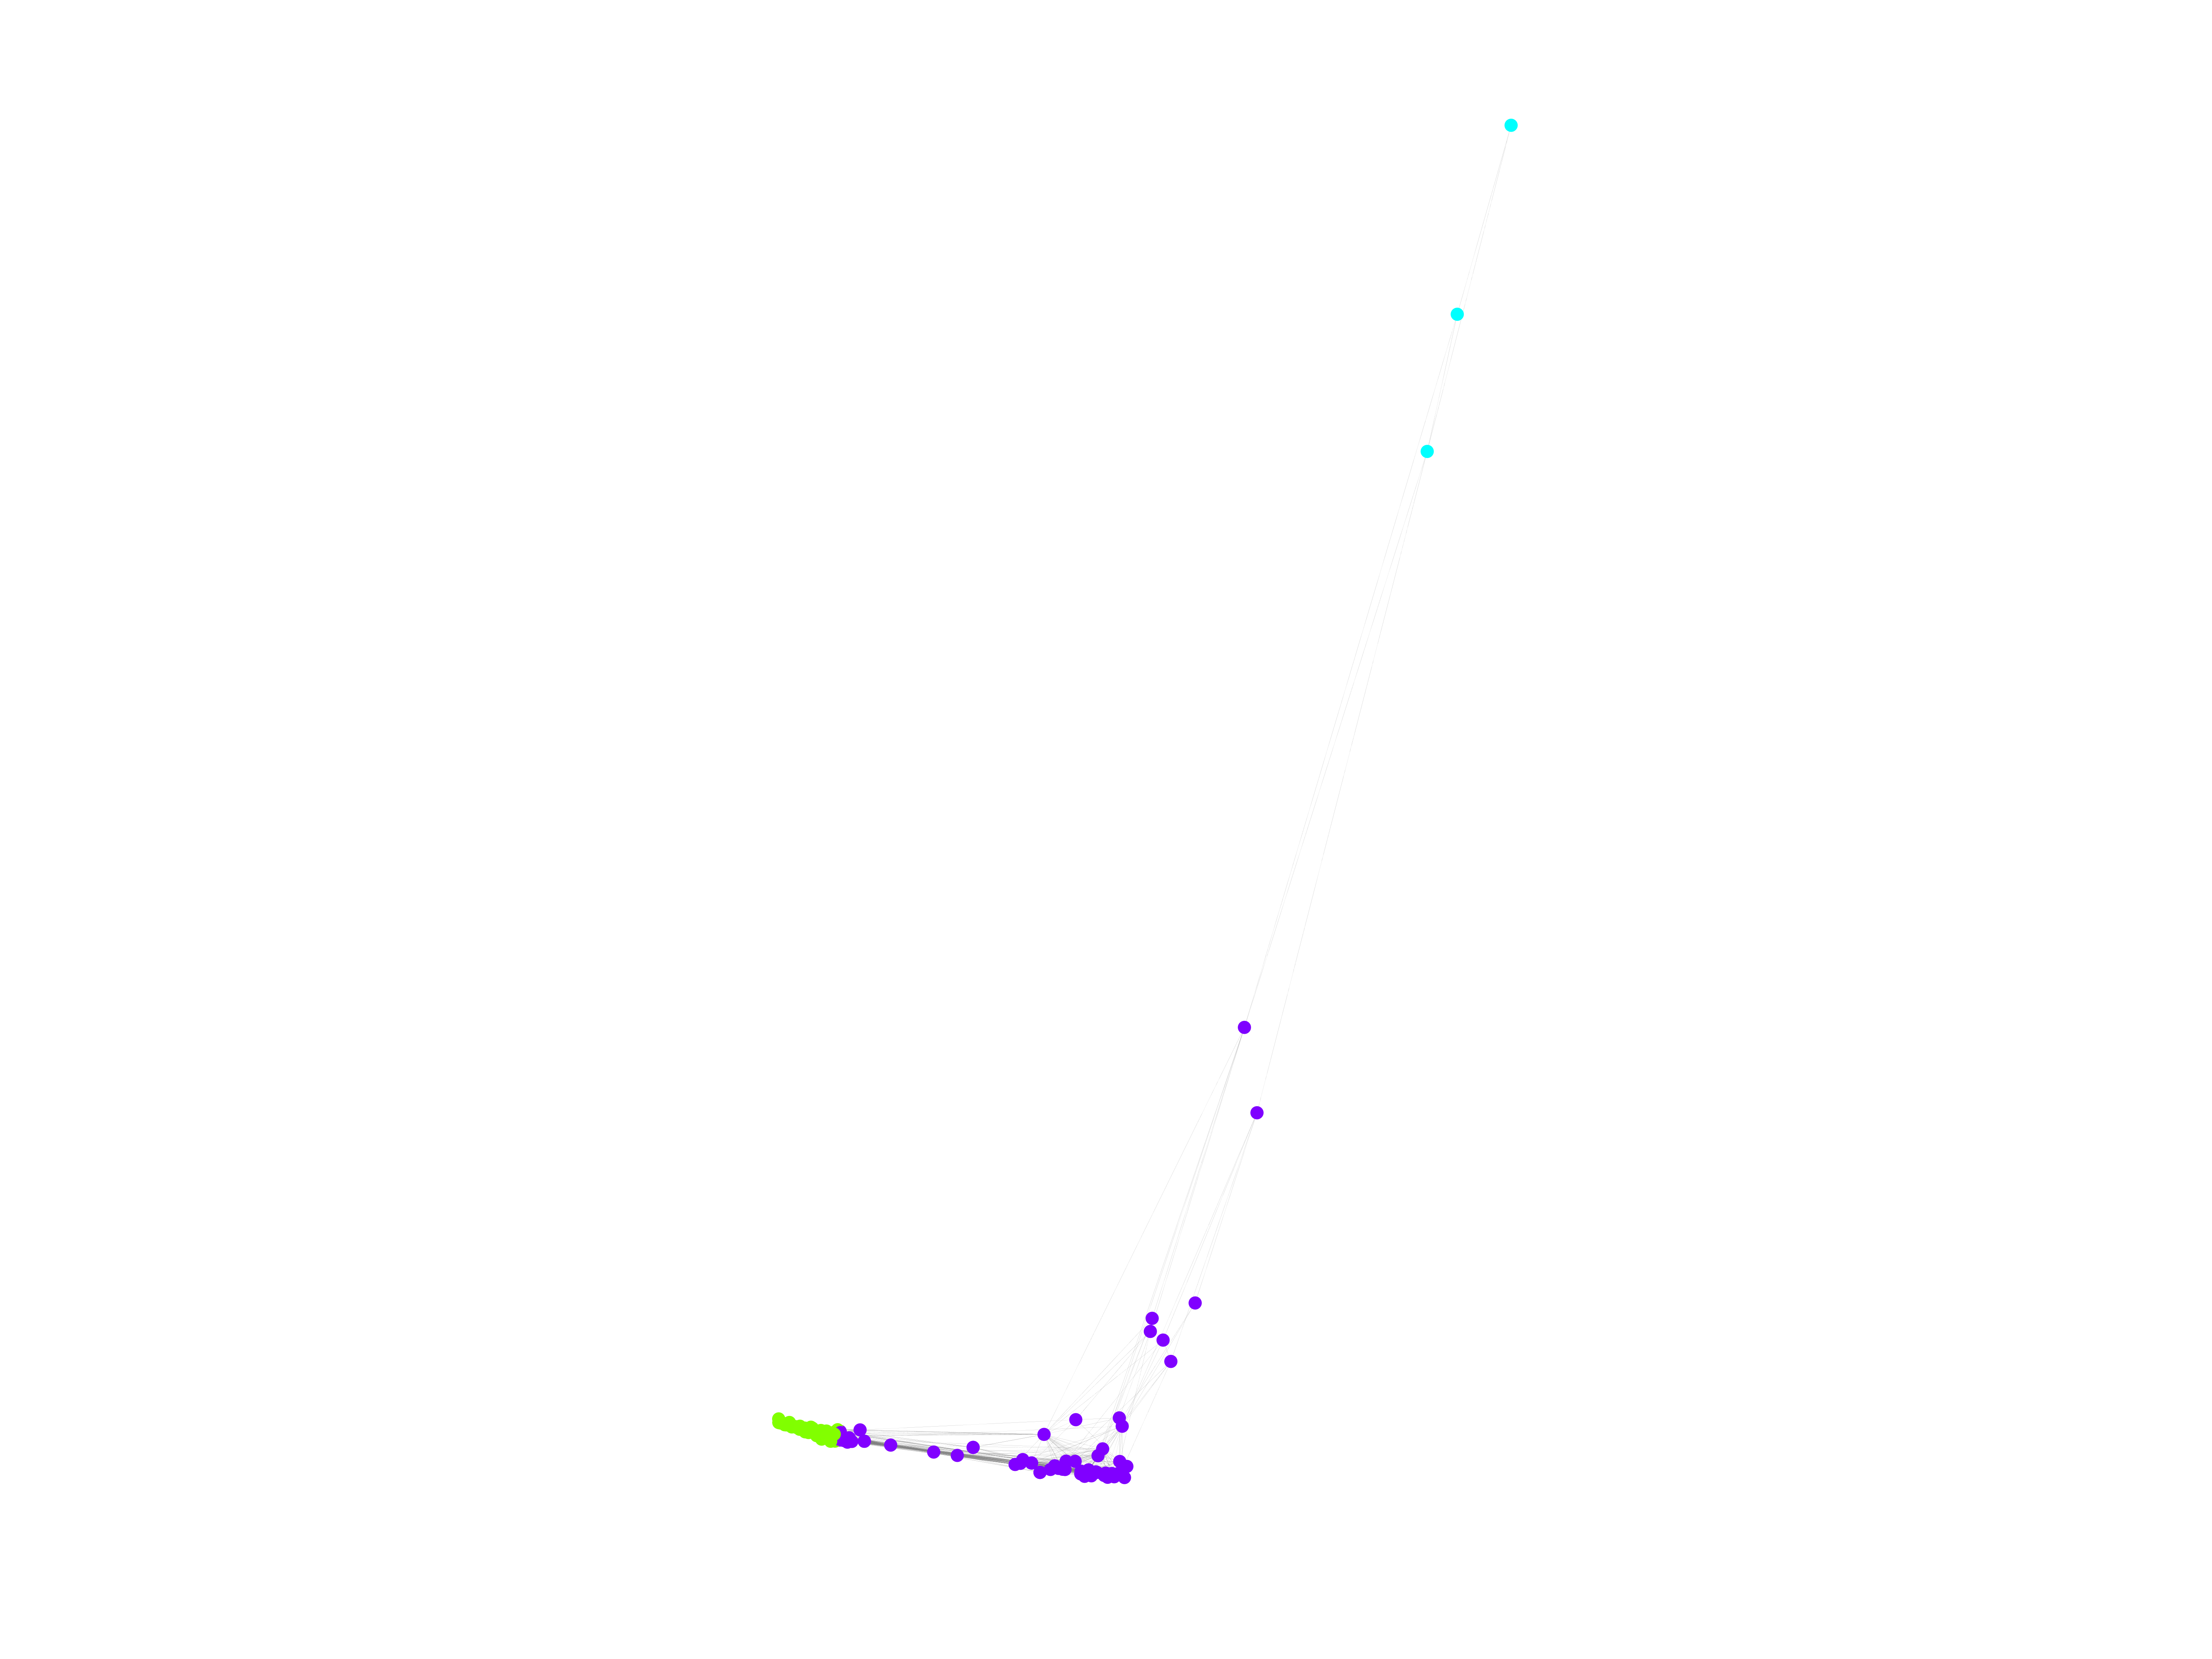
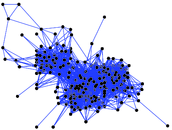
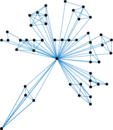
This is the collaboration network between Jazz musicians. Each node is a Jazz
musician and an edge denotes that two musicians have played together in a band.
The data was collected in 2003.
Metadata
Statistics
| Size | n = | 198
|
| Volume | m = | 2,742
|
| Loop count | l = | 0
|
| Wedge count | s = | 103,212
|
| Claw count | z = | 1,583,352
|
| Cross count | x = | 21,666,963
|
| Triangle count | t = | 17,899
|
| Square count | q = | 406,441
|
| 4-Tour count | T4 = | 3,669,860
|
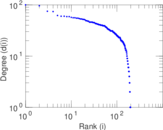
| Maximum degree | dmax = | 100
|
| Average degree | d = | 27.697 0
|
| Fill | p = | 0.140 594
|
| Size of LCC | N = | 198
|
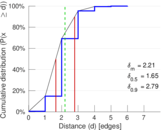
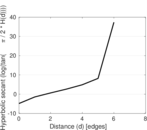
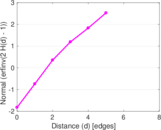
| Diameter | δ = | 6
|
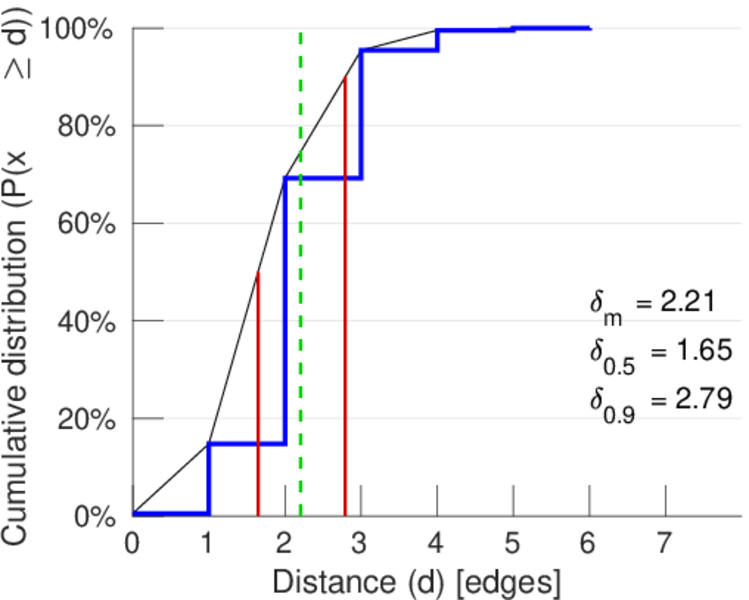
| 50-Percentile effective diameter | δ0.5 = | 1.647 00
|
| 90-Percentile effective diameter | δ0.9 = | 2.793 55
|
| Median distance | δM = | 2
|
| Mean distance | δm = | 2.206 04
|
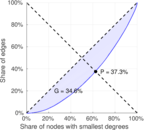
| Gini coefficient | G = | 0.345 989
|
| Balanced inequality ratio | P = | 0.373 450
|
| Relative edge distribution entropy | Her = | 0.961 549
|
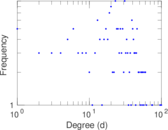
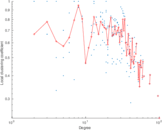
| Power law exponent | γ = | 1.329 28
|
| Tail power law exponent | γt = | 5.271 00
|
| Tail power law exponent with p | γ3 = | 5.271 00
|
| p-value | p = | 0.623 000
|
| Degree assortativity | ρ = | +0.020 237 4
|
| Degree assortativity p-value | pρ = | 0.134 010
|
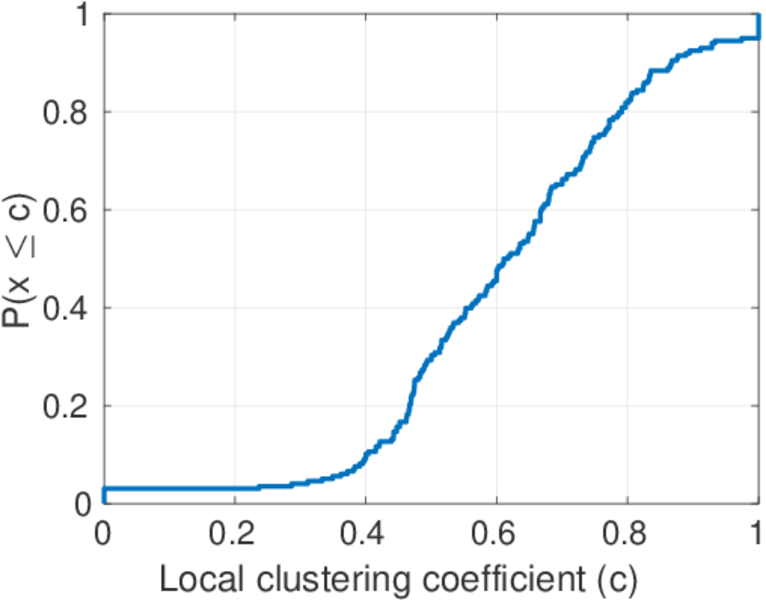
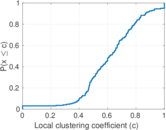
| Clustering coefficient | c = | 0.520 259
|
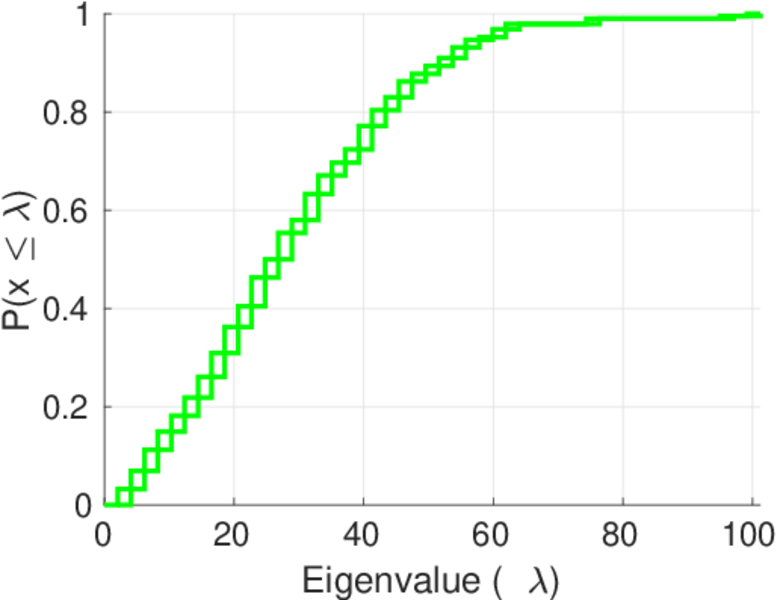
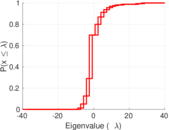
| Spectral norm | α = | 40.027 4
|
| Algebraic connectivity | a = | 0.571 994
|
| Spectral separation | |λ1[A] / λ2[A]| = | 1.461 22
|
| Non-bipartivity | bA = | 0.782 583
|
| Normalized non-bipartivity | bN = | 0.460 437
|
| Algebraic non-bipartivity | χ = | 0.692 773
|
| Spectral bipartite frustration | bK = | 0.006 253 14
|
| Controllability | C = | 1
|
| Relative controllability | Cr = | 0.005 050 51
|
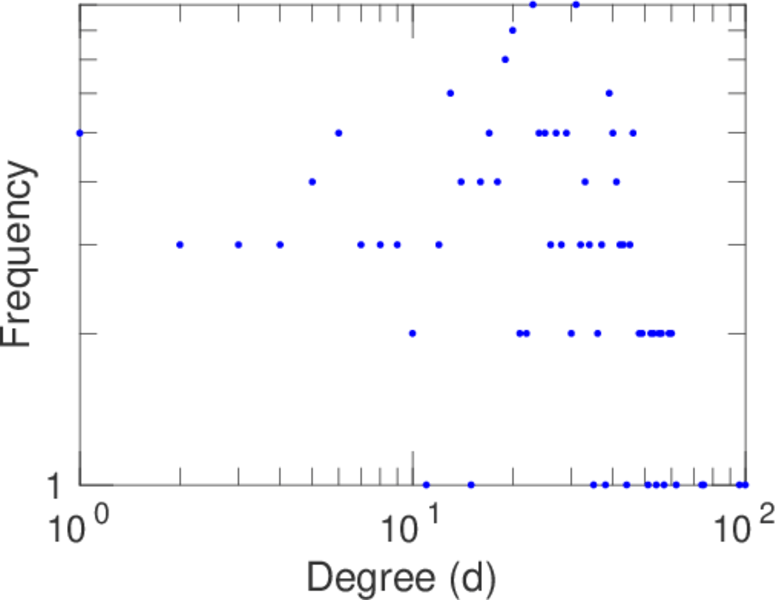
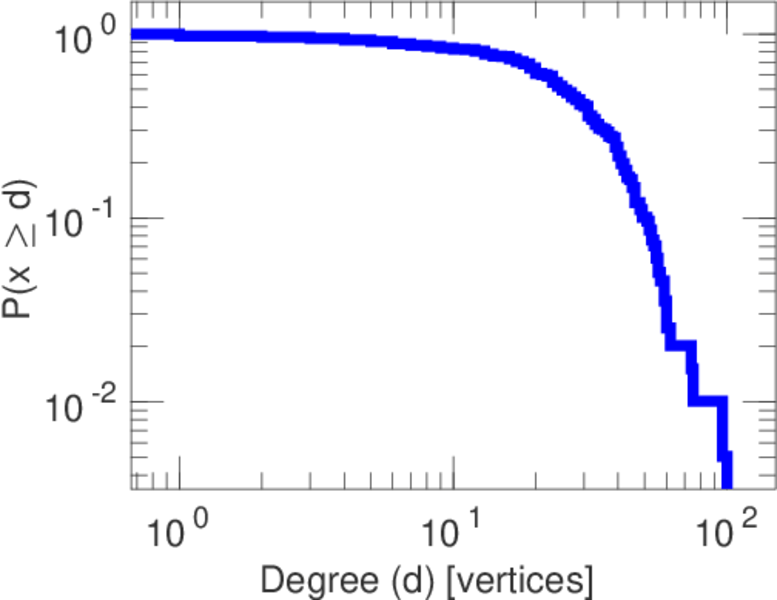
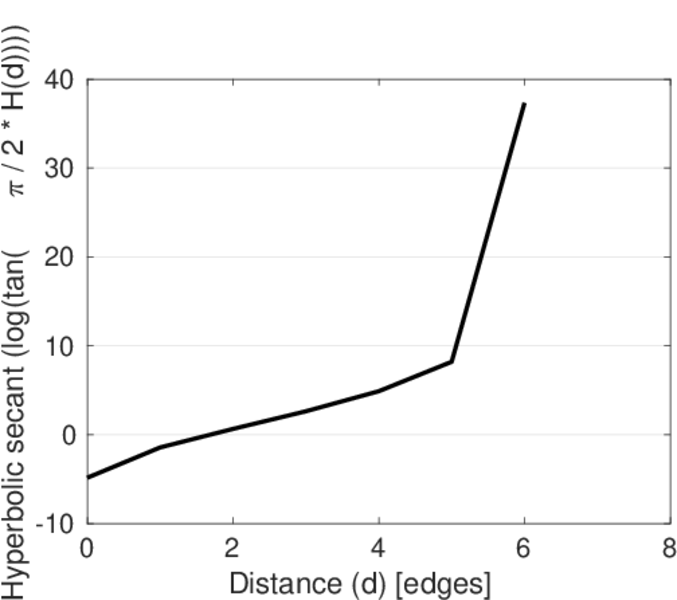
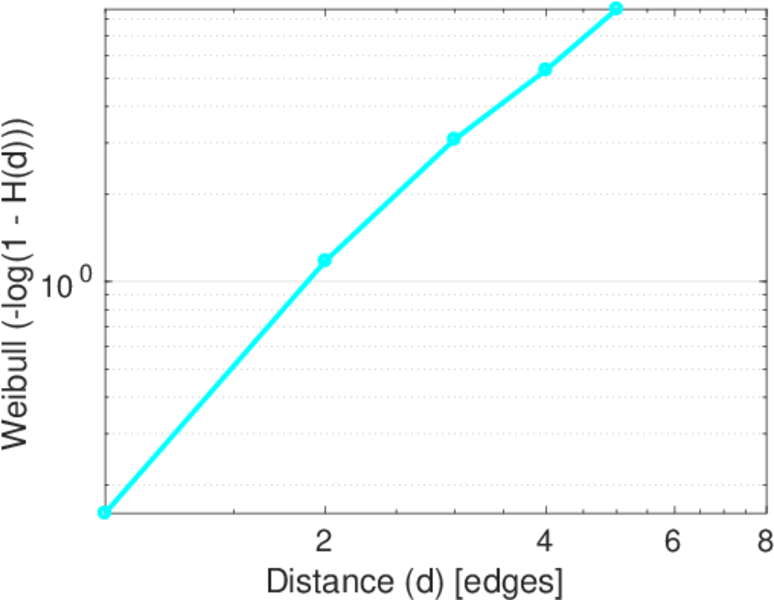
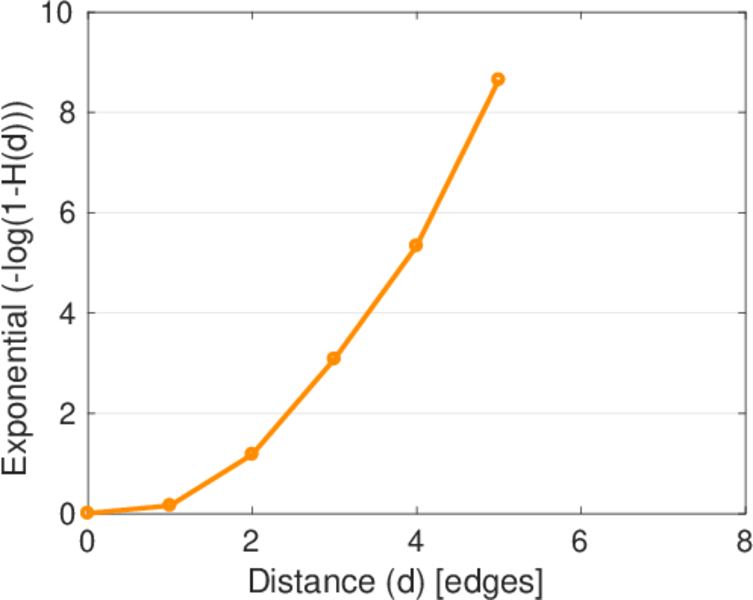
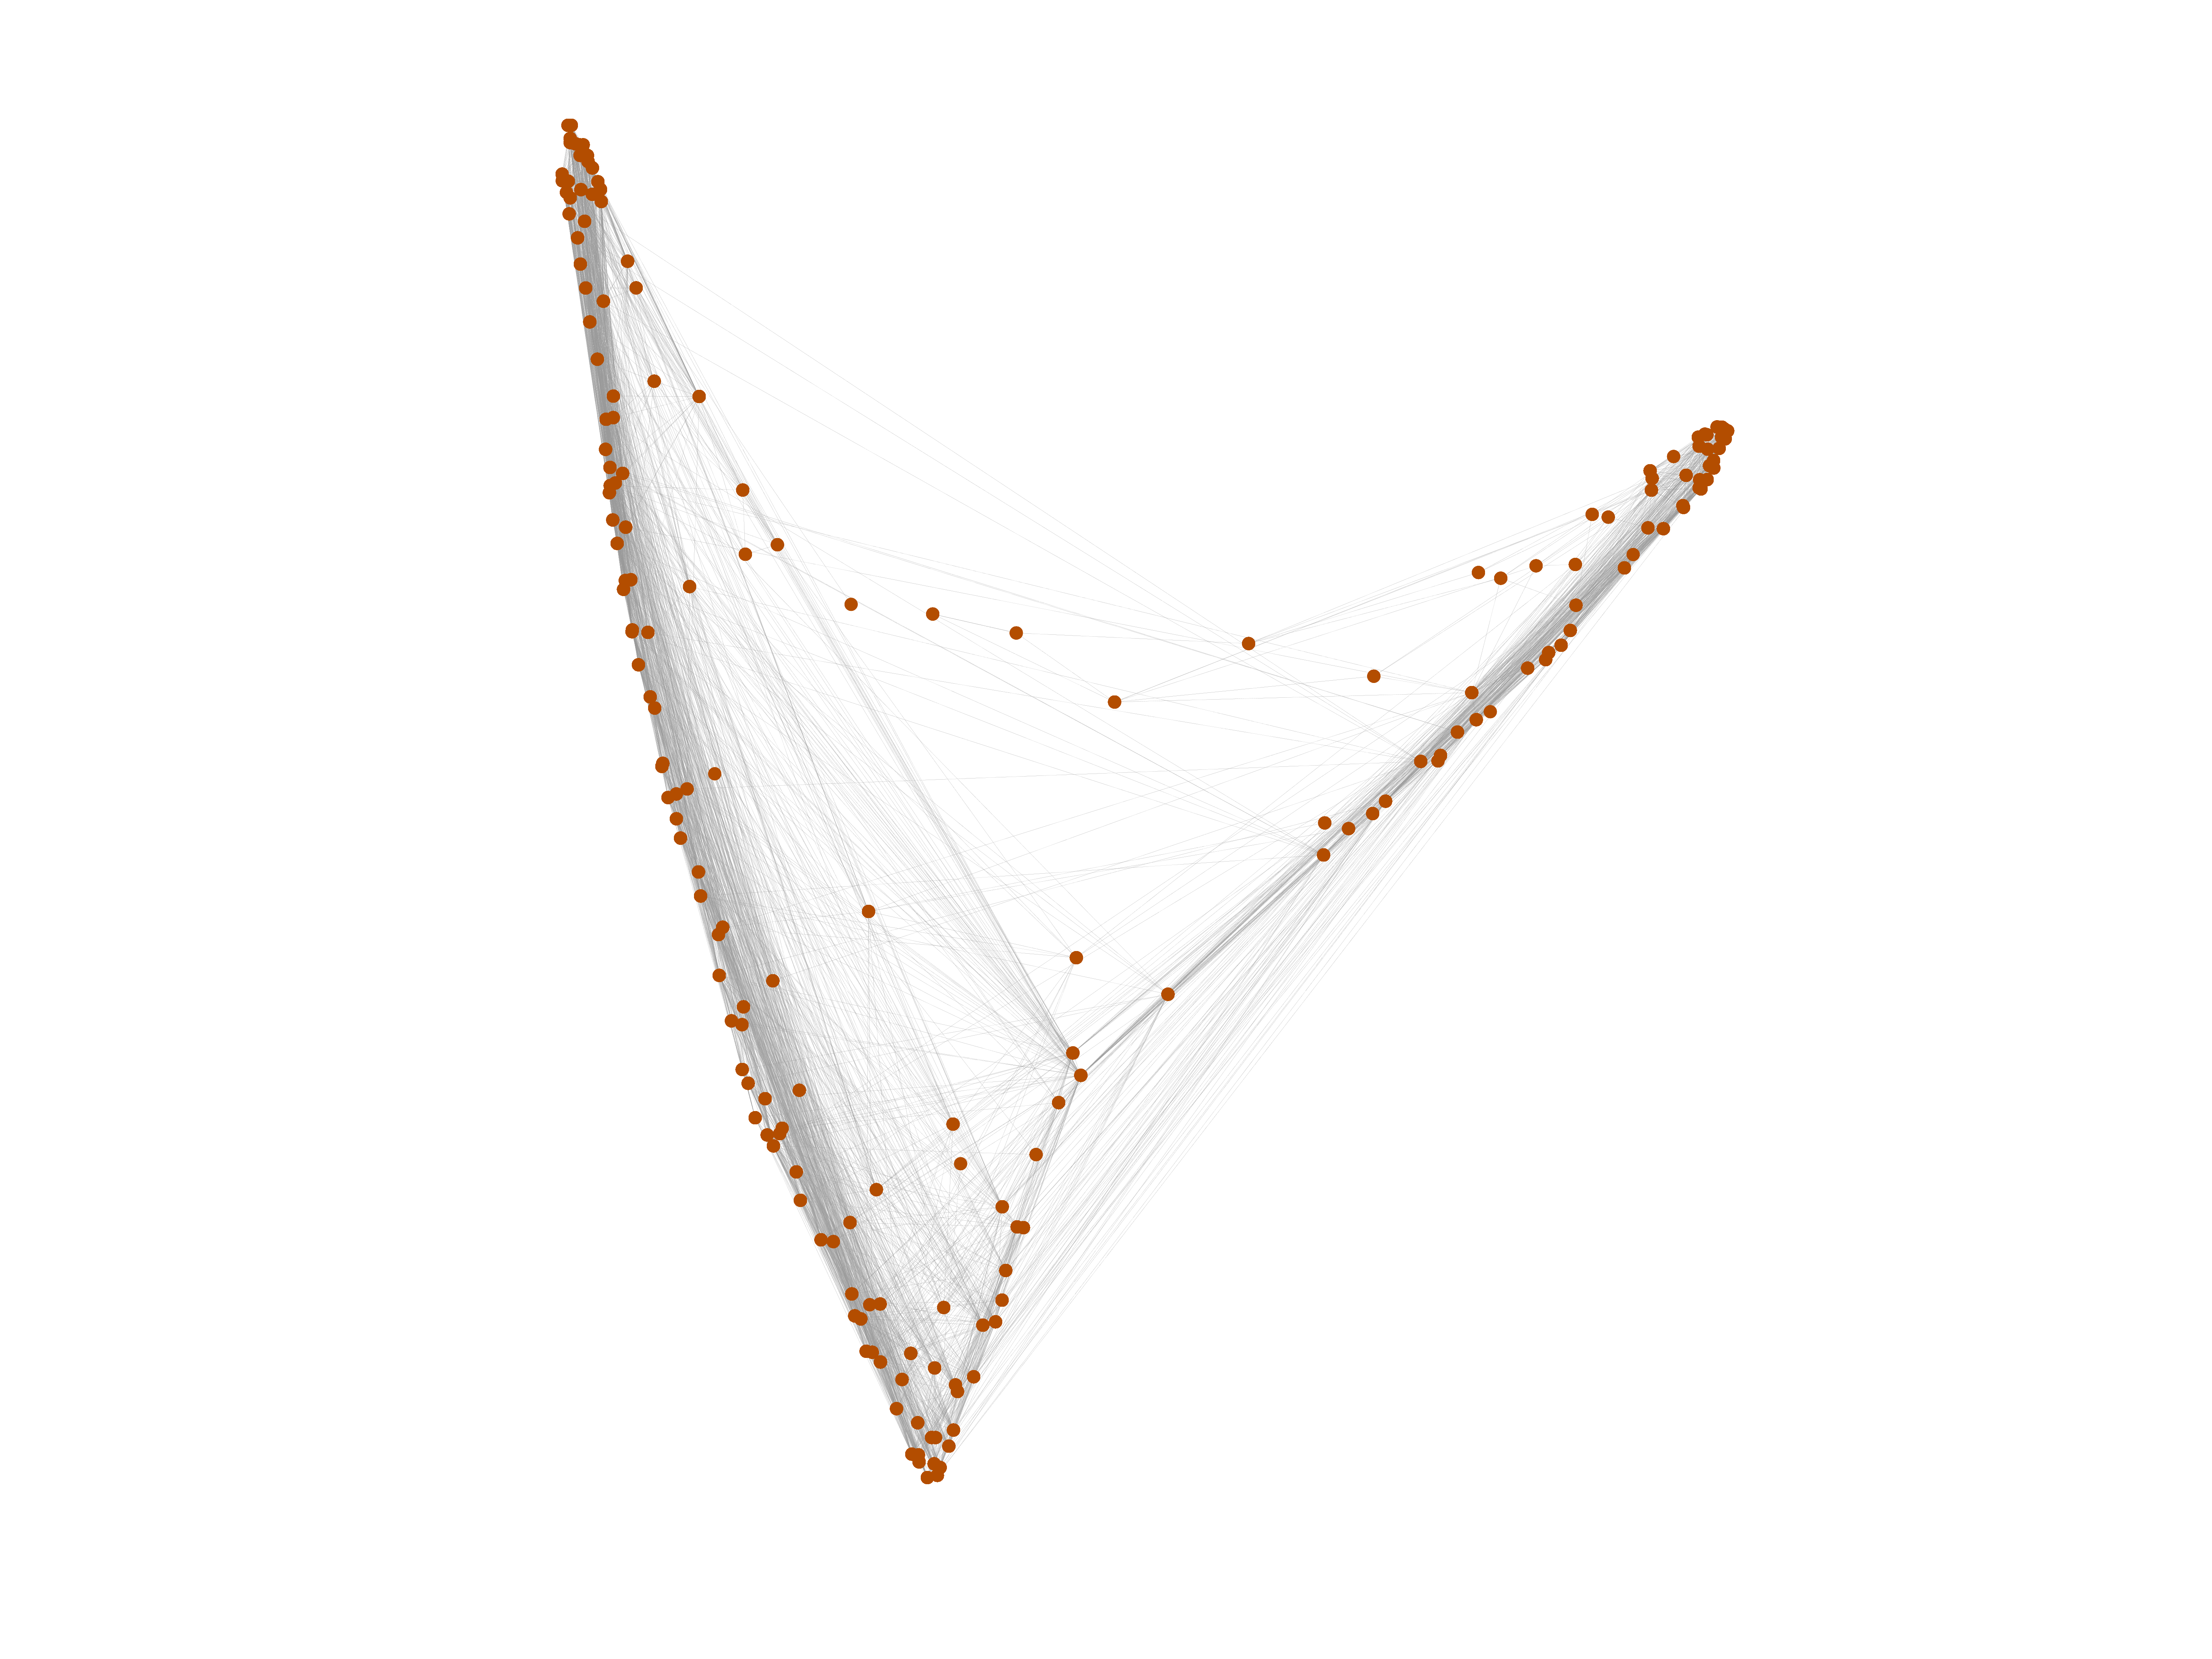
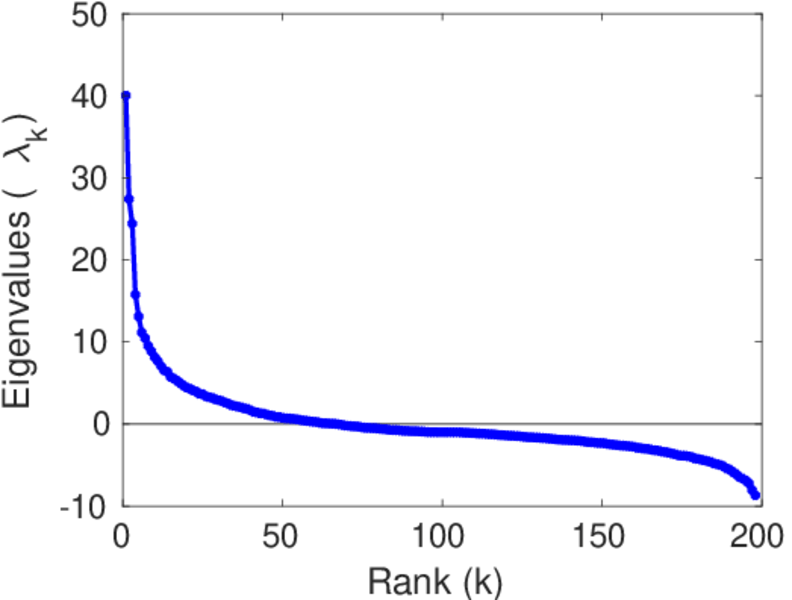
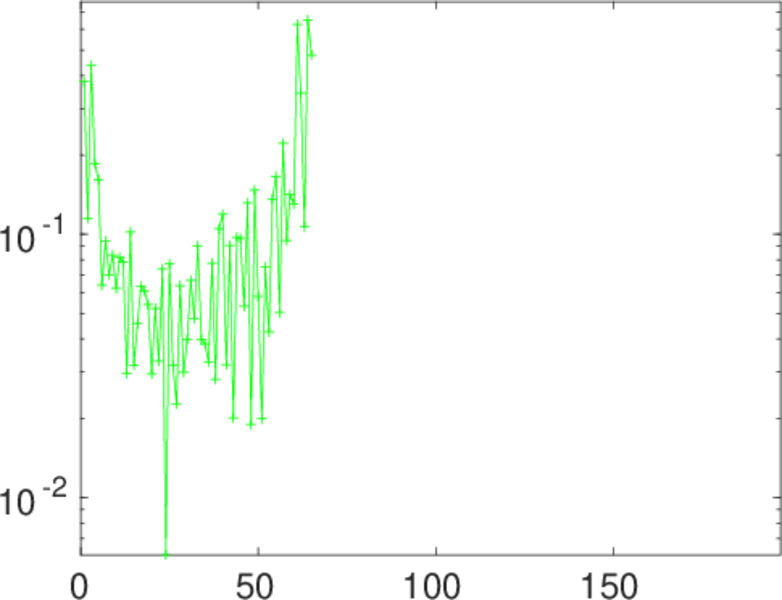
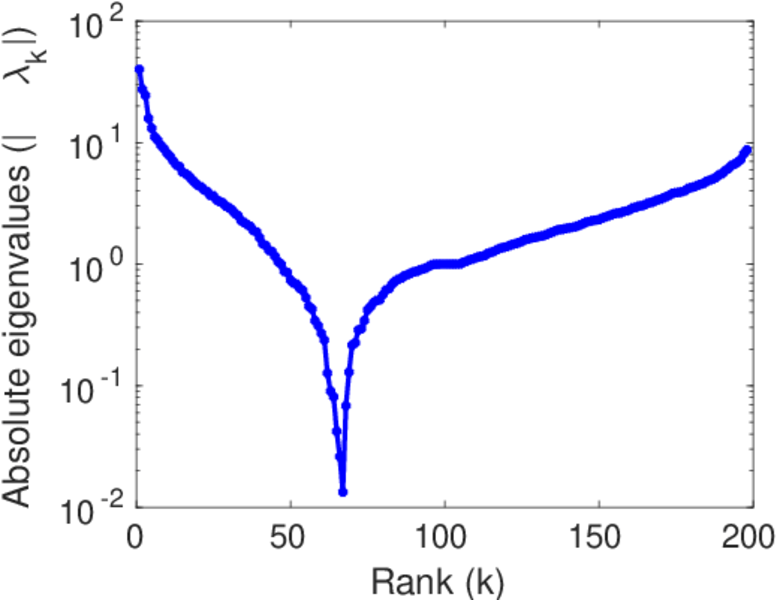
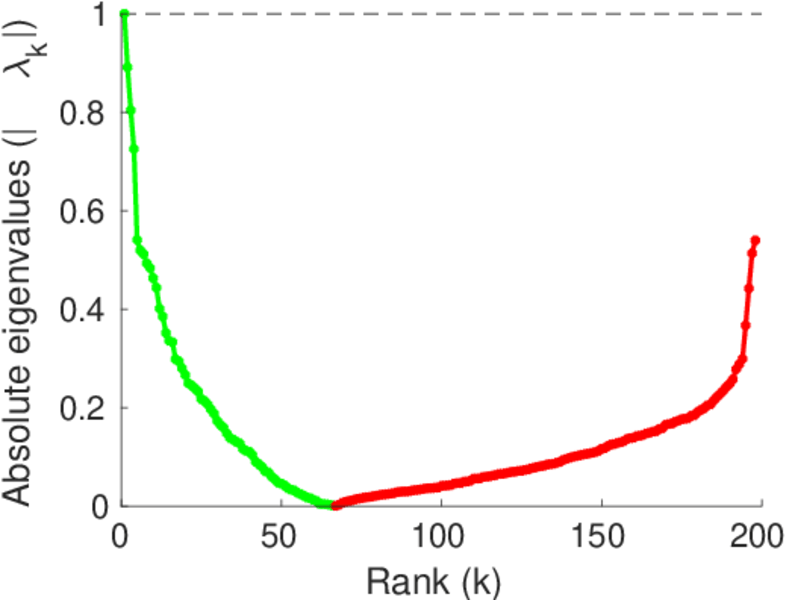
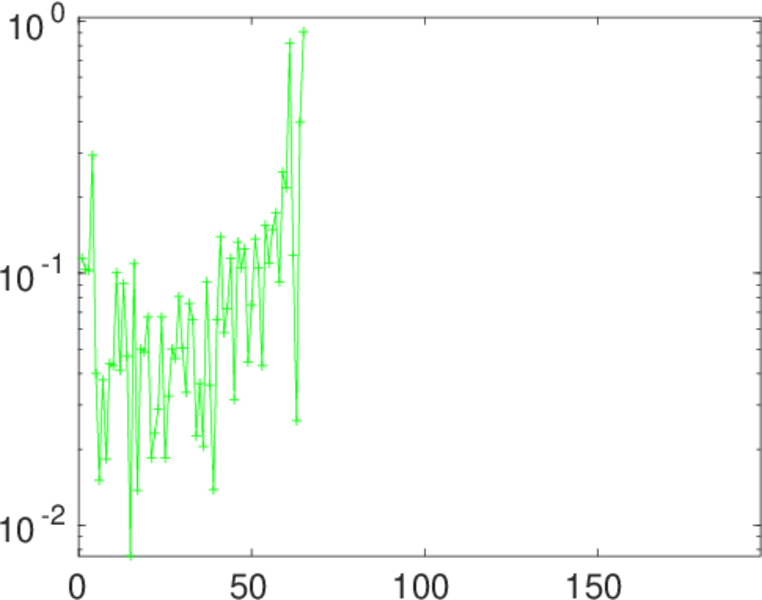
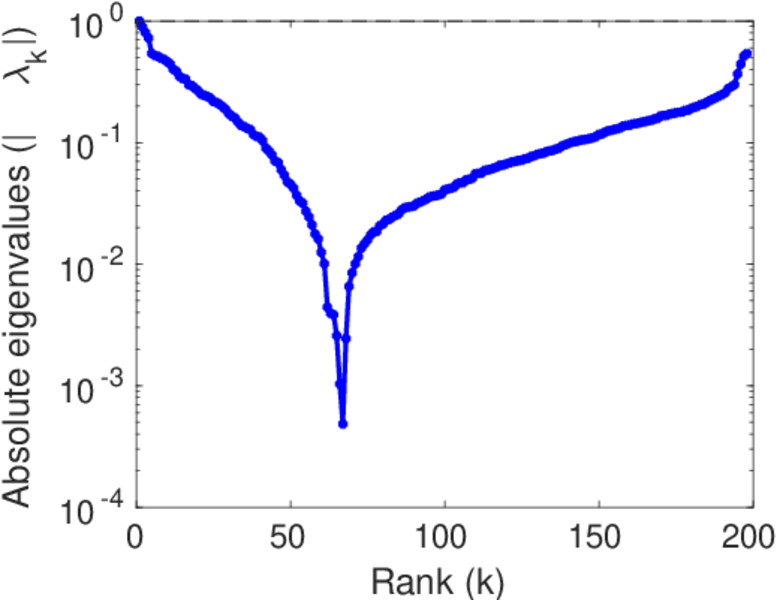
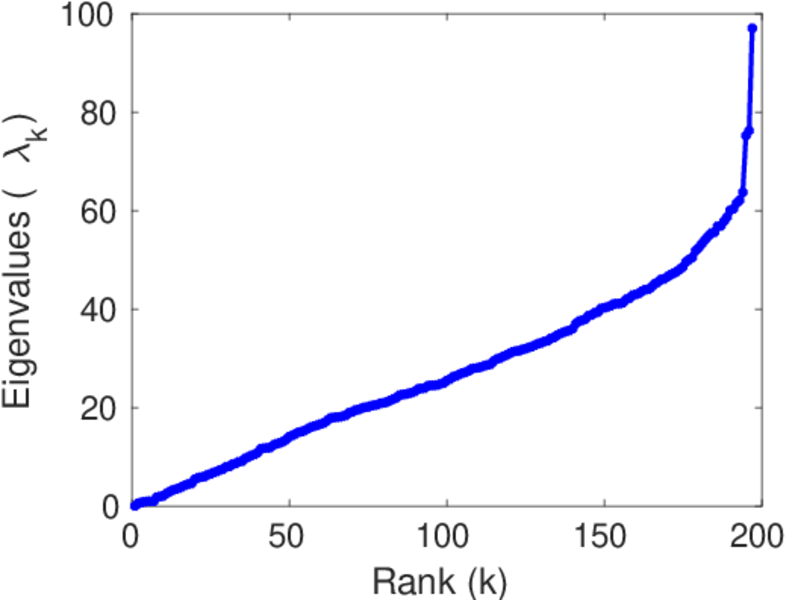
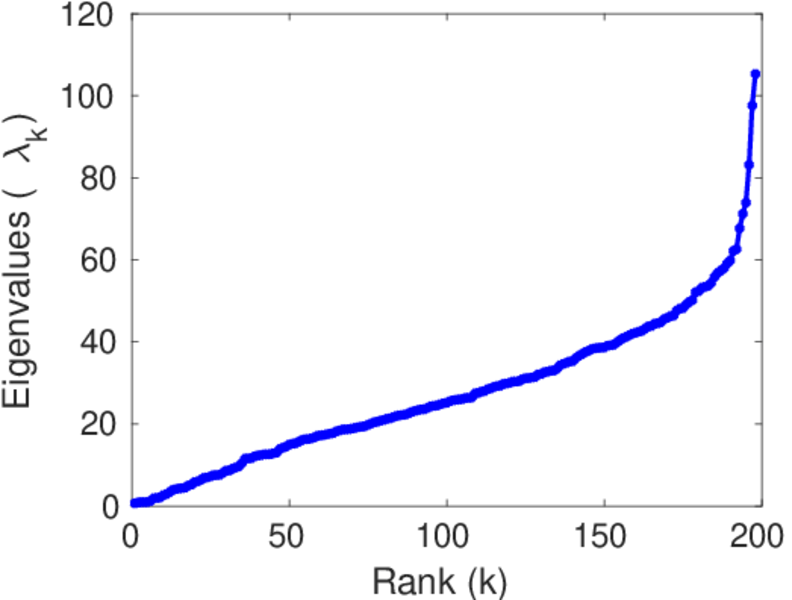
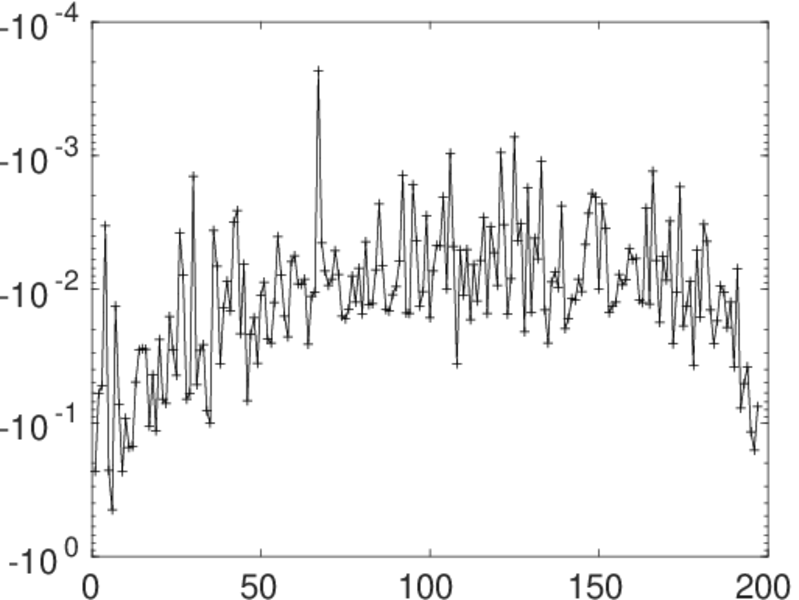
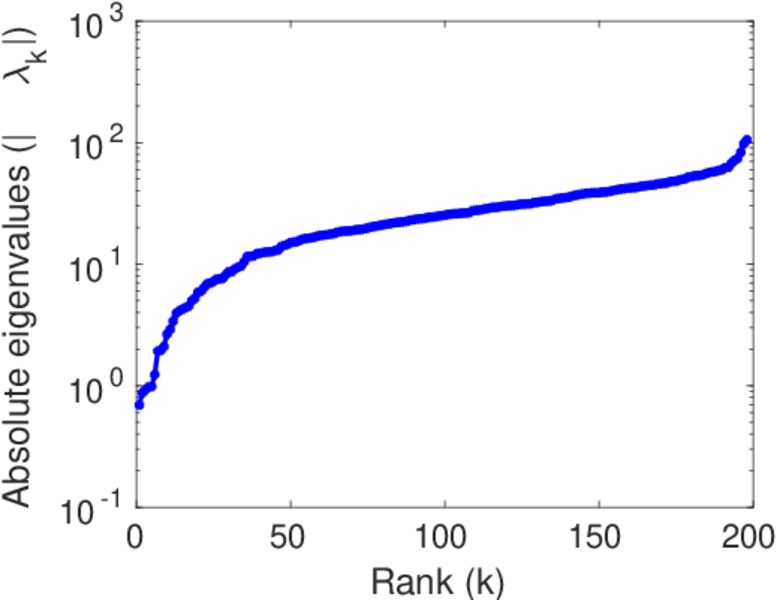
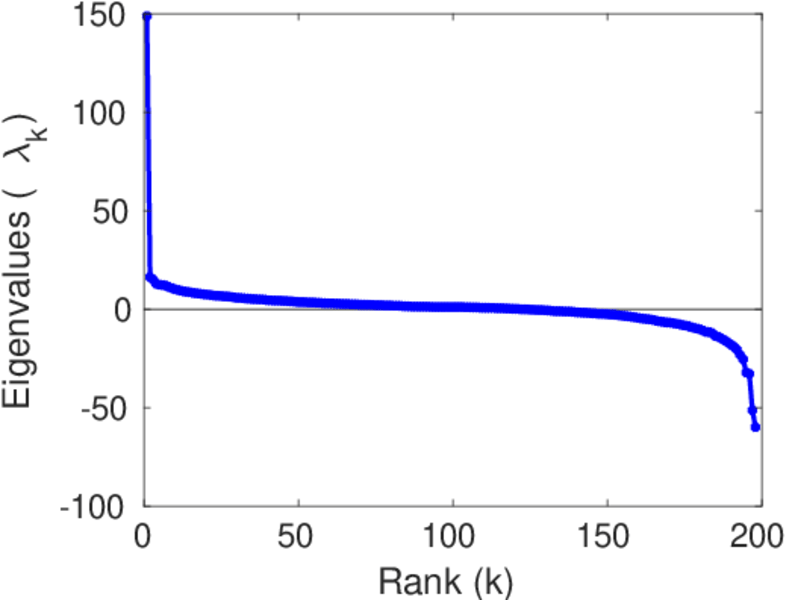
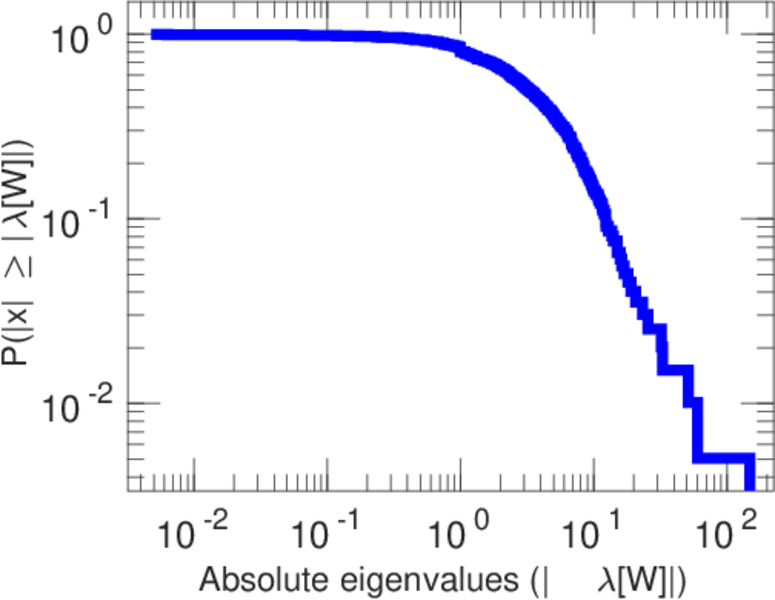
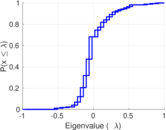
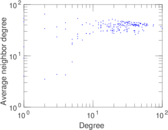
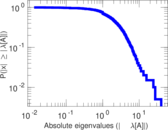
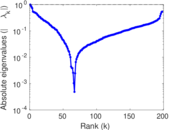
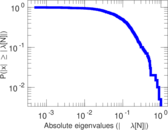
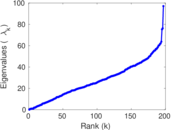
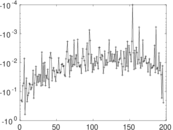
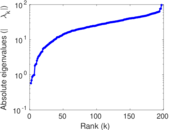
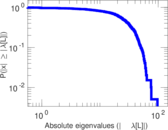
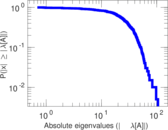
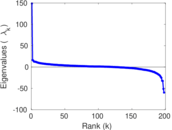
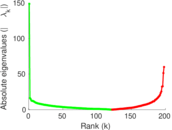
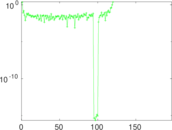
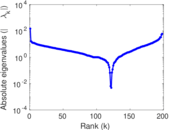
Plots


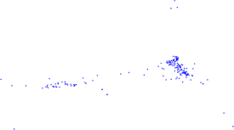
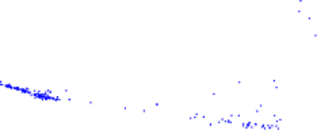


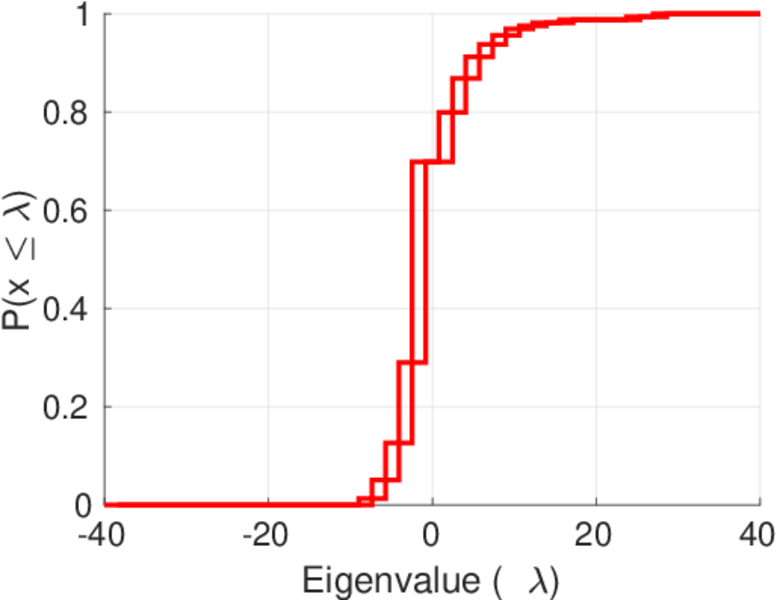
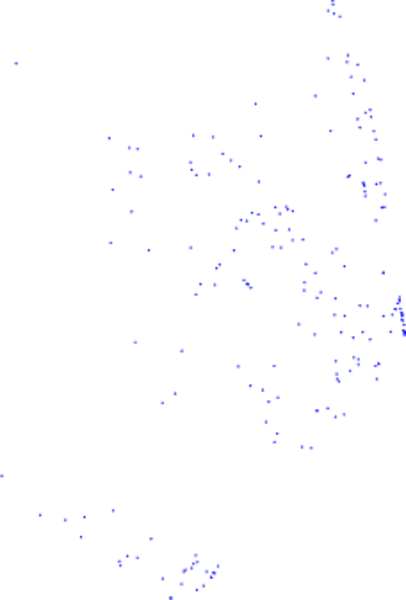
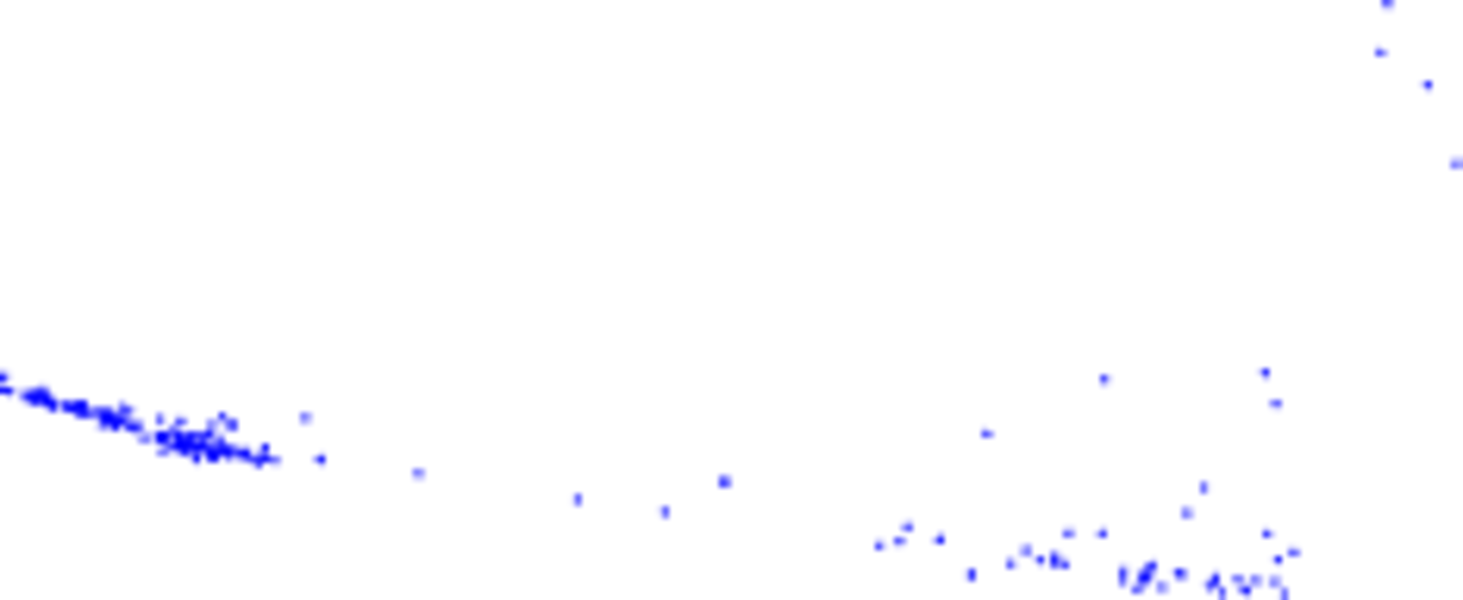
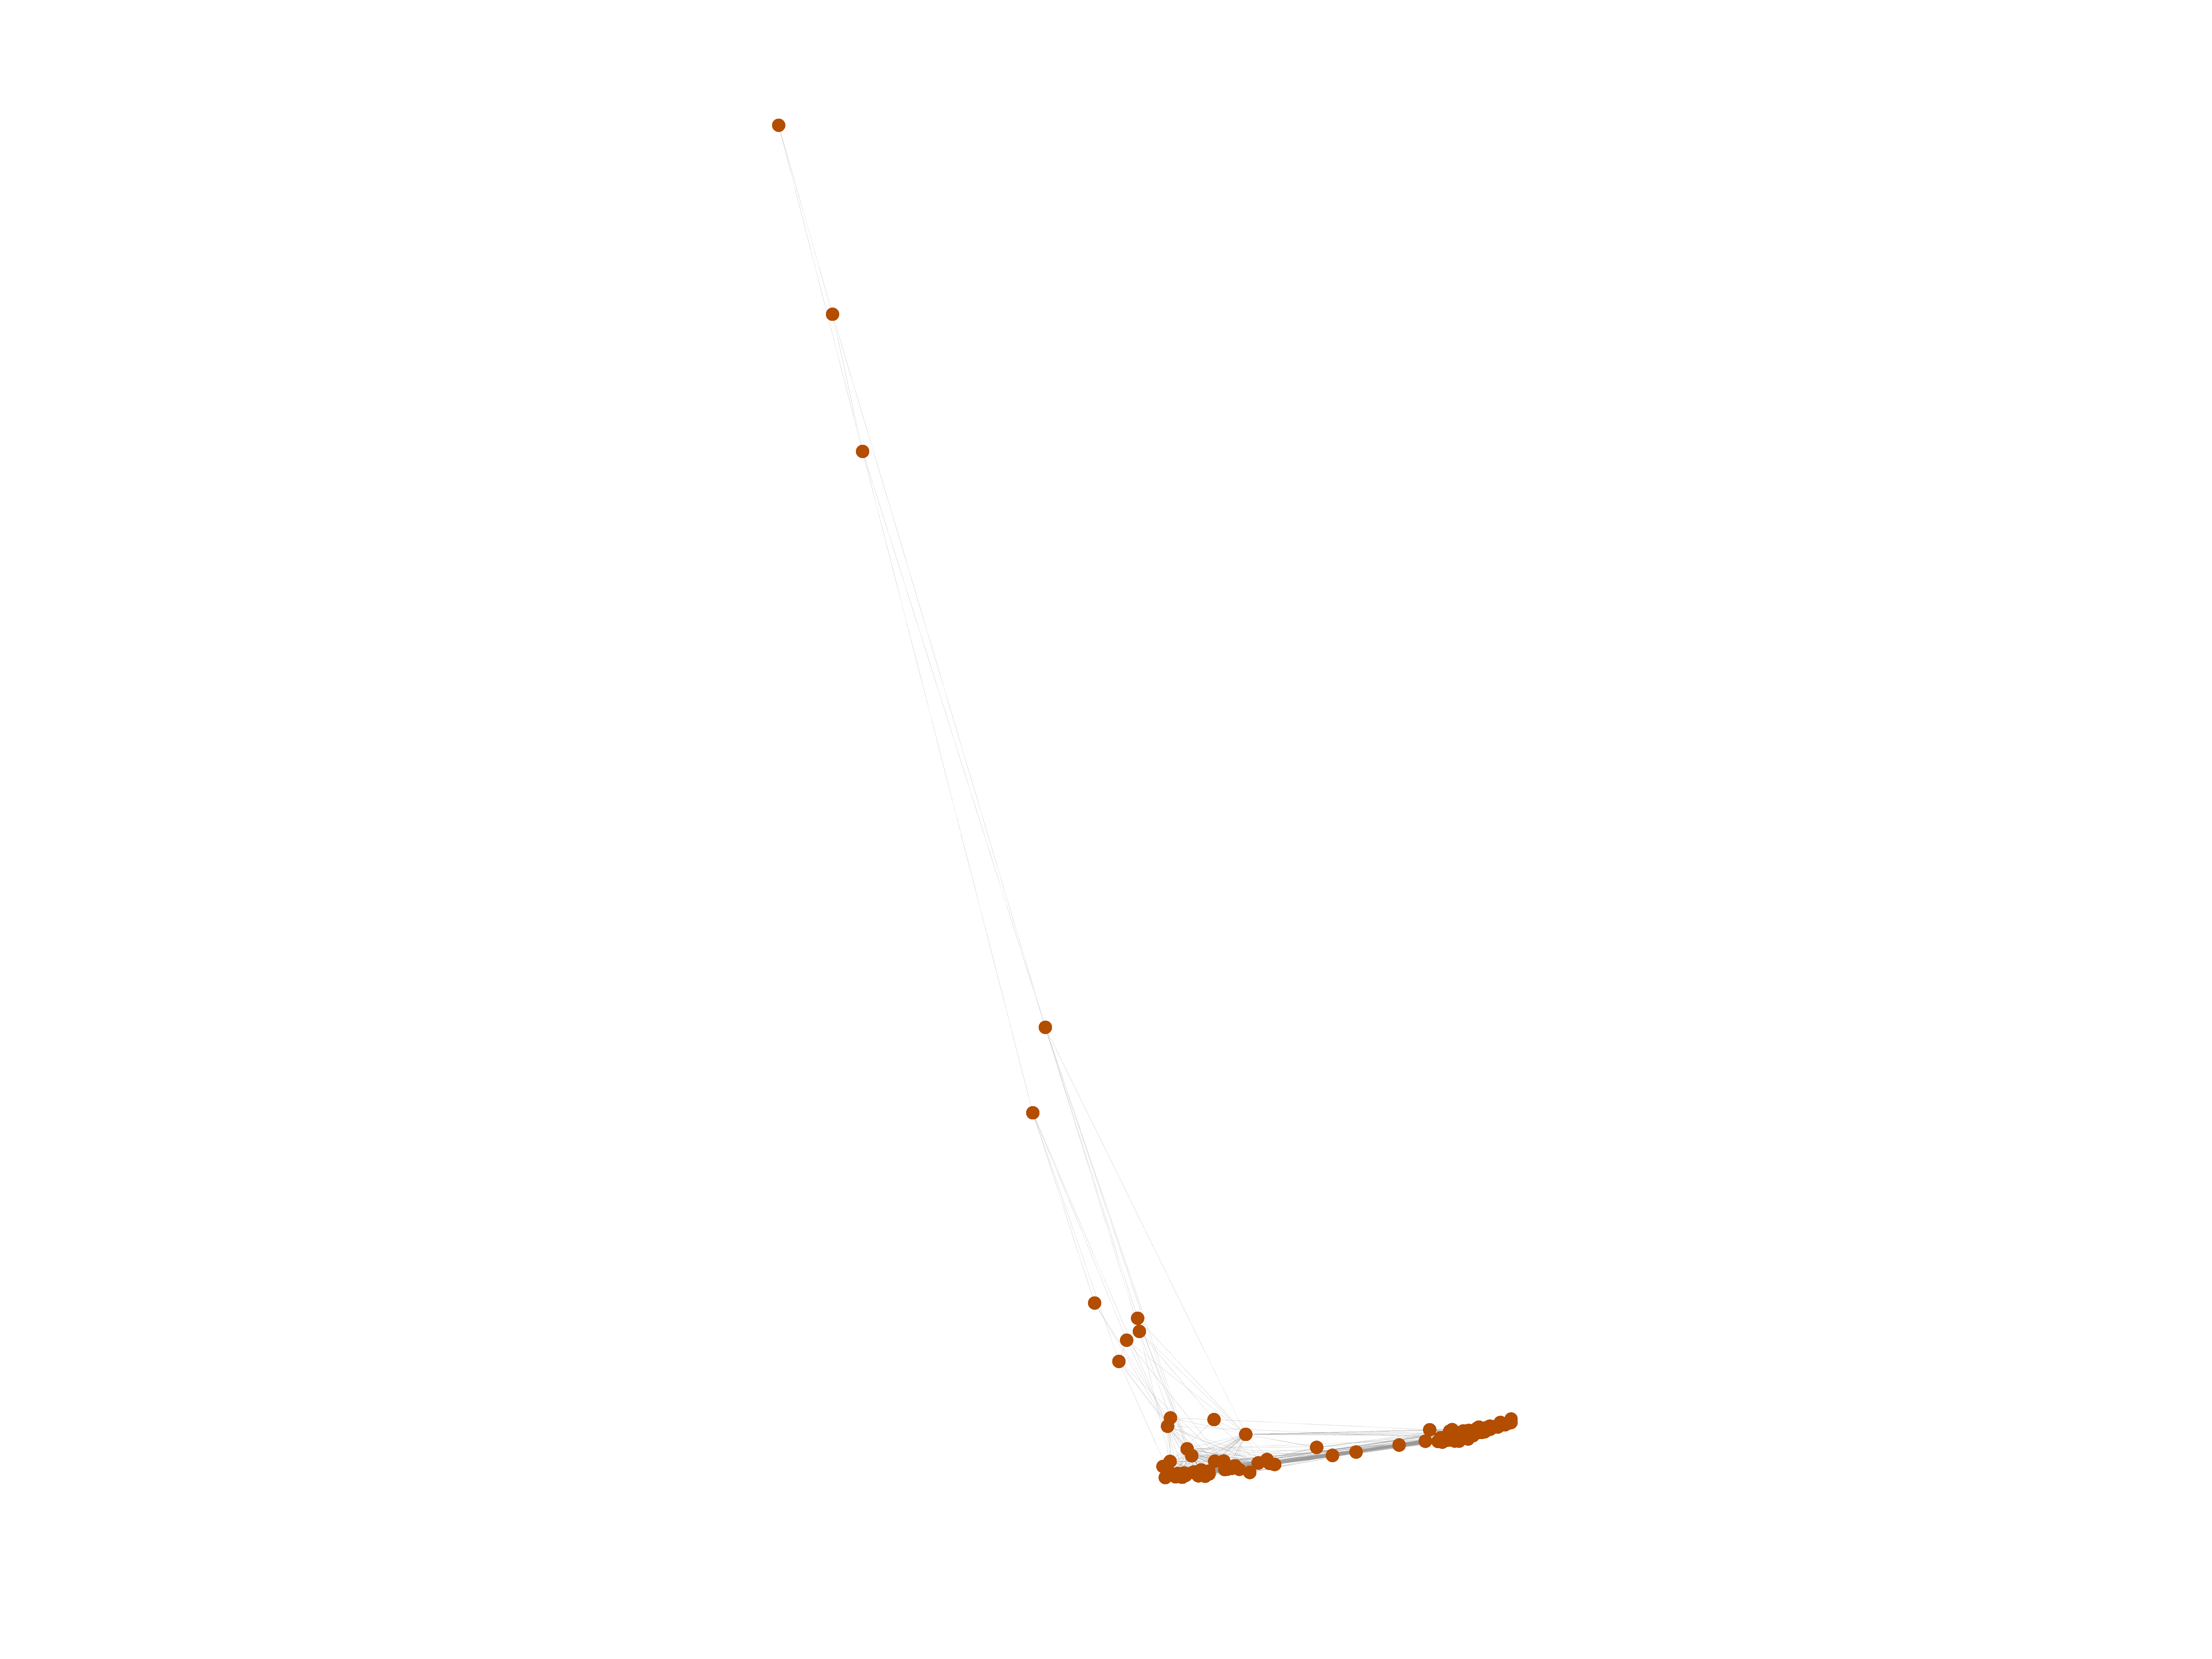
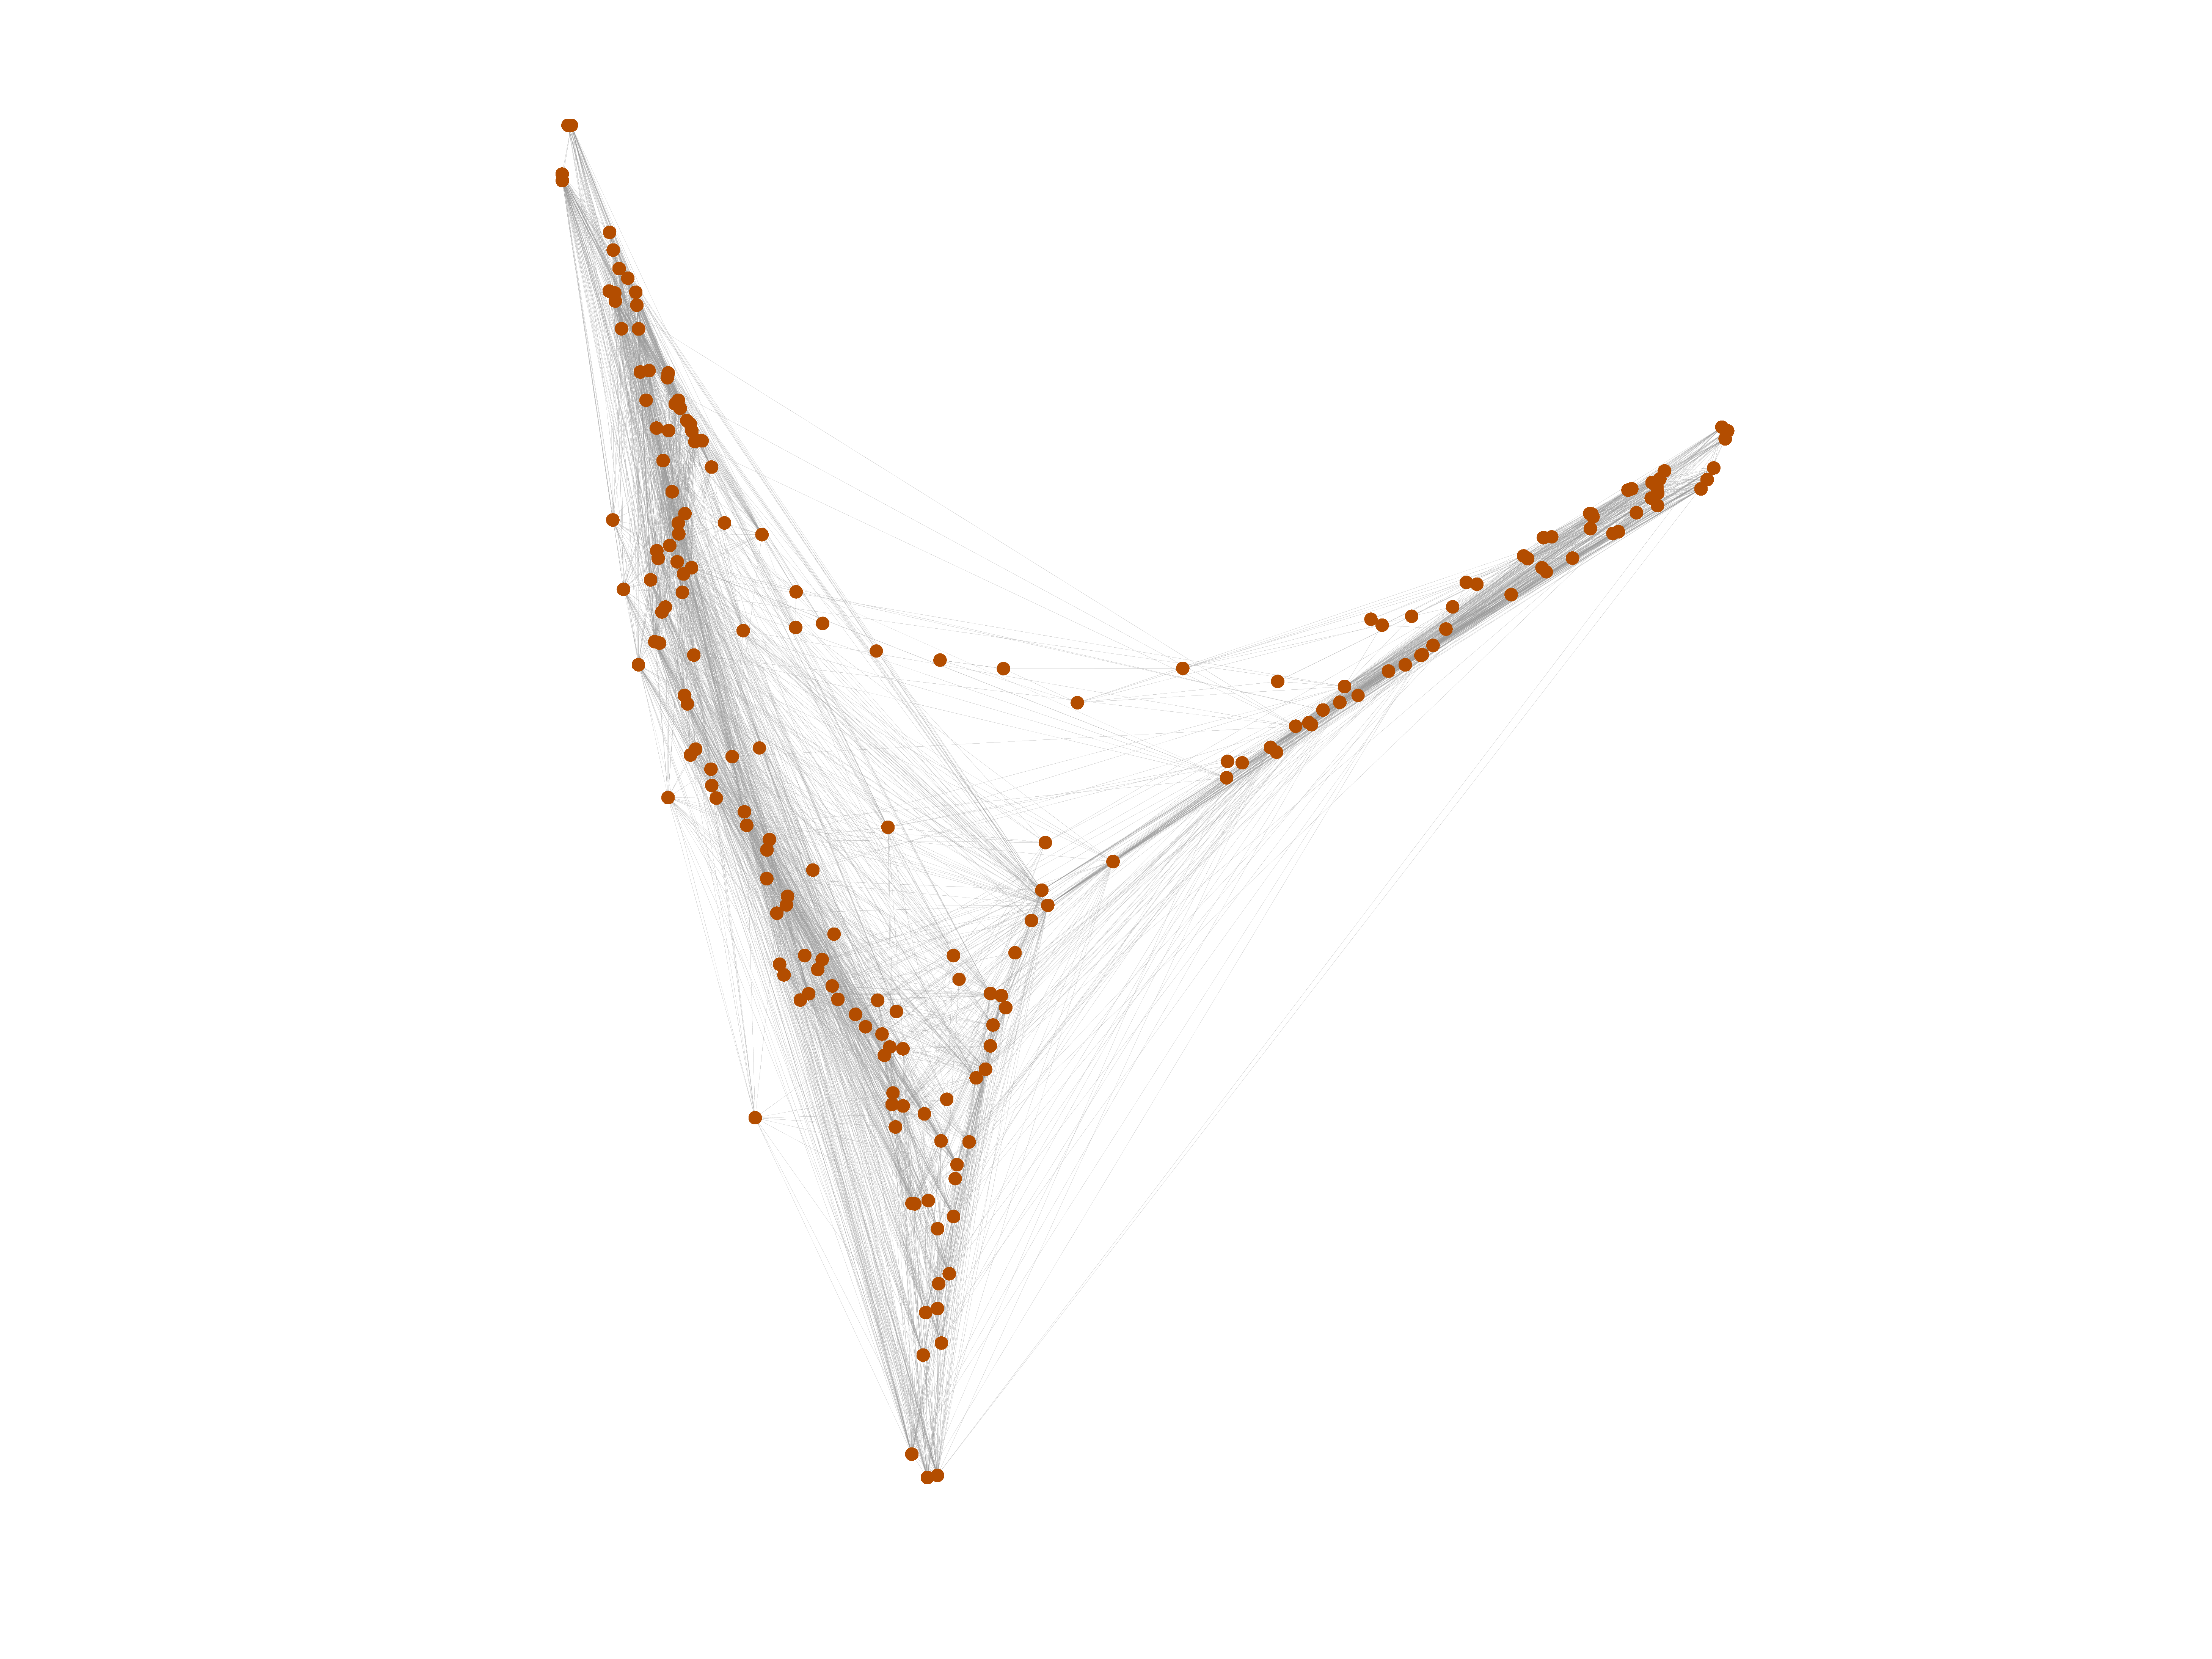
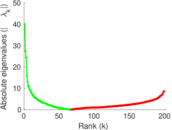
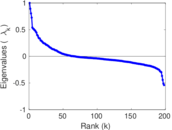
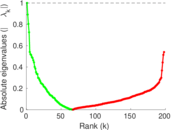
Matrix decompositions plots


Downloads
References
|
[1]
|
Jérôme Kunegis.
KONECT – The Koblenz Network Collection.
In Proc. Int. Conf. on World Wide Web Companion, pages
1343–1350, 2013.
[ http ]
|
|
[2]
|
Pablo M. Gleiser and Leon Danon.
Community structure in jazz.
Advances in Complex Systems, 6(4):565–573, 2003.
|
 KONECT ‣ Networks ‣
Buy Me a Coffee
KONECT ‣ Networks ‣
Buy Me a Coffee