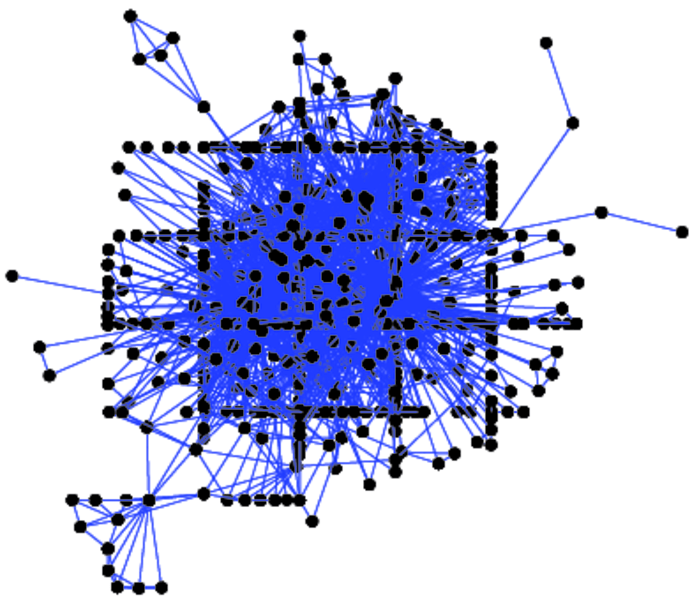
Caenorhabditis elegans
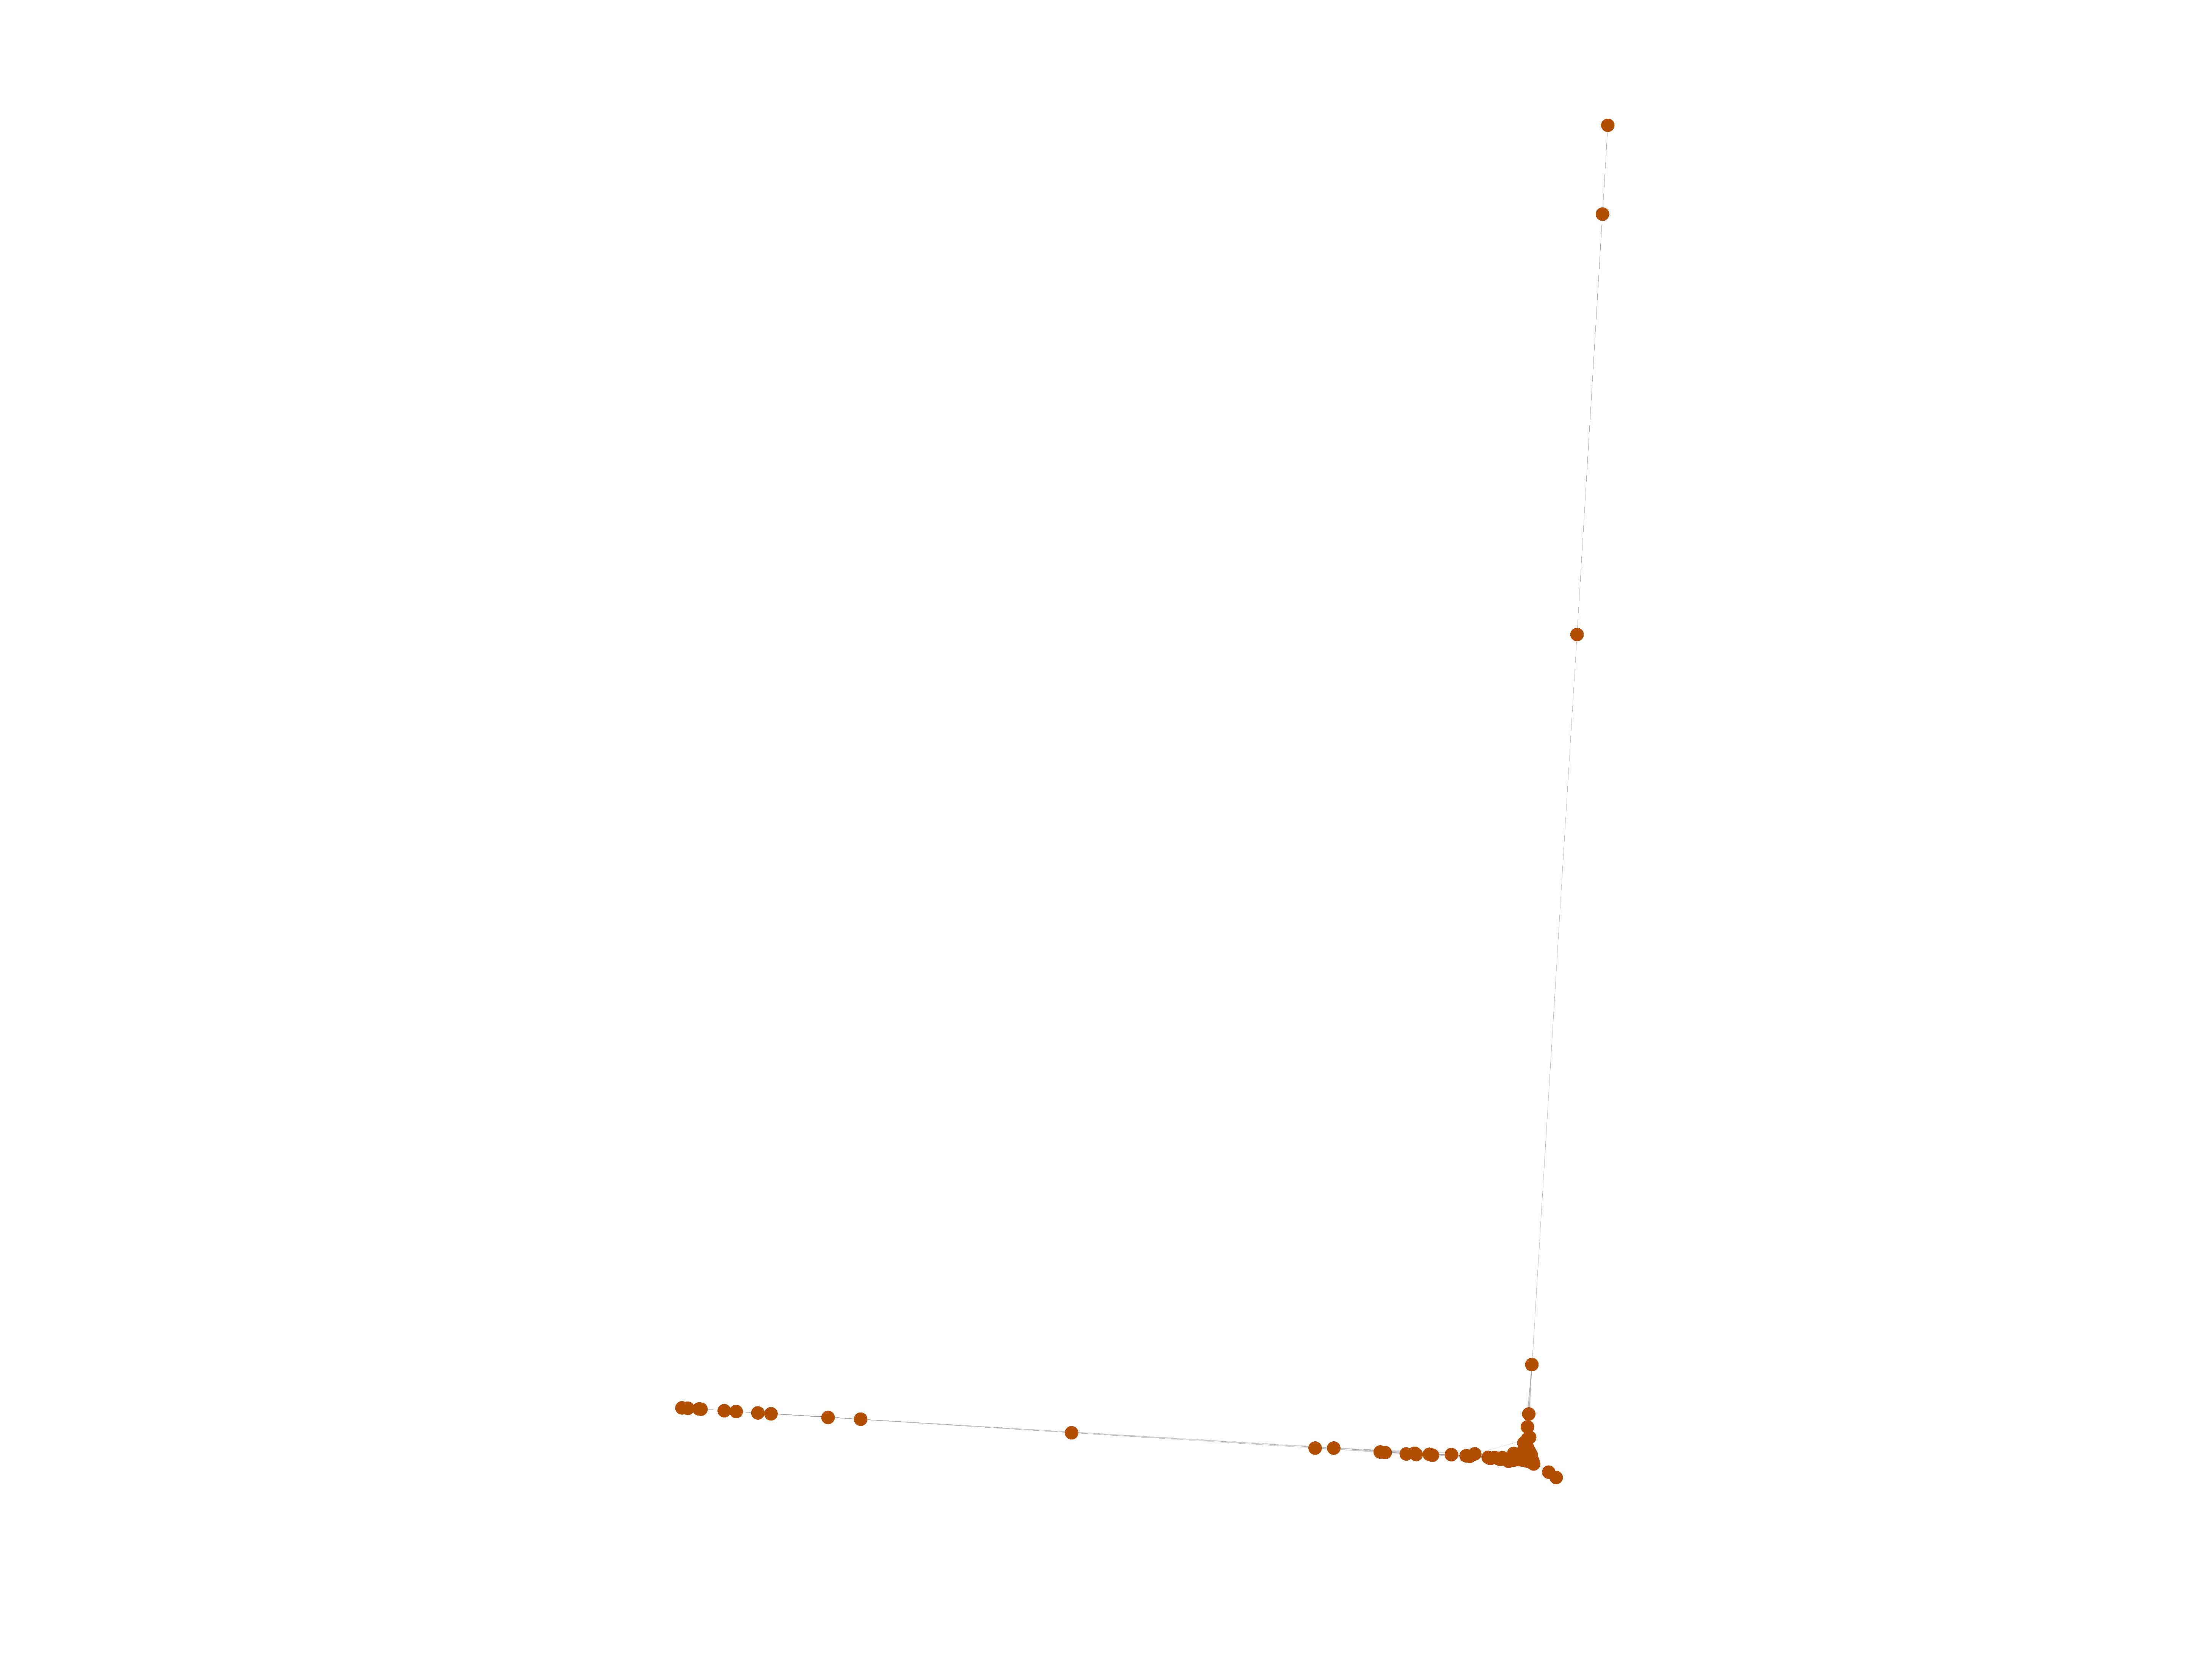
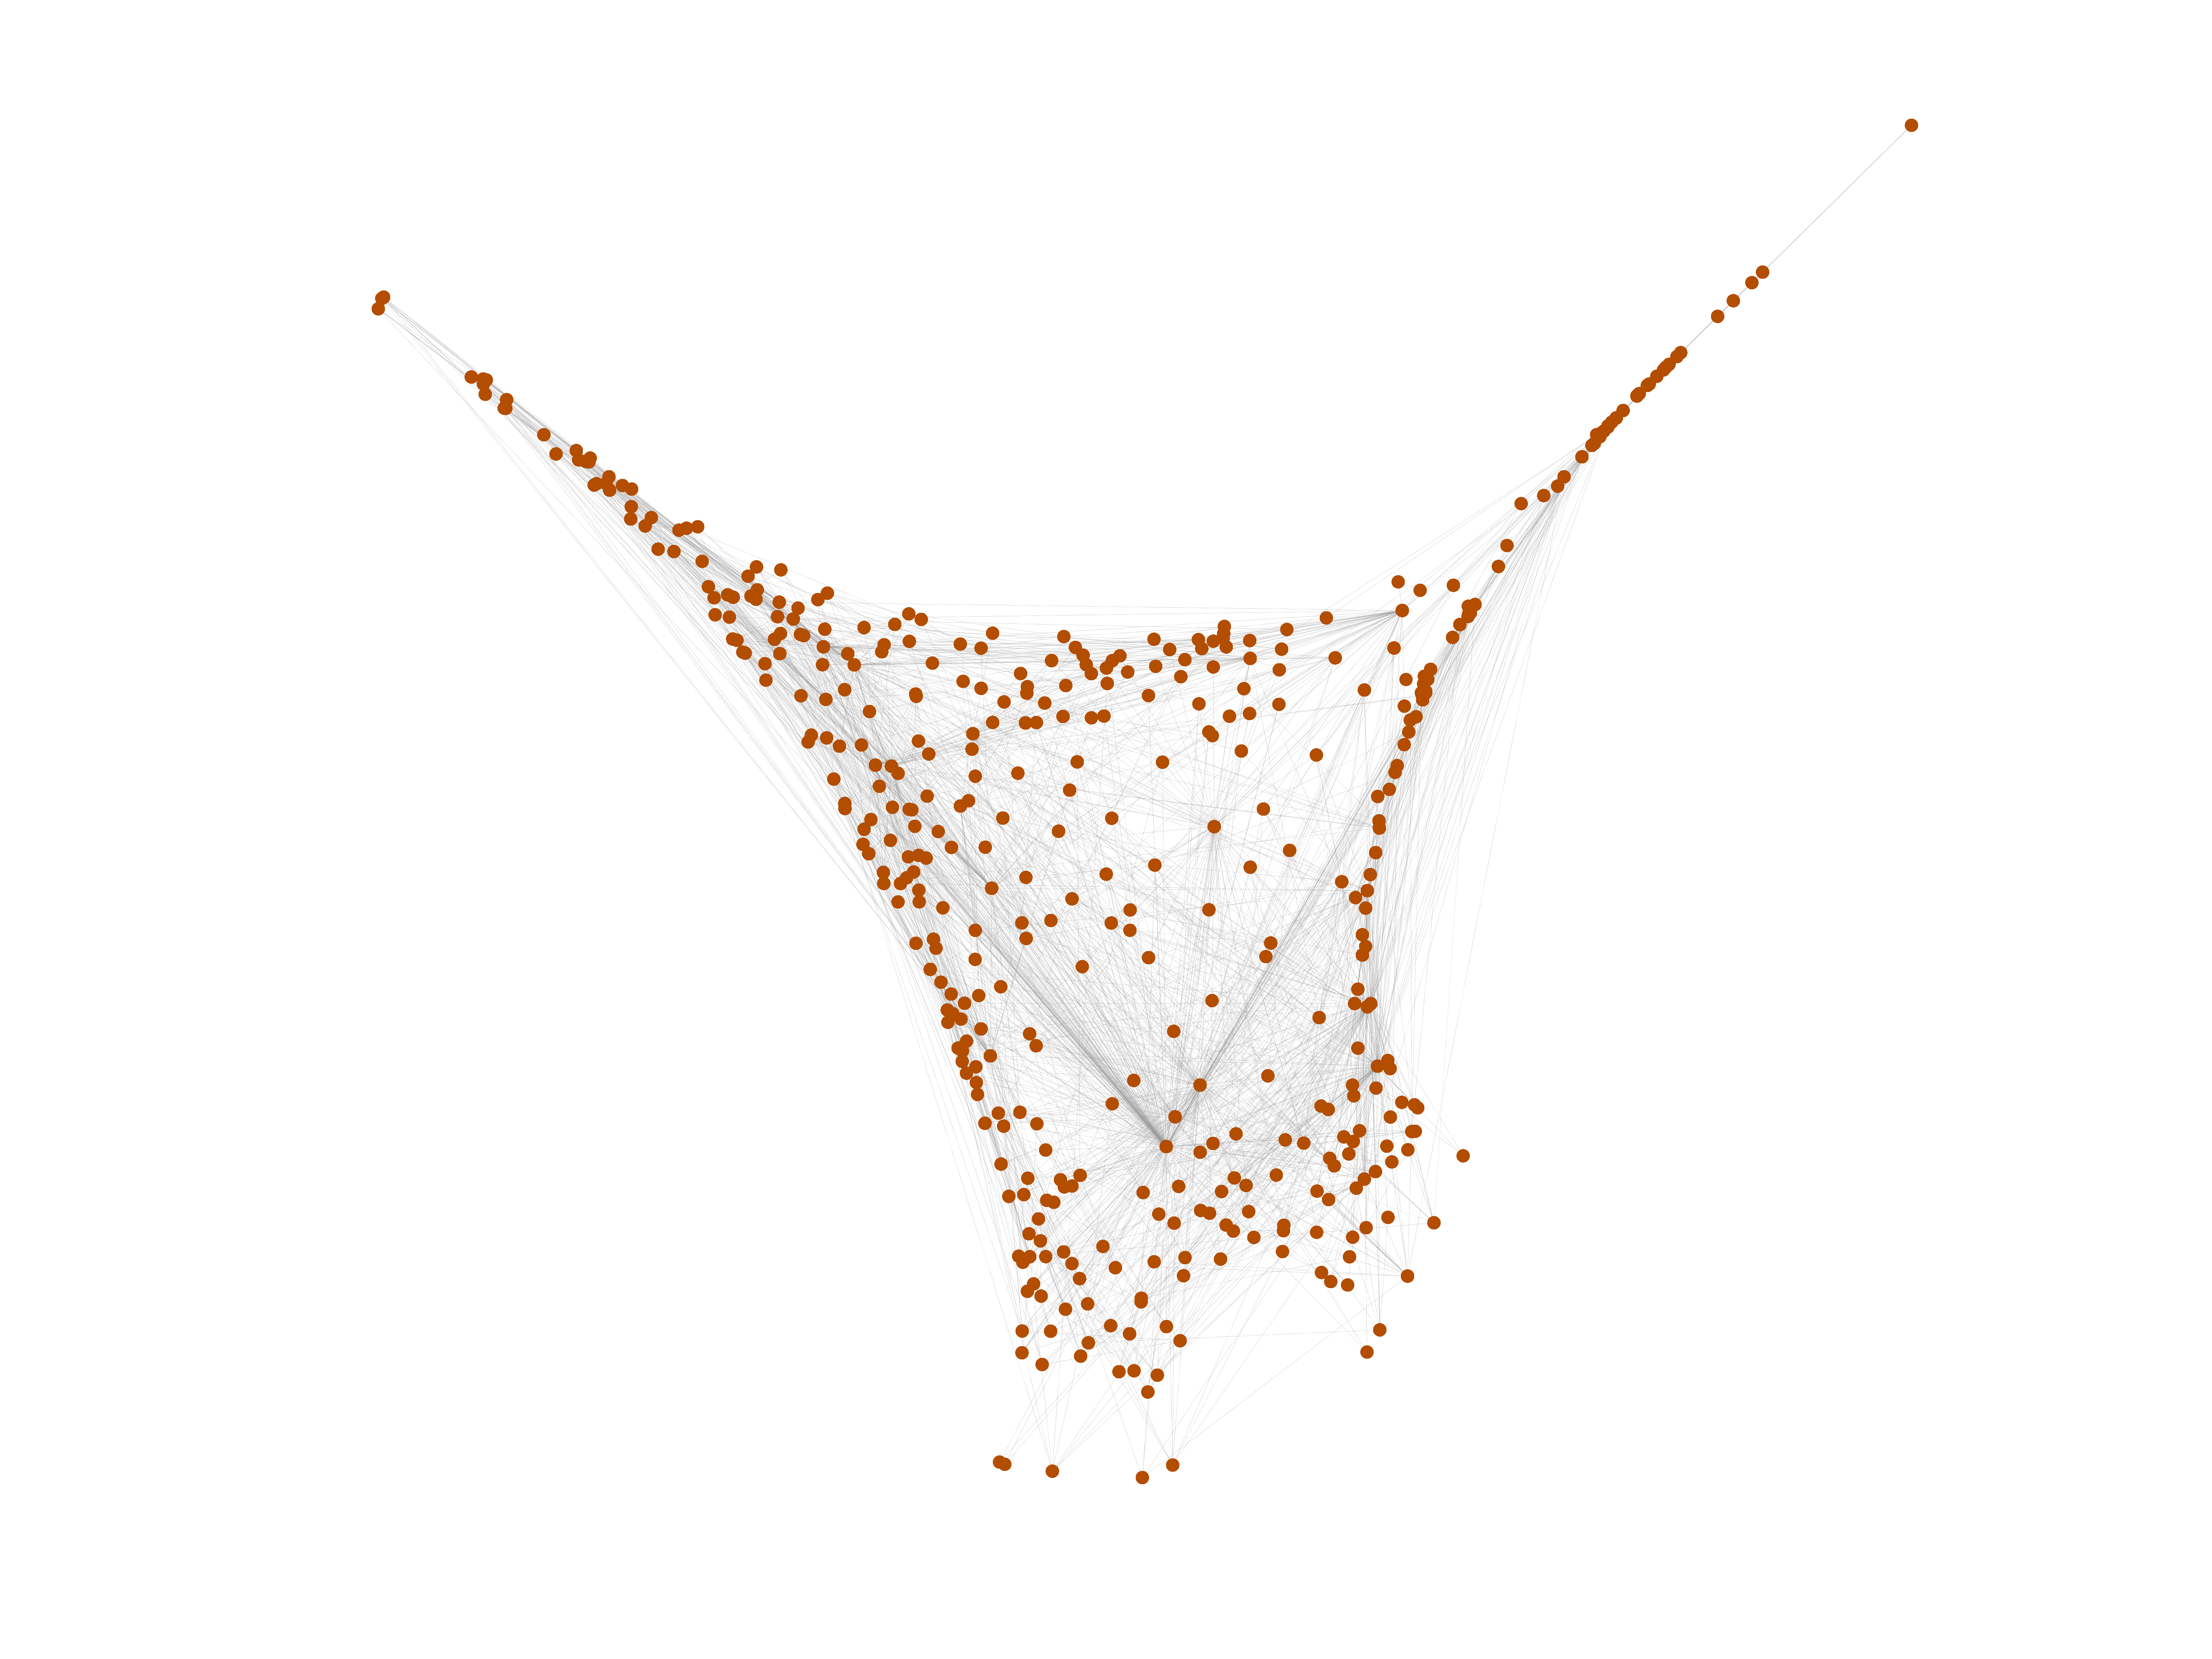
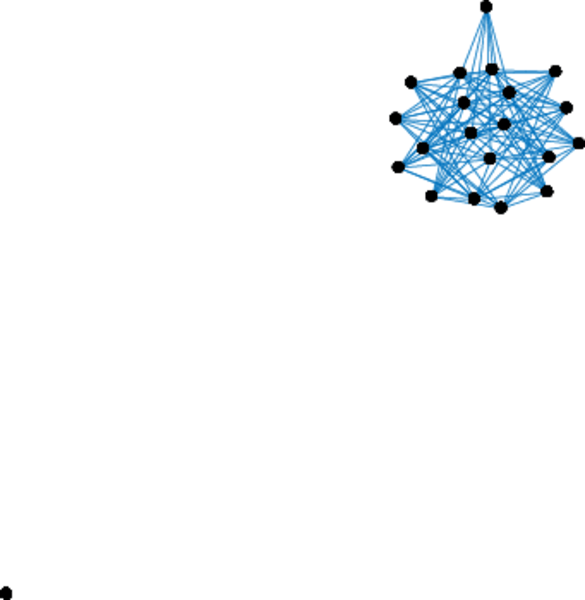
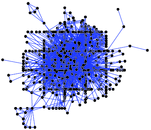
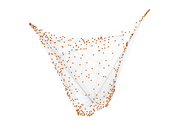
This is the metabolic network of the roundworm Caenorhabditis elegans.
Nodes are metabolites (e.g., proteins), and edges are interactions between
them. Since a metabolite can iteract with itself, the network contains loops.
The interactions are undirected. There may be multiple interactions between
any two metabolites.
Metadata
Statistics
| Size | n = | 453
|
| Volume | m = | 4,596
|
| Unique edge count | m̿ = | 2,040
|
| Loop count | l = | 22
|
| Wedge count | s = | 79,173
|
| Claw count | z = | 3,352,172
|
| Cross count | x = | 153,983,040
|
| Triangle count | t = | 3,284
|
| Square count | q = | 50,289
|
| 4-Tour count | T4 = | 723,054
|
| Maximum degree | dmax = | 639
|
| Average degree | d = | 20.291 4
|
| Fill | p = | 0.019 838 4
|
| Average edge multiplicity | m̃ = | 2.252 94
|
| Size of LCC | N = | 453
|
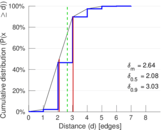
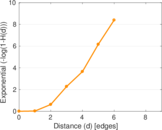
| Diameter | δ = | 7
|
| 50-Percentile effective diameter | δ0.5 = | 2.081 97
|
| 90-Percentile effective diameter | δ0.9 = | 3.033 51
|
| Median distance | δM = | 3
|
| Mean distance | δm = | 2.641 74
|
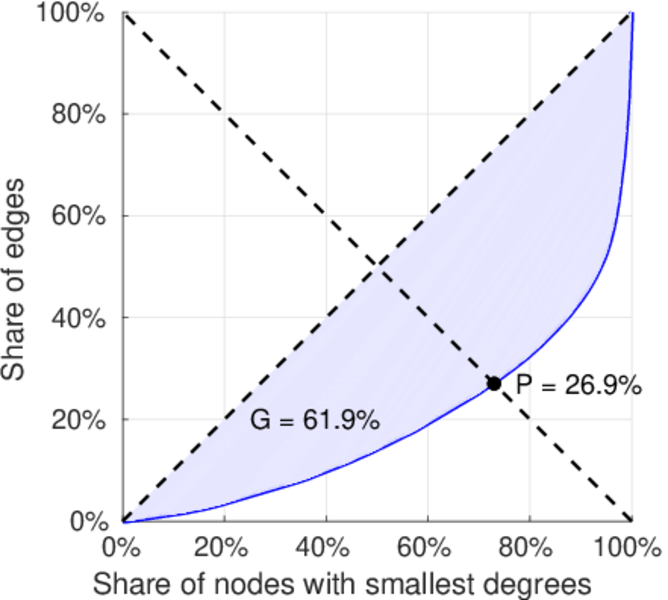
| Gini coefficient | G = | 0.619 161
|
| Balanced inequality ratio | P = | 0.268 712
|
| Relative edge distribution entropy | Her = | 0.898 868
|
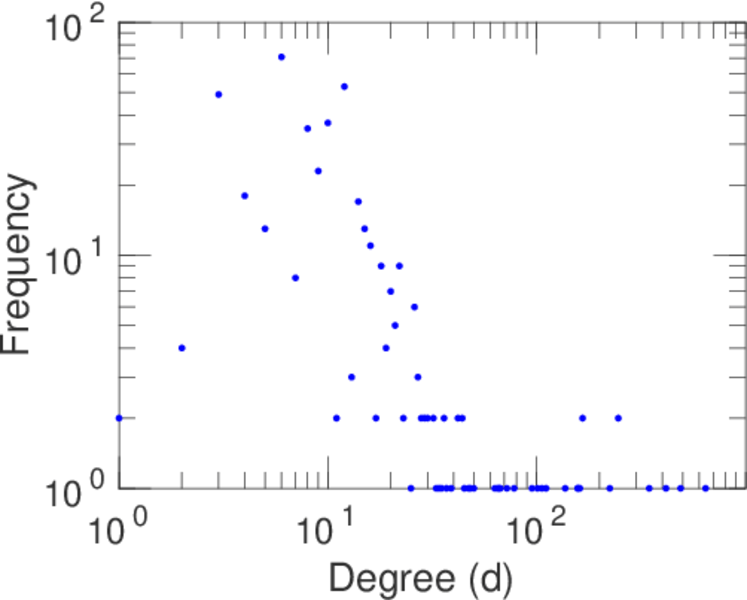
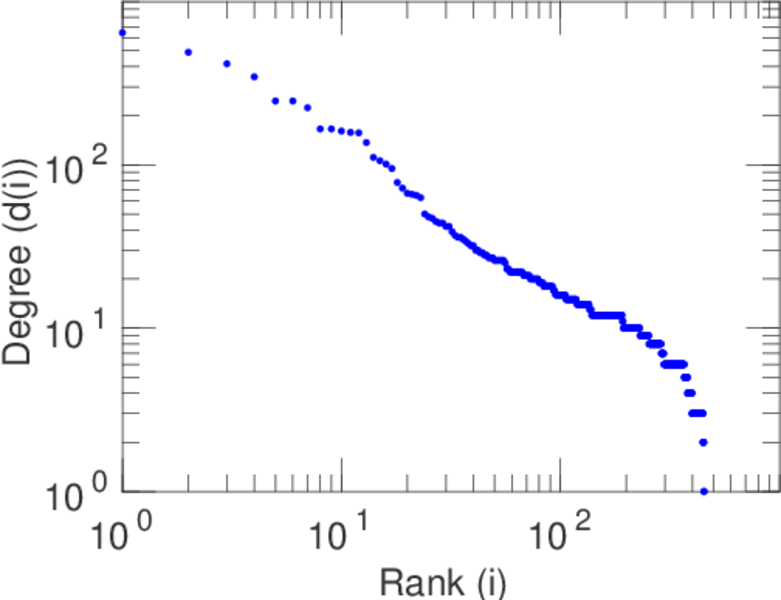
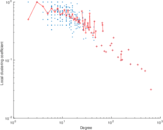
| Power law exponent | γ = | 1.563 30
|
| Tail power law exponent | γt = | 2.621 00
|
| Tail power law exponent with p | γ3 = | 2.621 00
|
| p-value | p = | 0.125 000
|
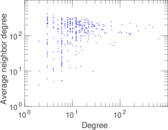
| Degree assortativity | ρ = | −0.225 821
|
| Degree assortativity p-value | pρ = | 5.419 17 × 10−48
|
| Clustering coefficient | c = | 0.124 436
|
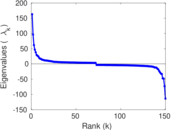
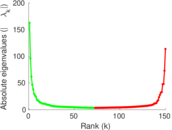
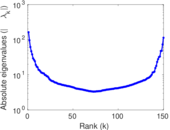
| Spectral norm | α = | 162.930
|
| Algebraic connectivity | a = | 0.264 802
|
| Spectral separation | |λ1[A] / λ2[A]| = | 1.432 48
|
| Non-bipartivity | bA = | 0.301 910
|
| Normalized non-bipartivity | bN = | 0.200 552
|
| Algebraic non-bipartivity | χ = | 0.293 559
|
| Spectral bipartite frustration | bK = | 0.008 148 41
|
| Controllability | C = | 8
|
| Relative controllability | Cr = | 0.017 660 0
|
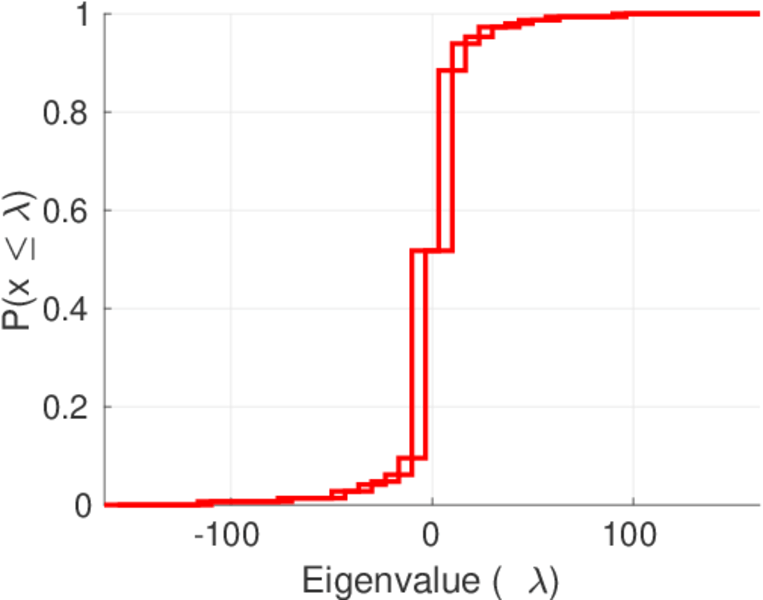
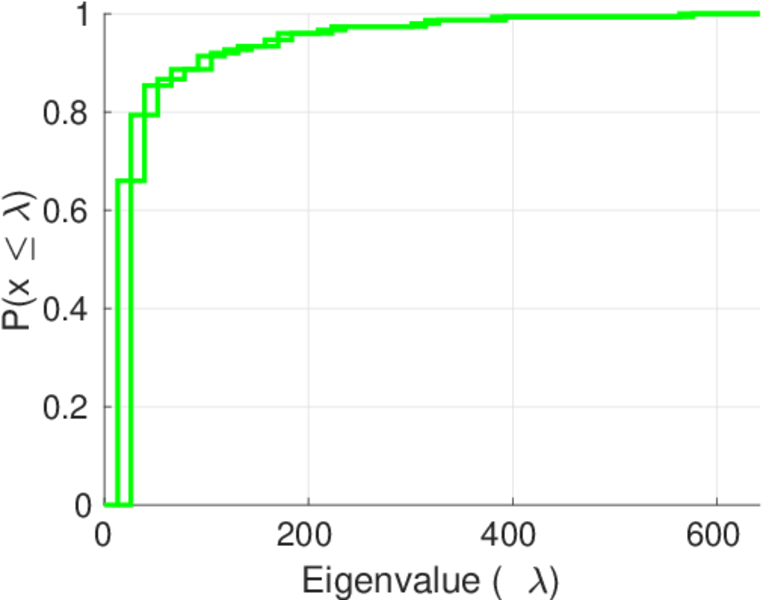
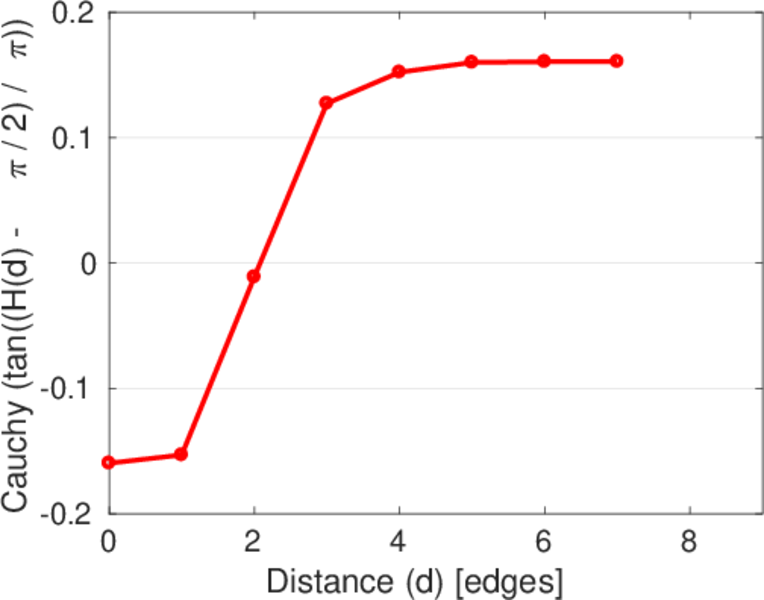
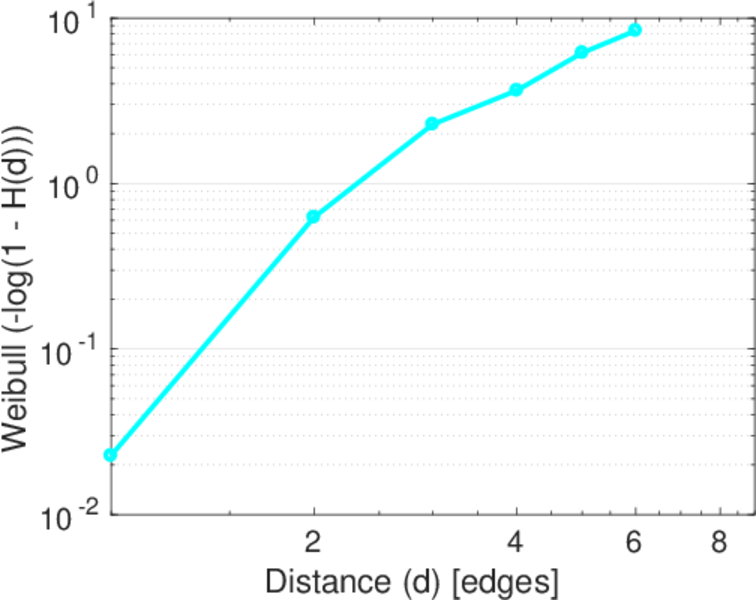
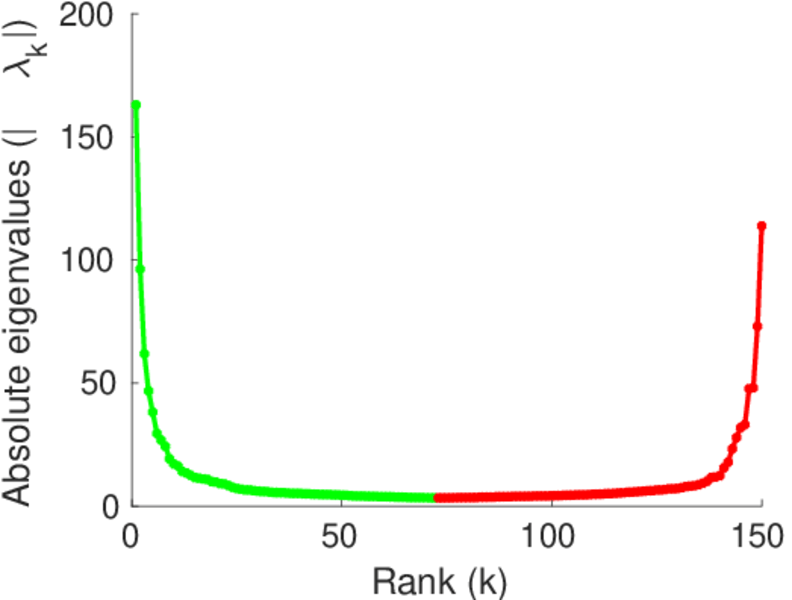
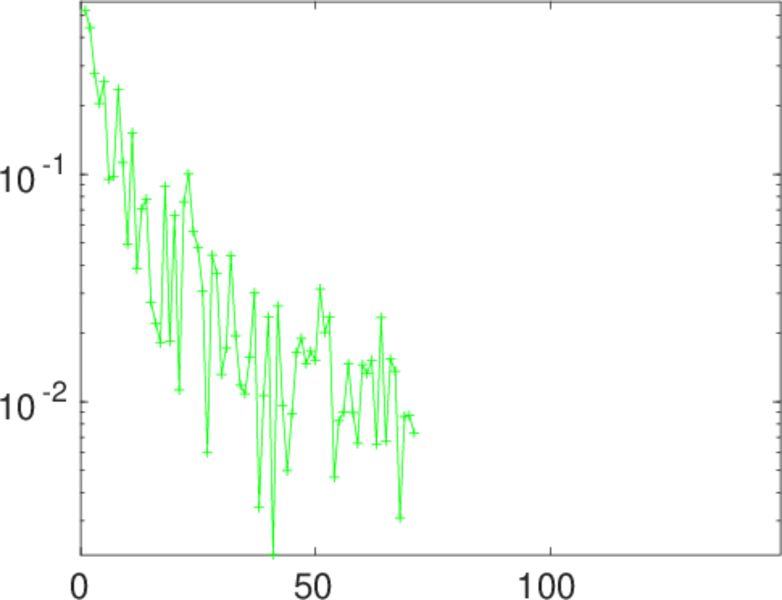
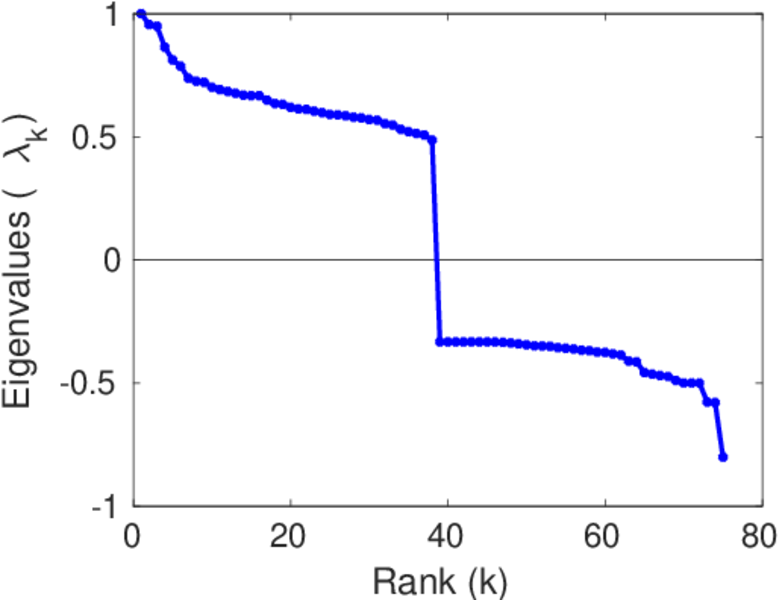
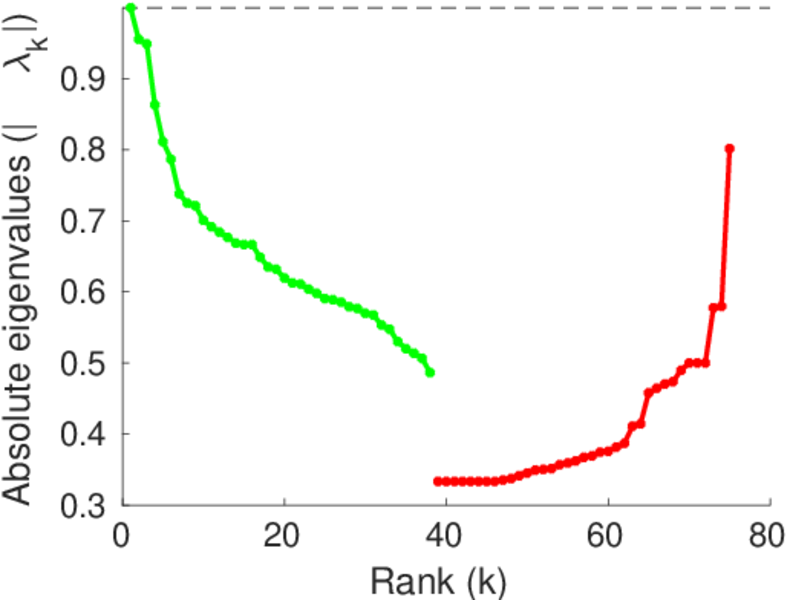
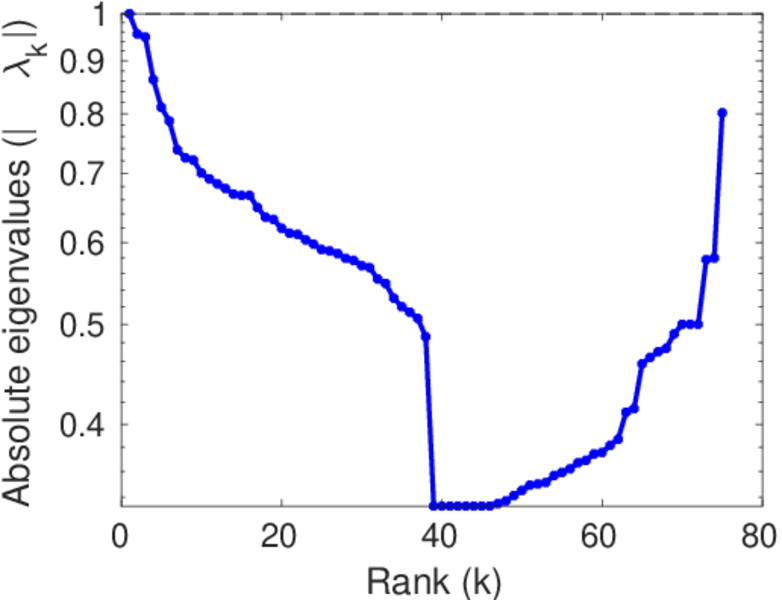
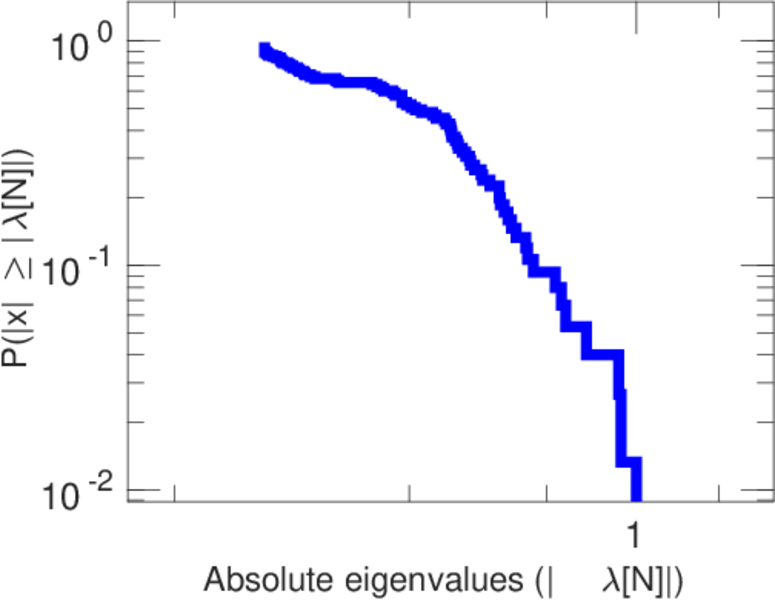
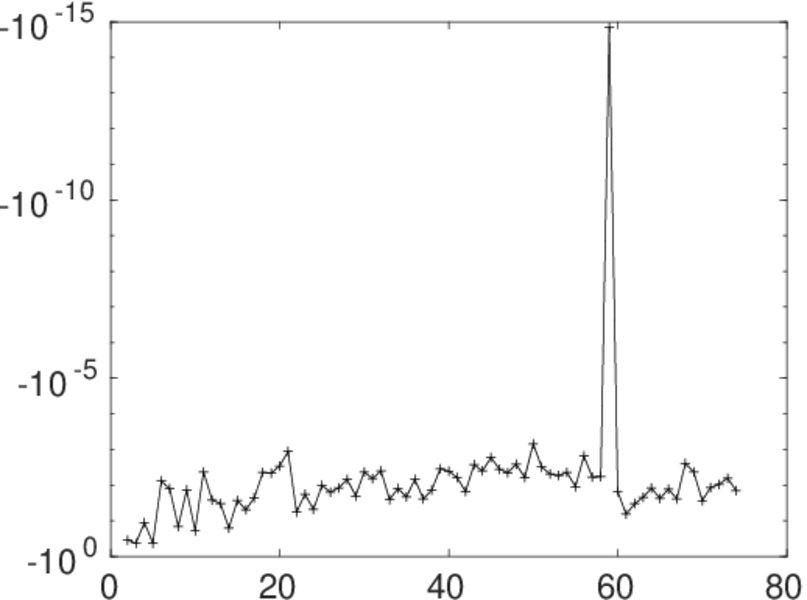
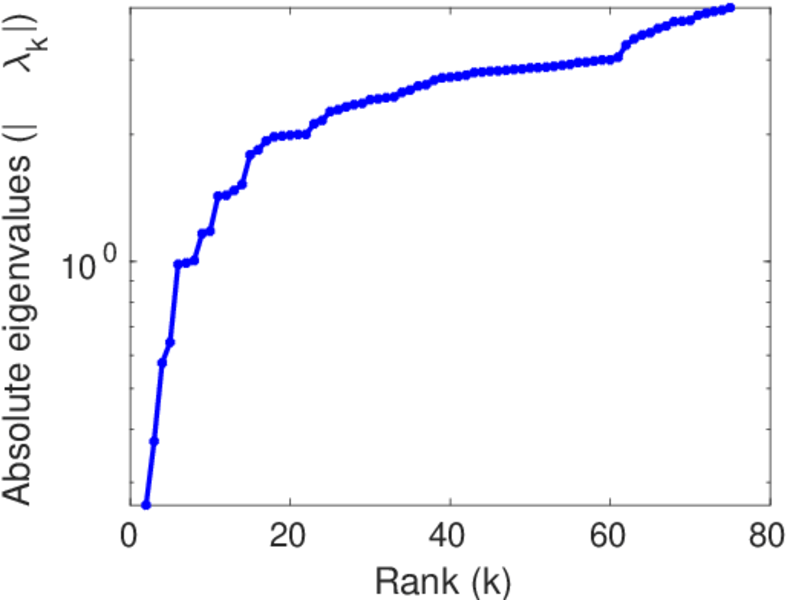
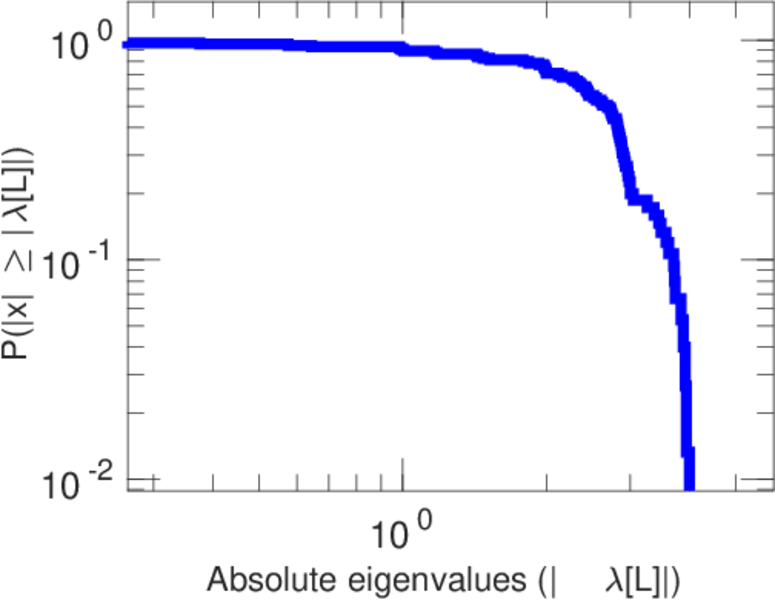
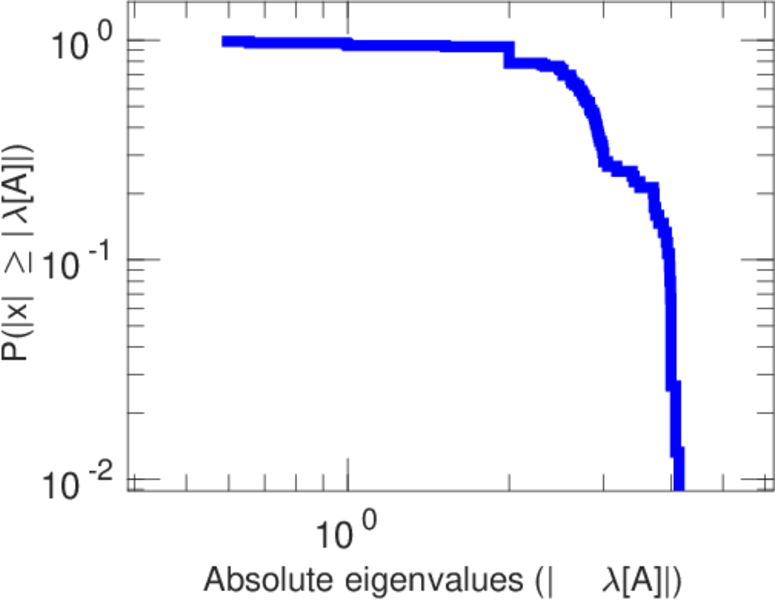
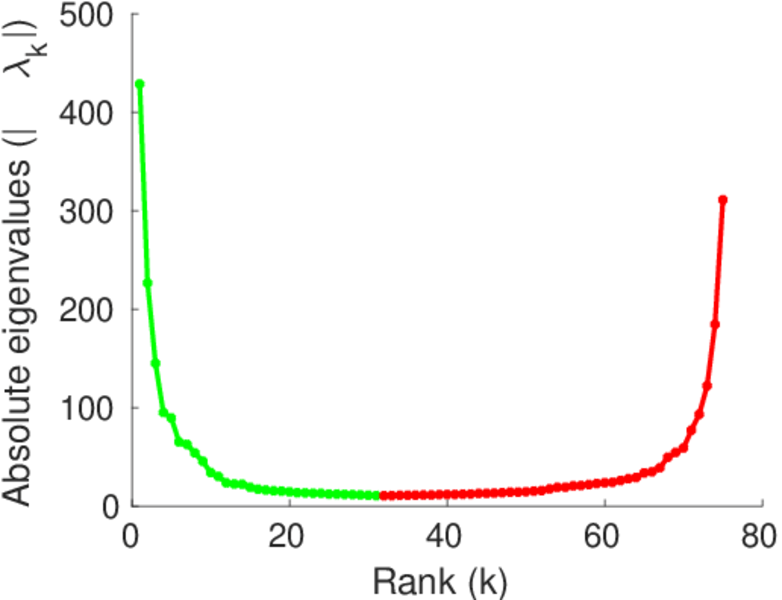
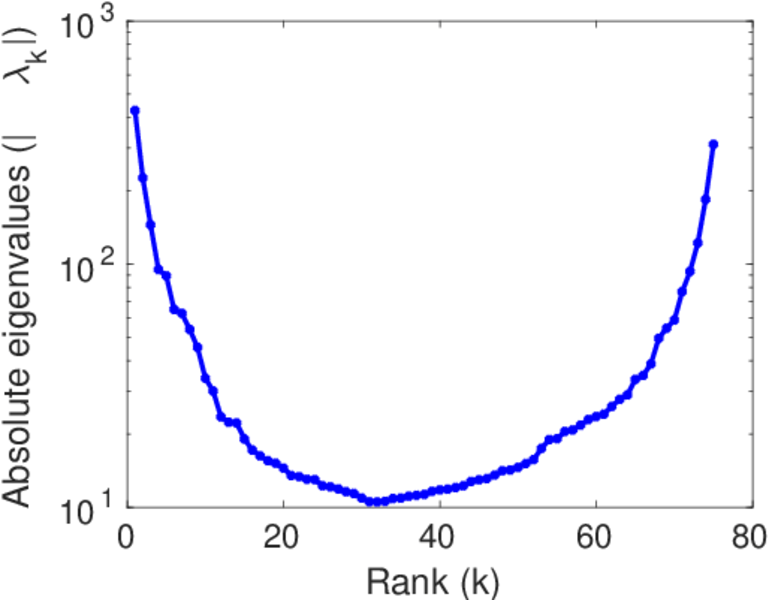
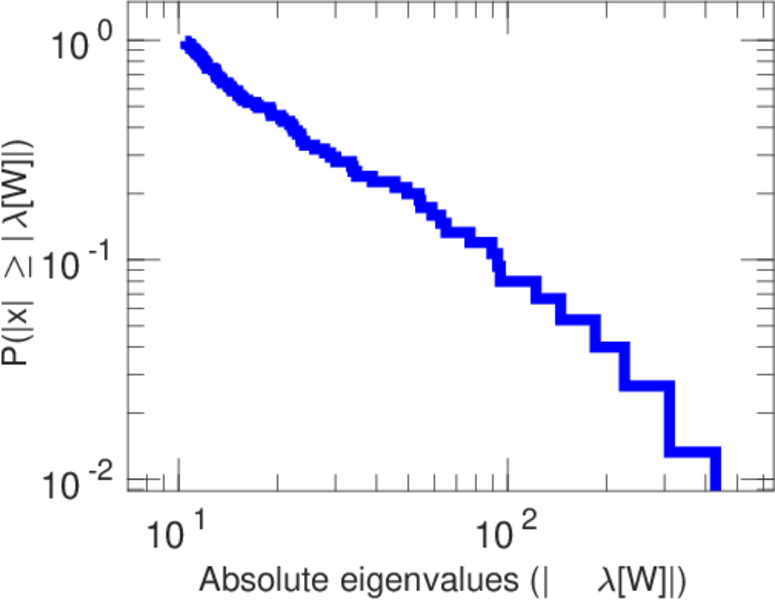
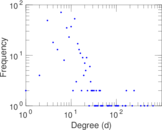
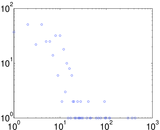
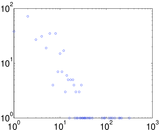
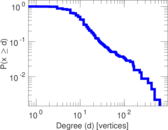
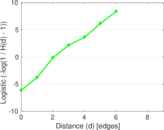
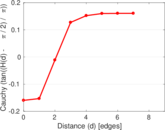
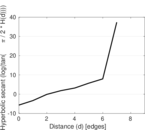
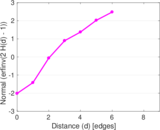
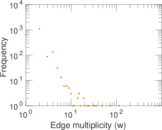
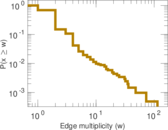
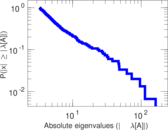
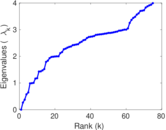
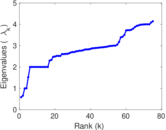
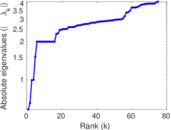
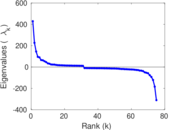
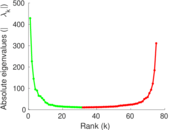
Plots

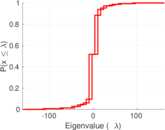
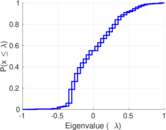
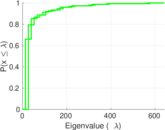
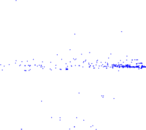


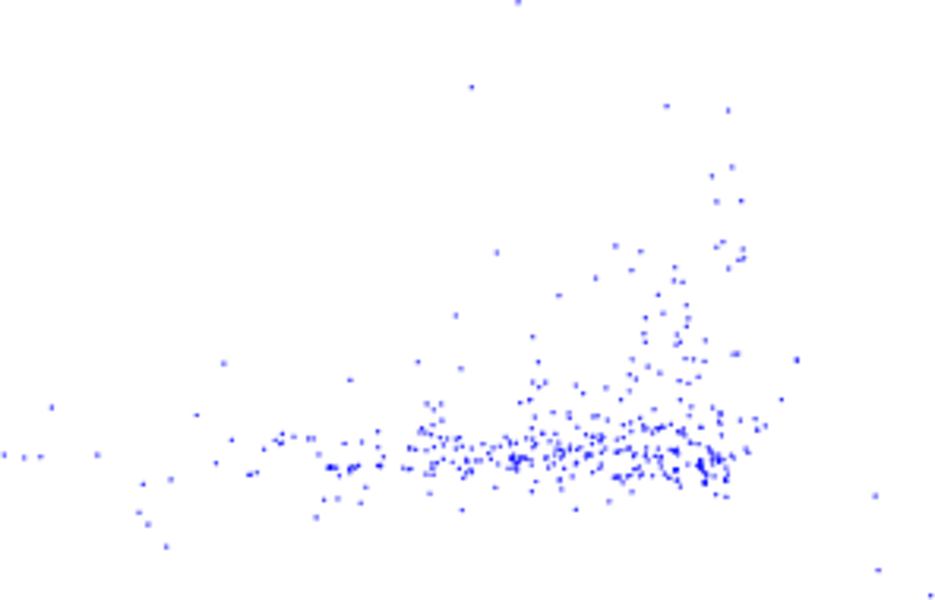
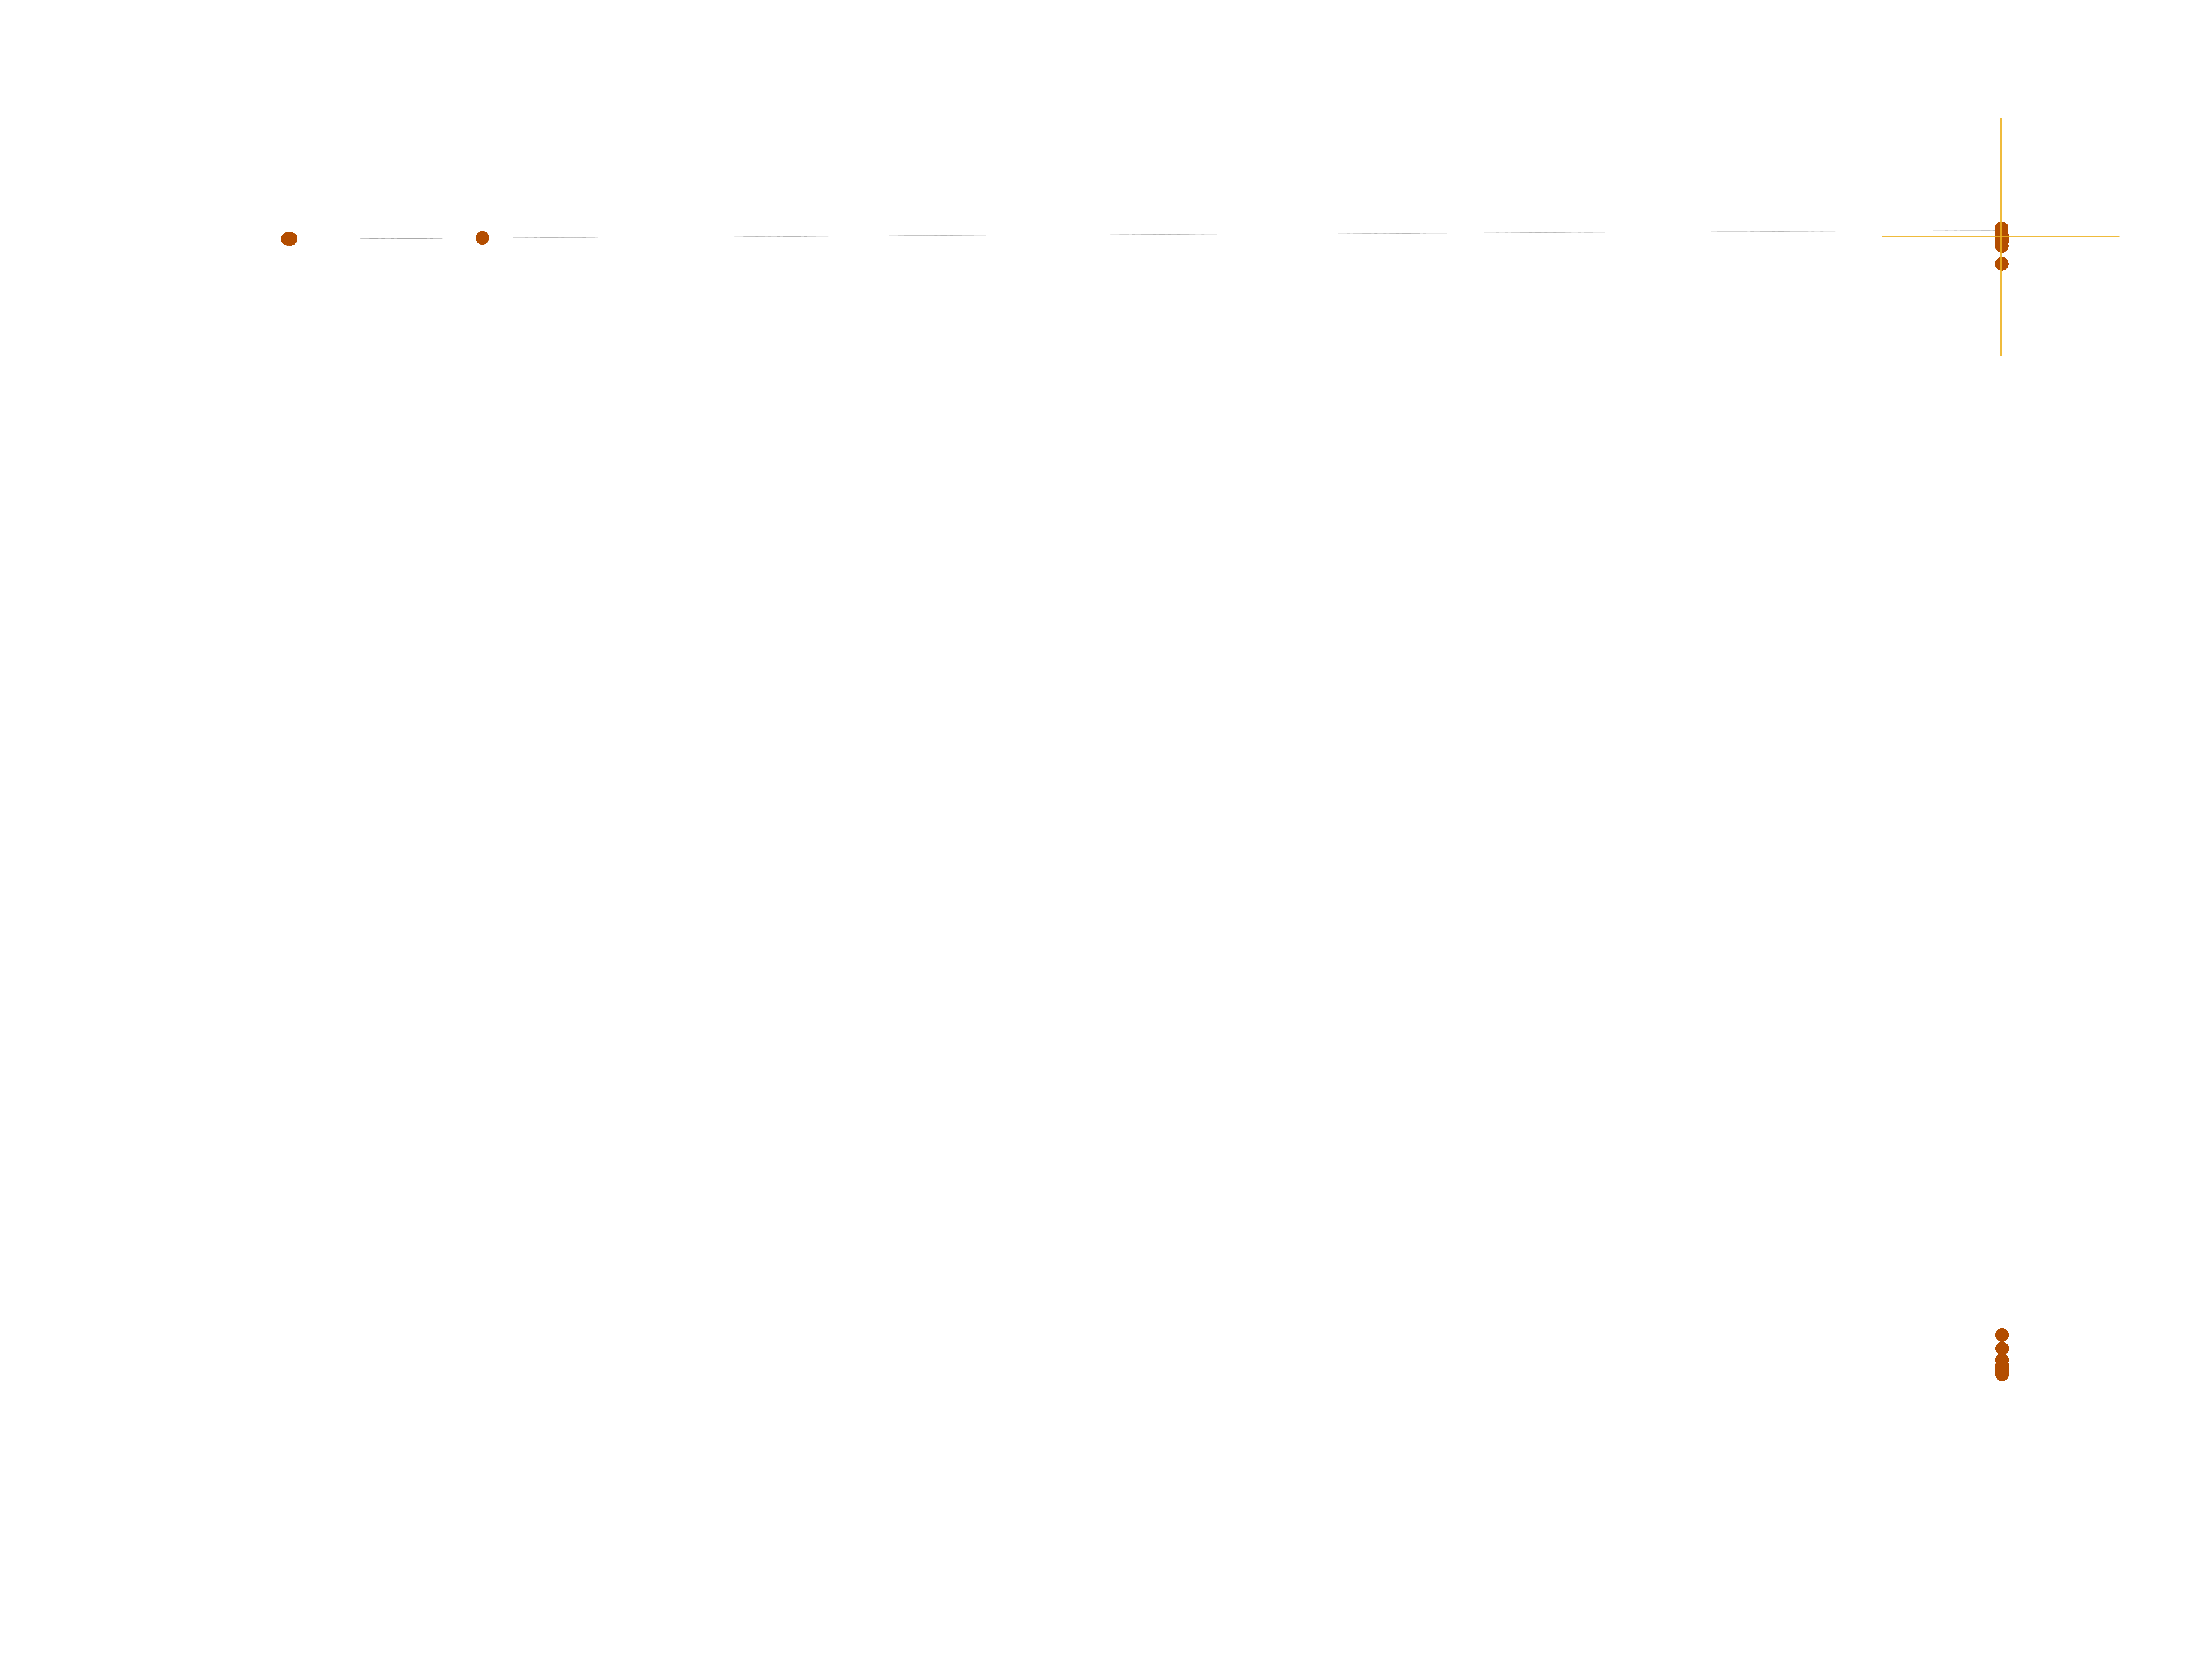
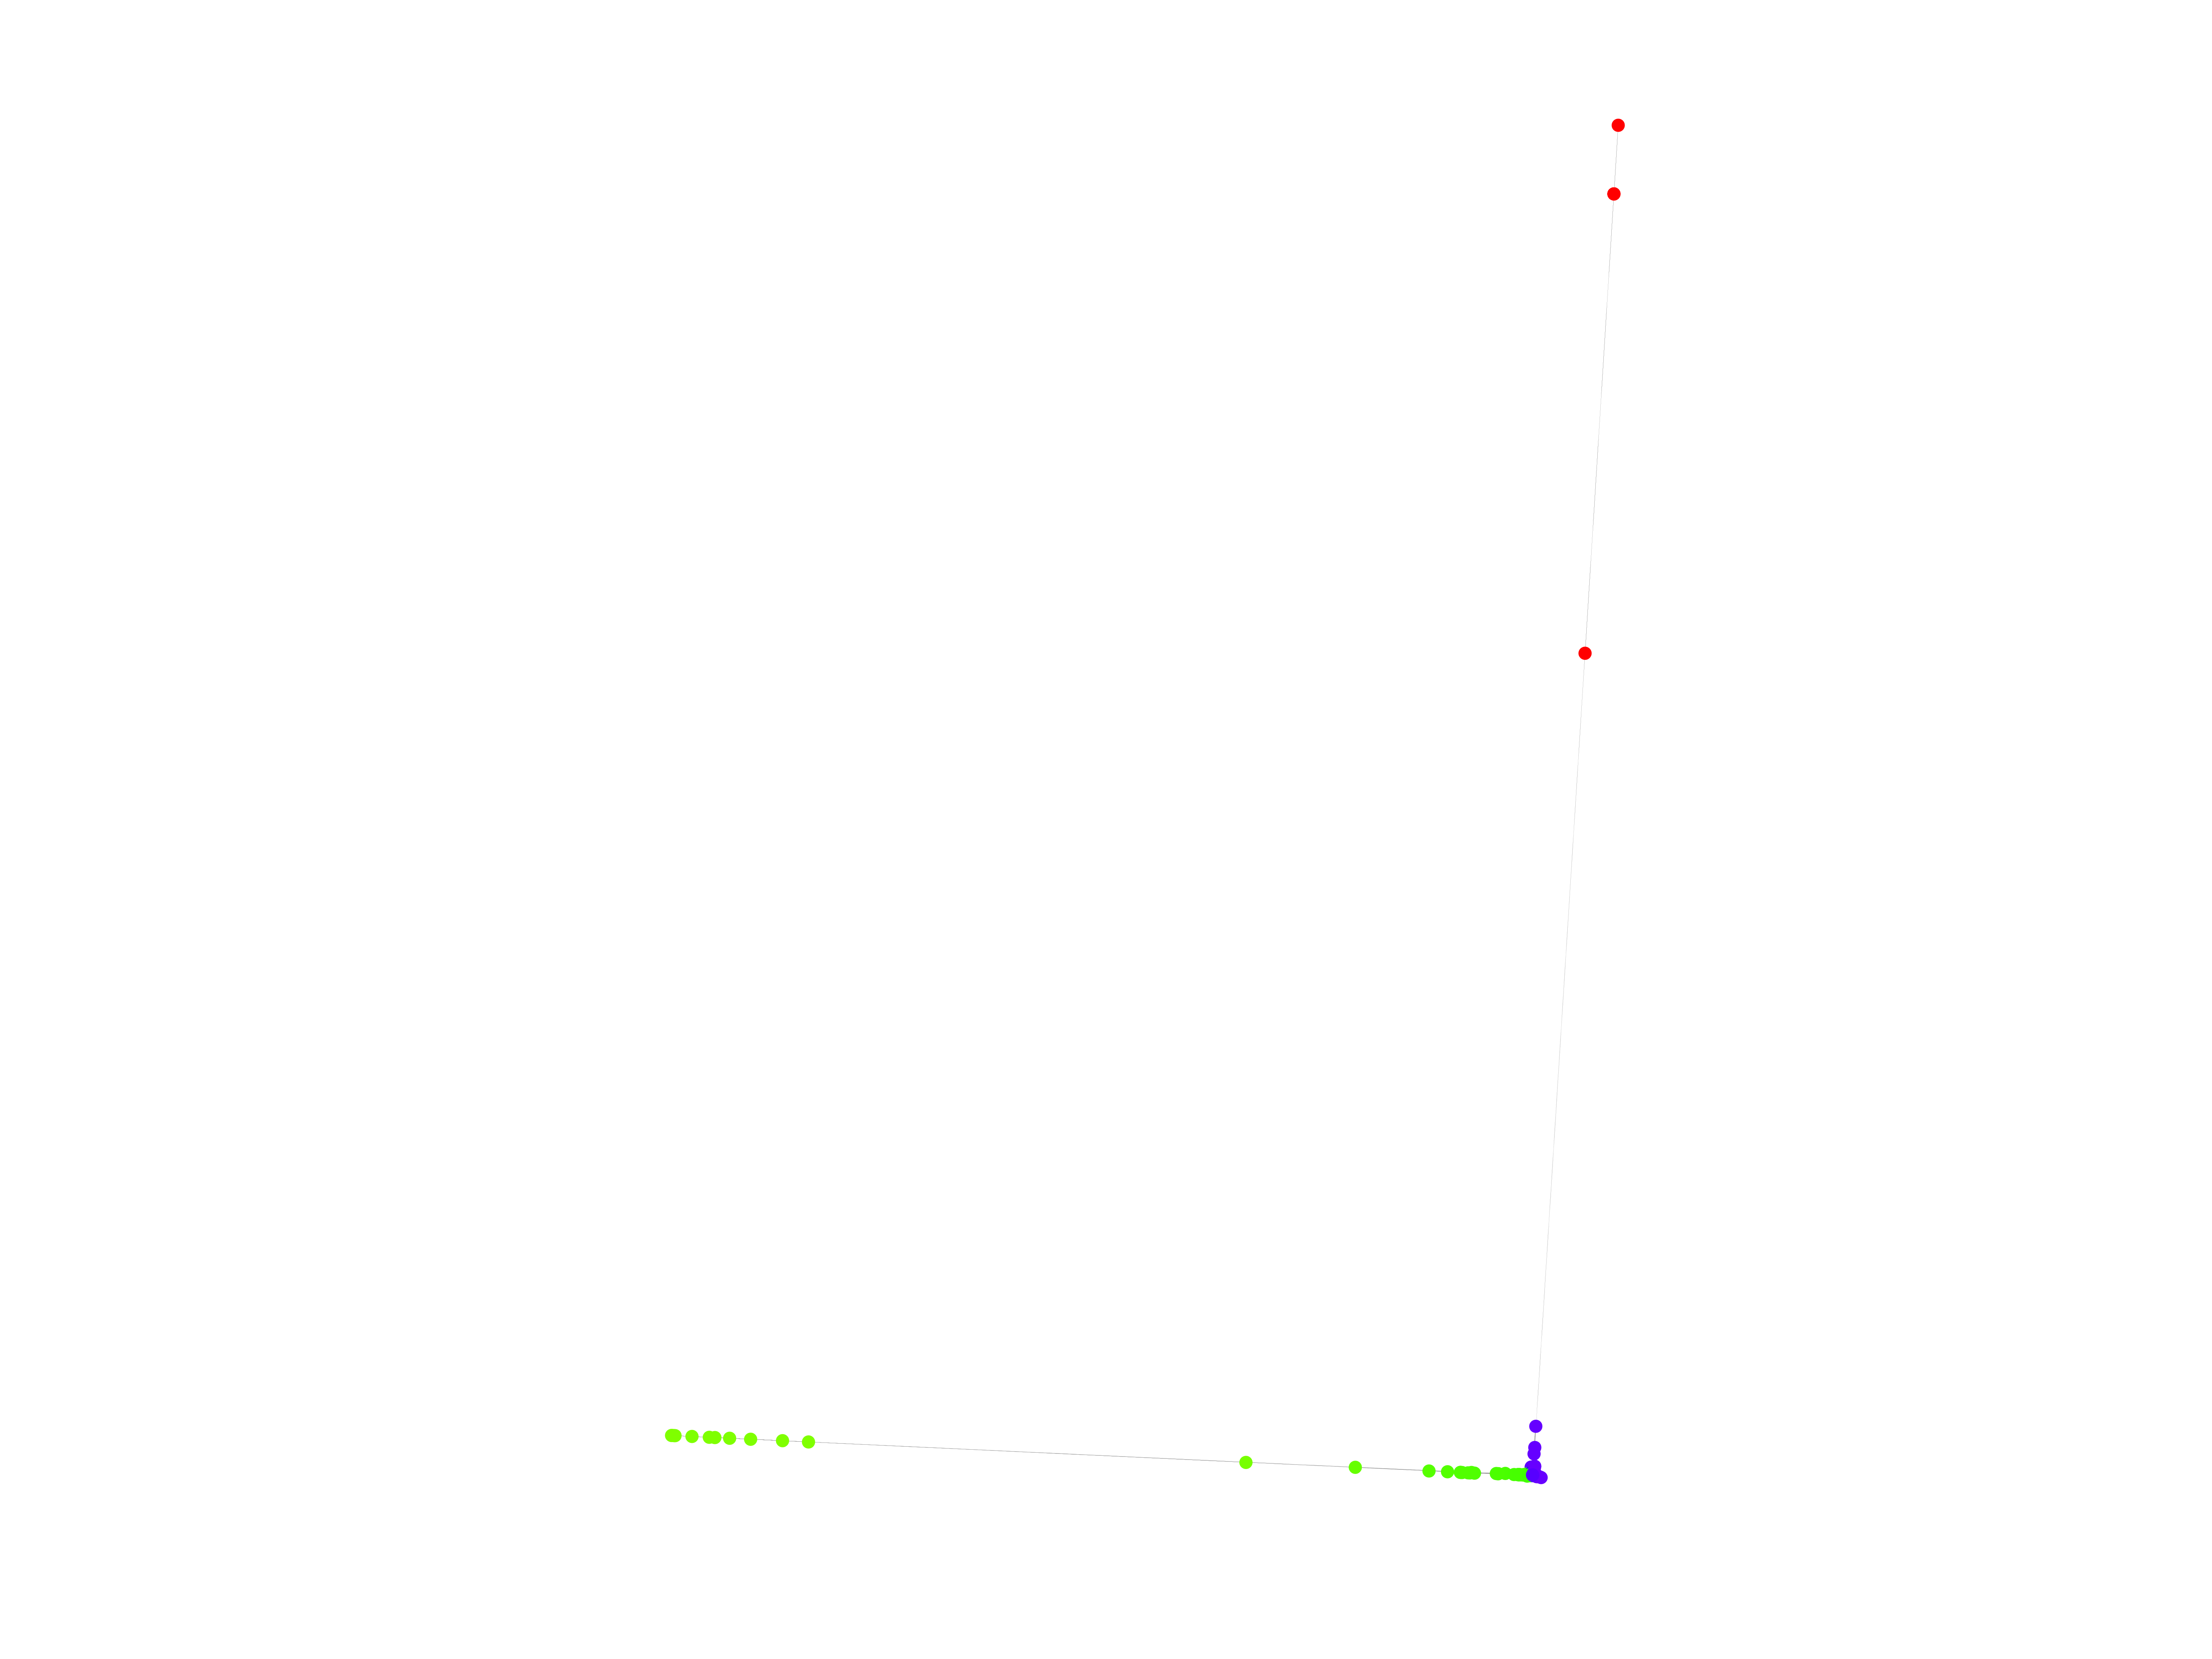
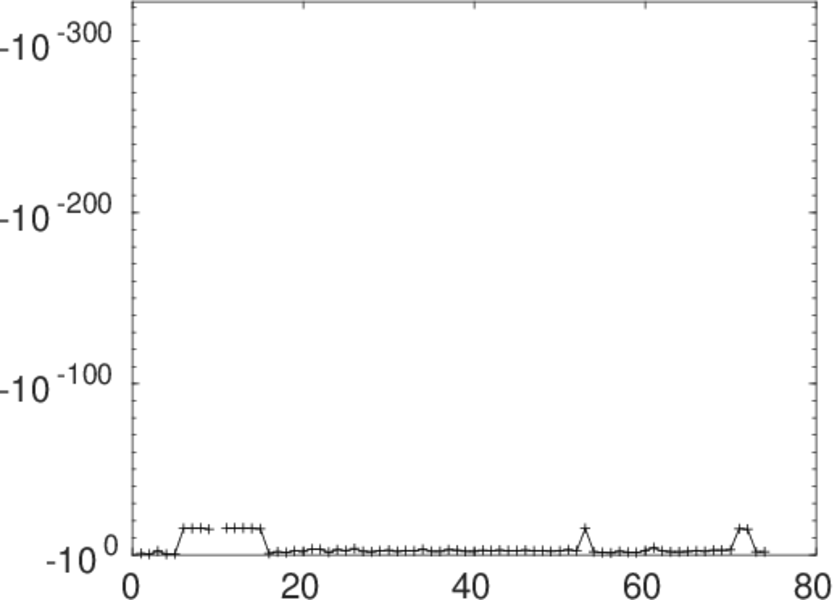
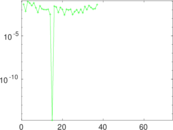
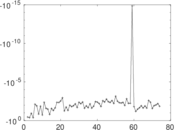
Matrix decompositions plots


Downloads
References
|
[1]
|
Jérôme Kunegis.
KONECT – The Koblenz Network Collection.
In Proc. Int. Conf. on World Wide Web Companion, pages
1343–1350, 2013.
[ http ]
|
|
[2]
|
Jordi Duch and Alex Arenas.
Community detection in complex networks using extremal optimization.
Phys. Rev. E, 72(2):027104, 2005.
|
 KONECT ‣ Networks ‣
Buy Me a Coffee
KONECT ‣ Networks ‣
Buy Me a Coffee