Pretty Good Privacy
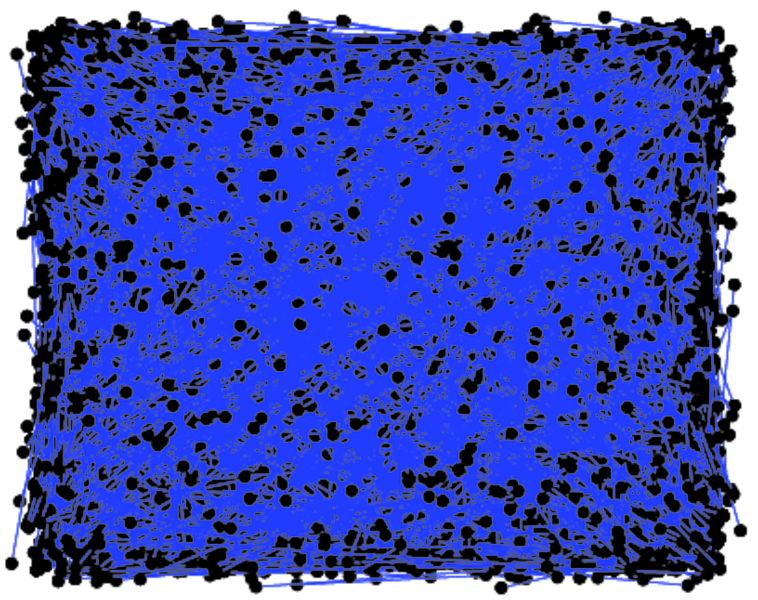
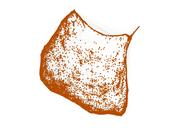
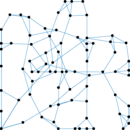
This is the interaction network of users of the Pretty Good Privacy (PGP)
algorithm. The network contains only the giant connected component of the
network.
Metadata
Statistics
| Size | n = | 10,680
|
| Volume | m = | 24,316
|
| Loop count | l = | 0
|
| Wedge count | s = | 434,797
|
| Claw count | z = | 7,501,208
|
| Cross count | x = | 180,494,388
|
| Triangle count | t = | 54,788
|
| Square count | q = | 1,010,957
|
| 4-Tour count | T4 = | 9,875,476
|
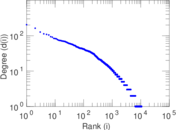
| Maximum degree | dmax = | 205
|
| Average degree | d = | 4.553 56
|
| Fill | p = | 0.000 426 403
|
| Size of LCC | N = | 10,680
|
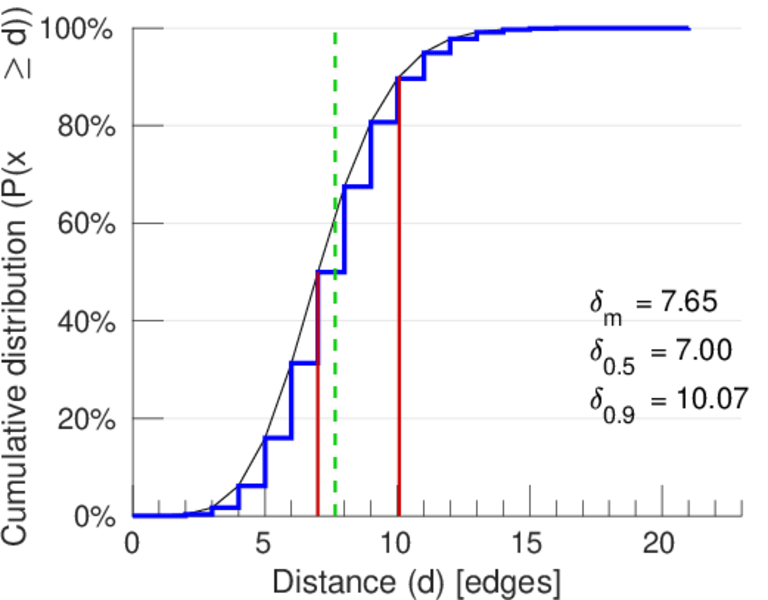
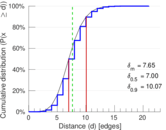
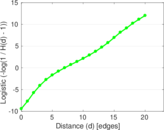
| Diameter | δ = | 24
|
| 50-Percentile effective diameter | δ0.5 = | 7.001 33
|
| 90-Percentile effective diameter | δ0.9 = | 10.069 9
|
| Median distance | δM = | 8
|
| Mean distance | δm = | 7.652 86
|
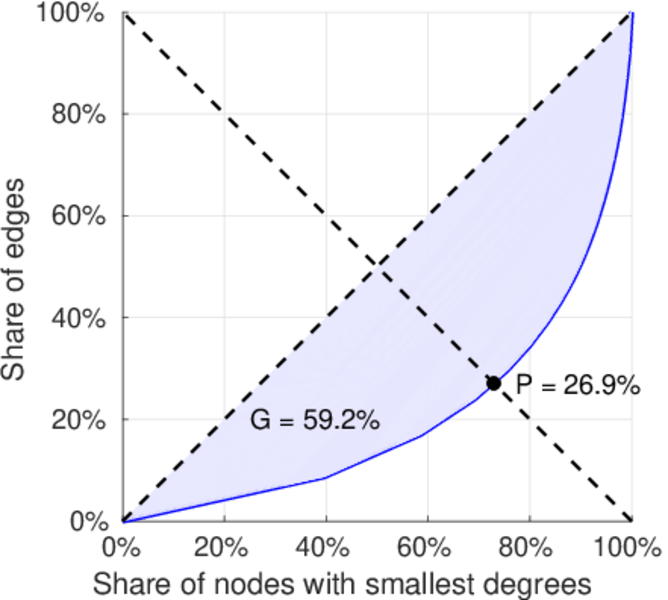
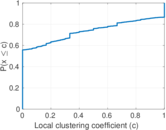
| Gini coefficient | G = | 0.591 824
|
| Balanced inequality ratio | P = | 0.269 329
|
| Relative edge distribution entropy | Her = | 0.921 894
|
| Power law exponent | γ = | 2.109 16
|
| Tail power law exponent | γt = | 4.261 00
|
| Tail power law exponent with p | γ3 = | 4.261 00
|
| p-value | p = | 0.576 000
|
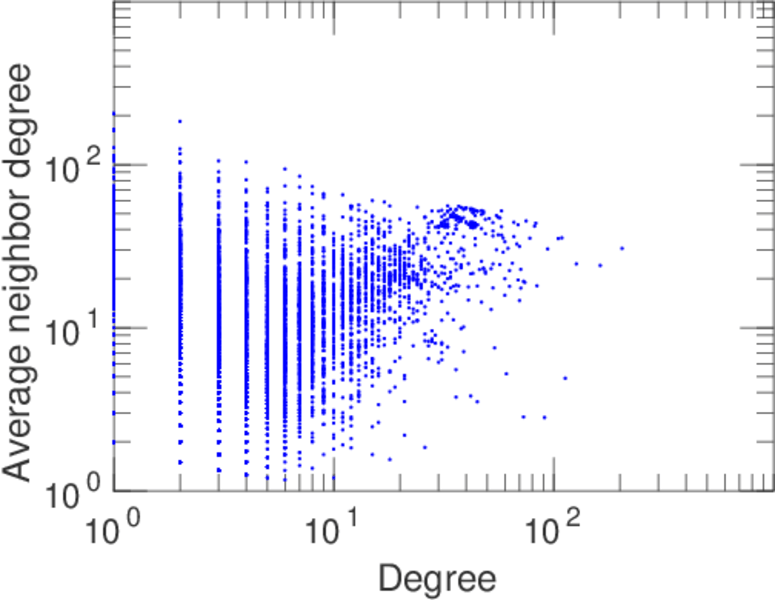
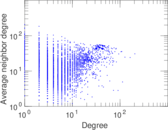
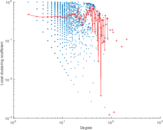
| Degree assortativity | ρ = | +0.238 211
|
| Degree assortativity p-value | pρ = | 0.000 00
|
| Clustering coefficient | c = | 0.378 025
|
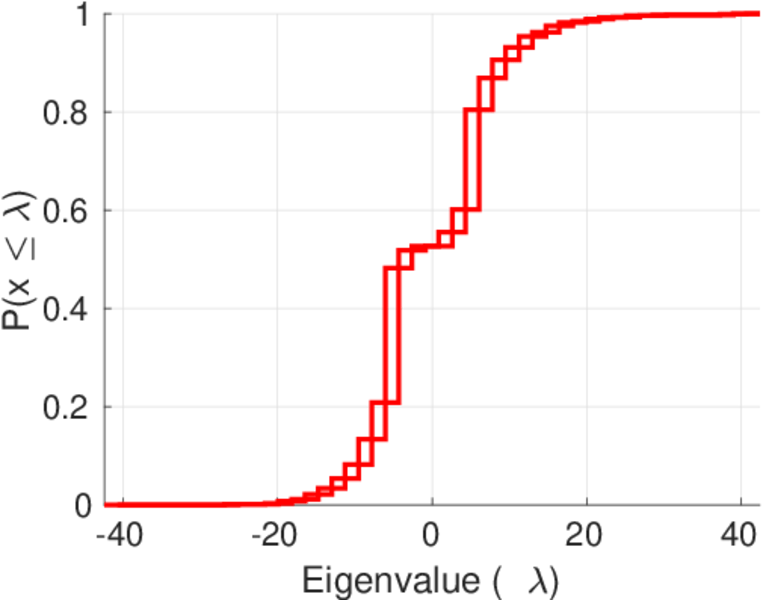
| Spectral norm | α = | 42.435 5
|
| Algebraic connectivity | a = | 0.011 160 4
|
| Spectral separation | |λ1[A] / λ2[A]| = | 1.111 38
|
| Non-bipartivity | bA = | 0.716 478
|
| Normalized non-bipartivity | bN = | 0.009 900 92
|
| Algebraic non-bipartivity | χ = | 0.018 345 5
|
| Spectral bipartite frustration | bK = | 0.001 007 21
|
| Controllability | C = | 2,666
|
| Relative controllability | Cr = | 0.249 625
|
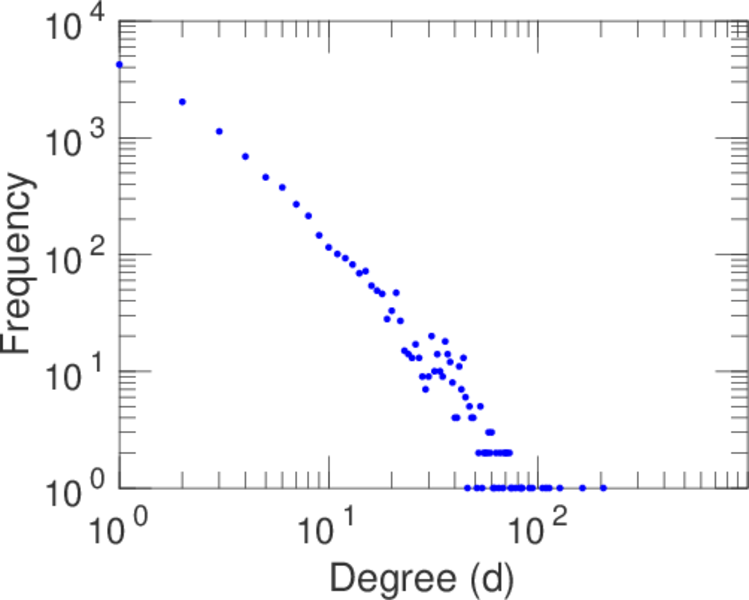
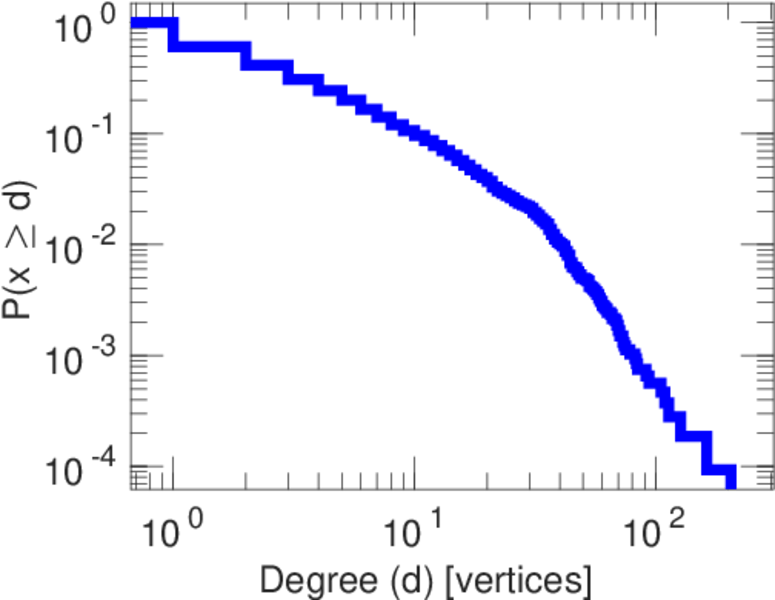
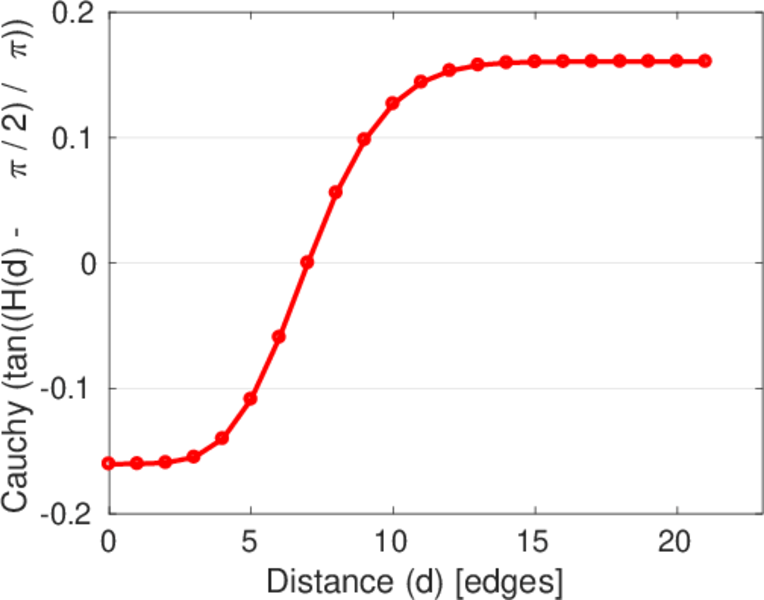
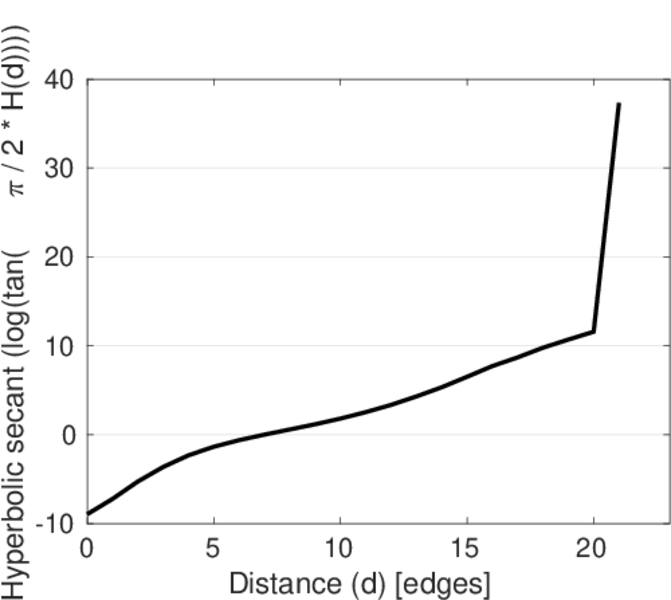
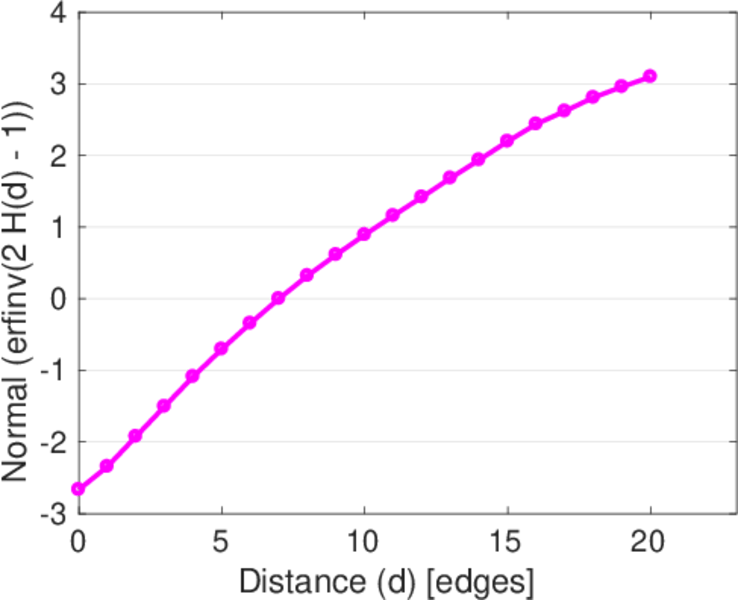
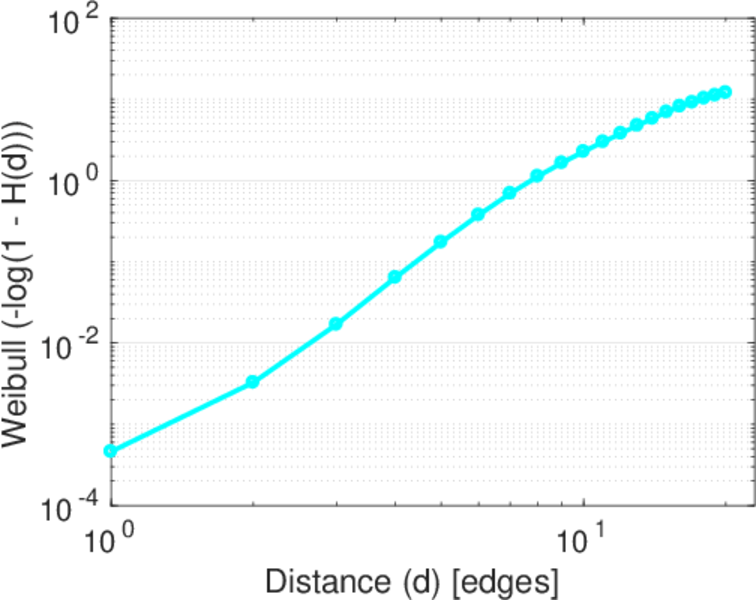
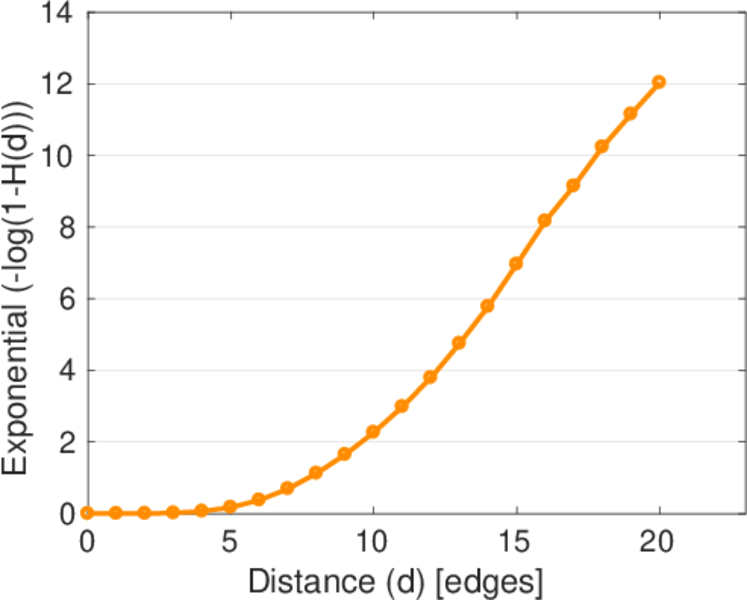
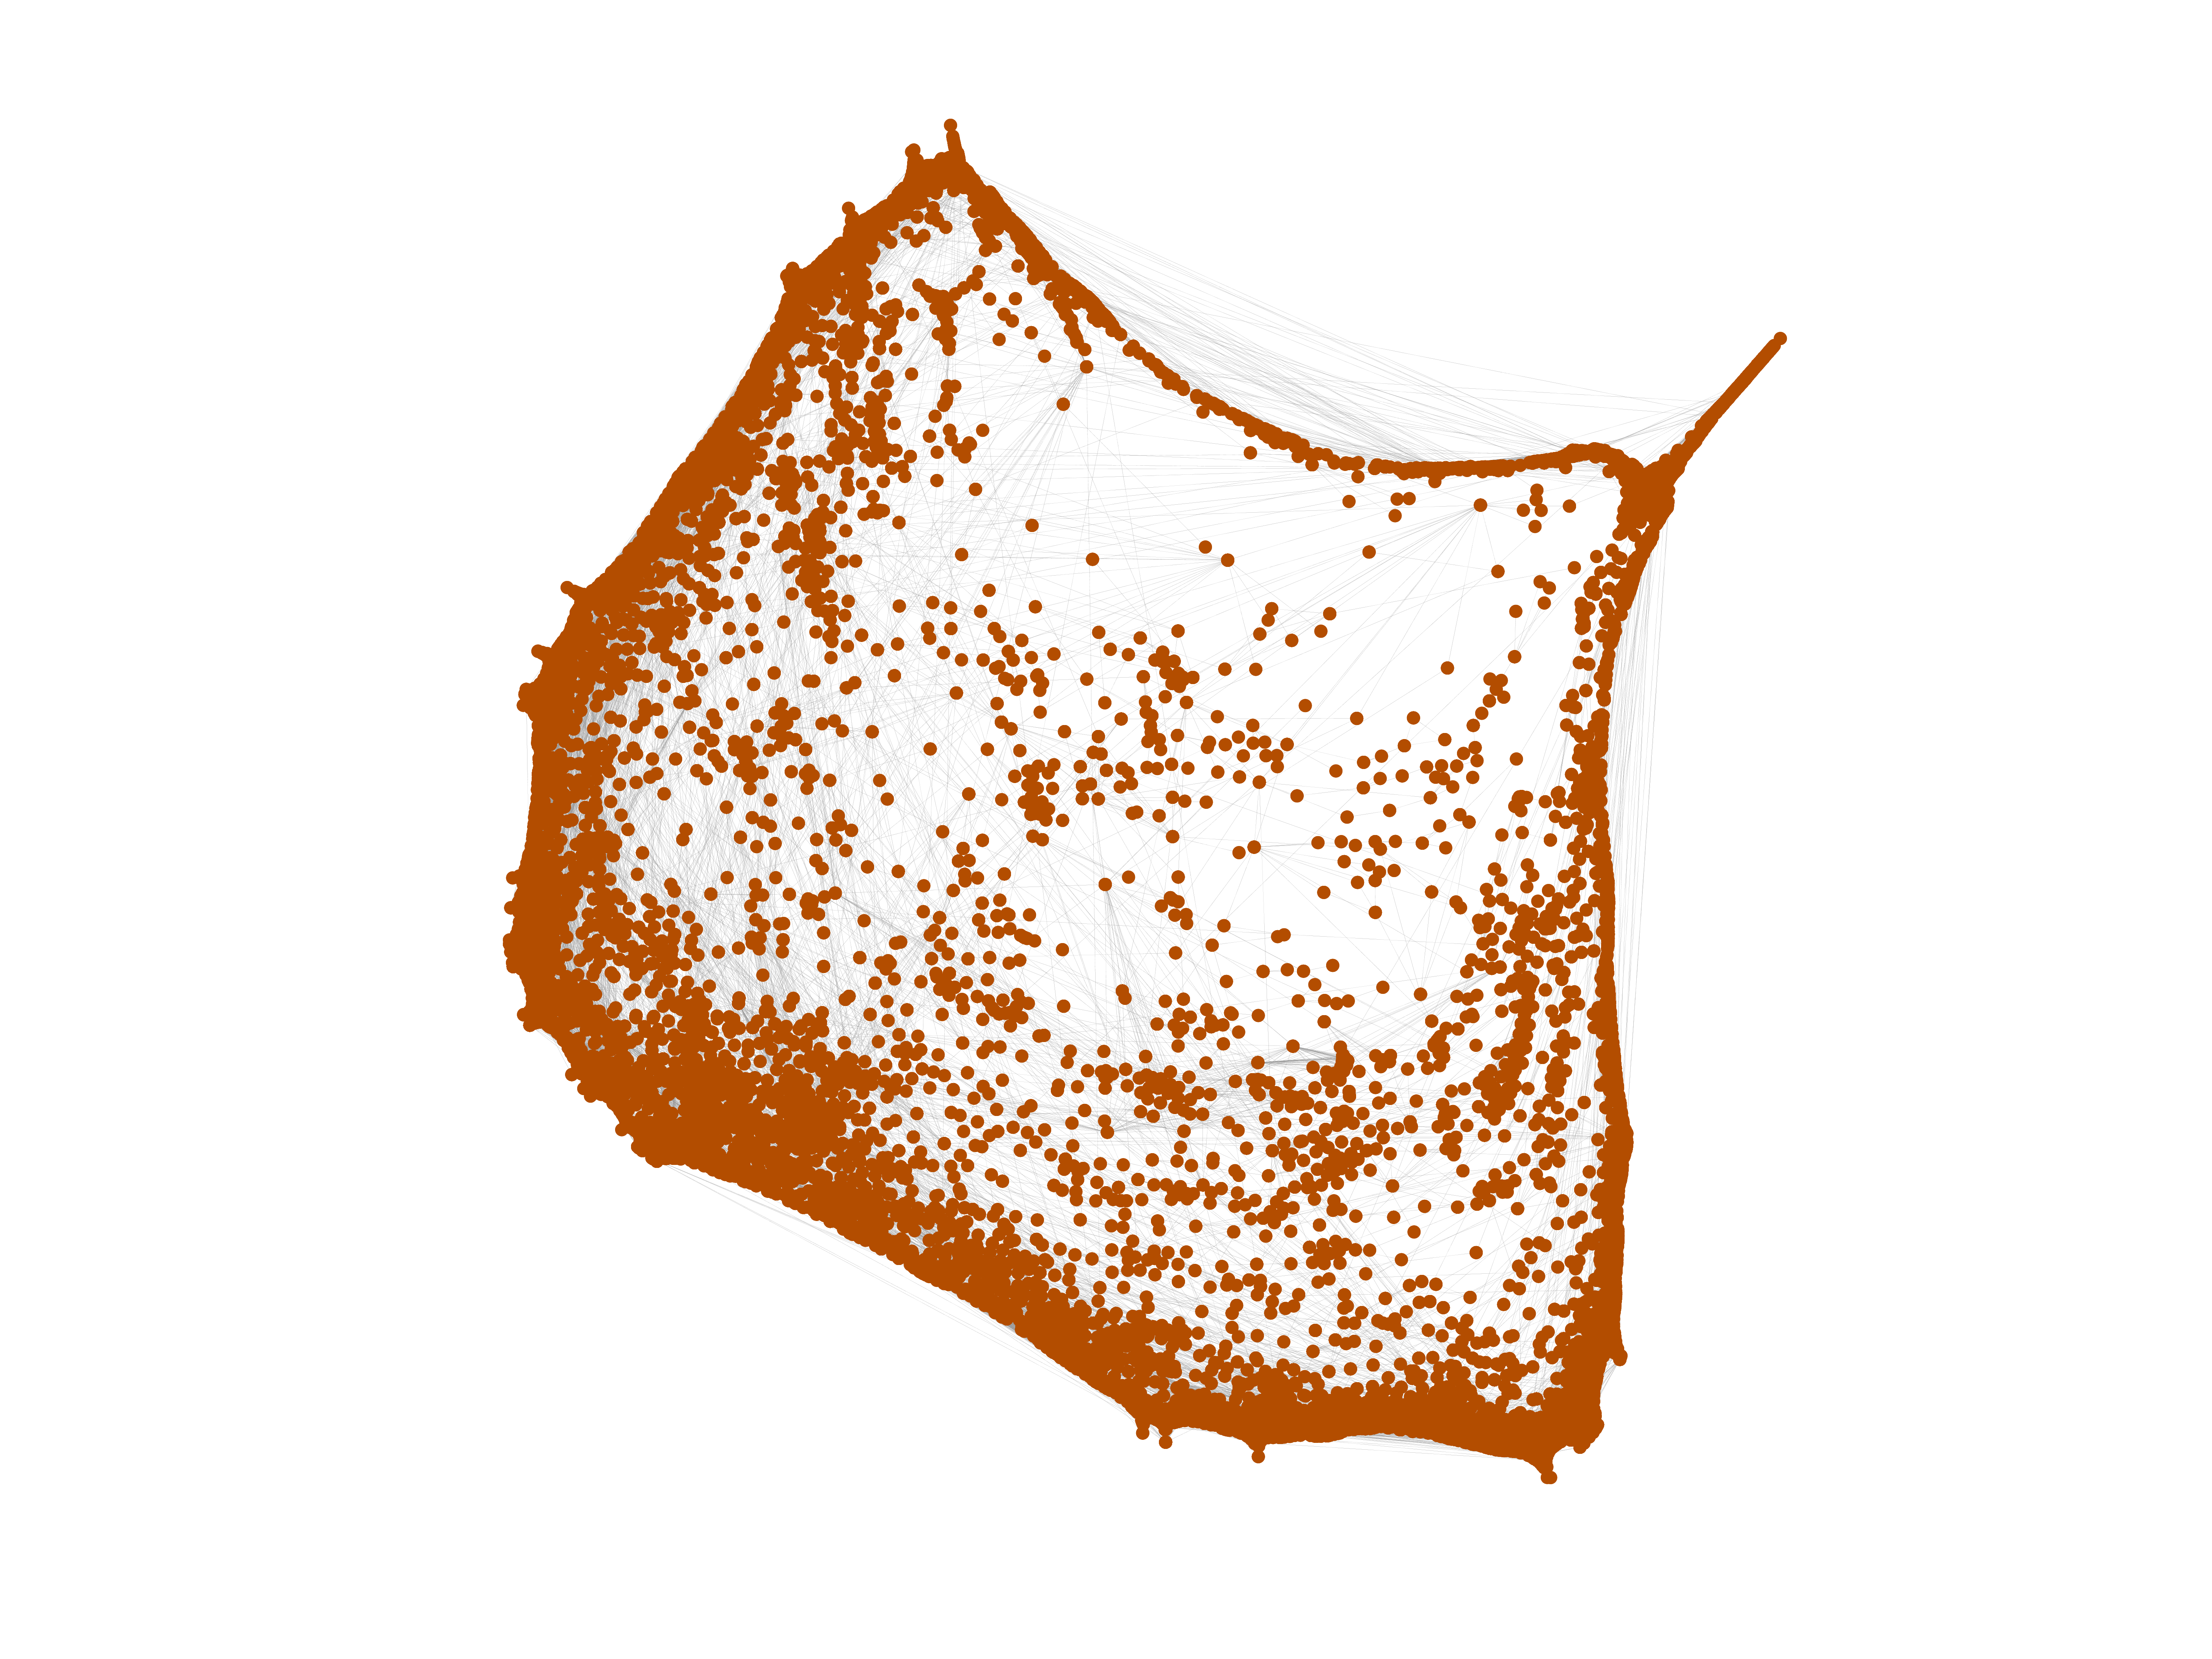
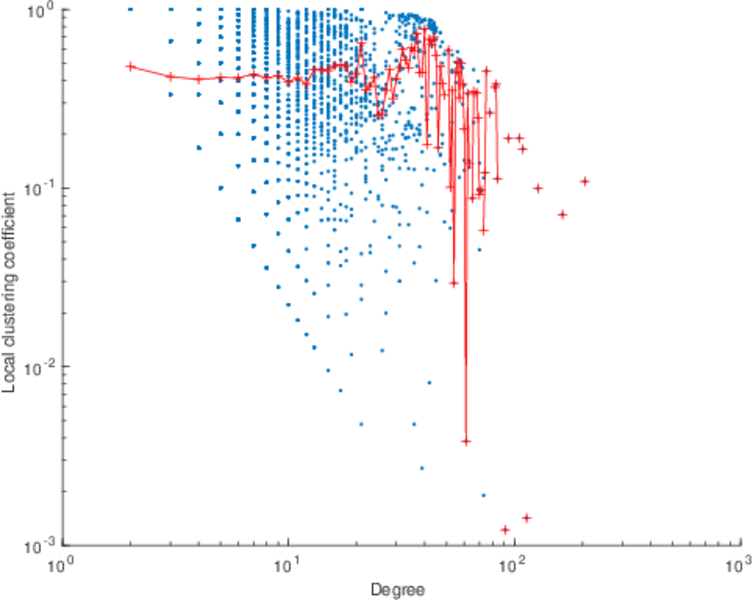
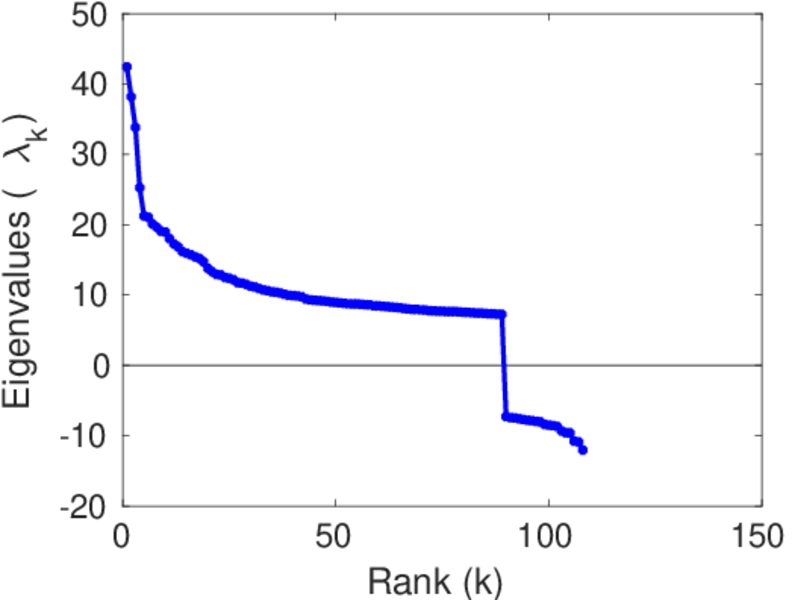
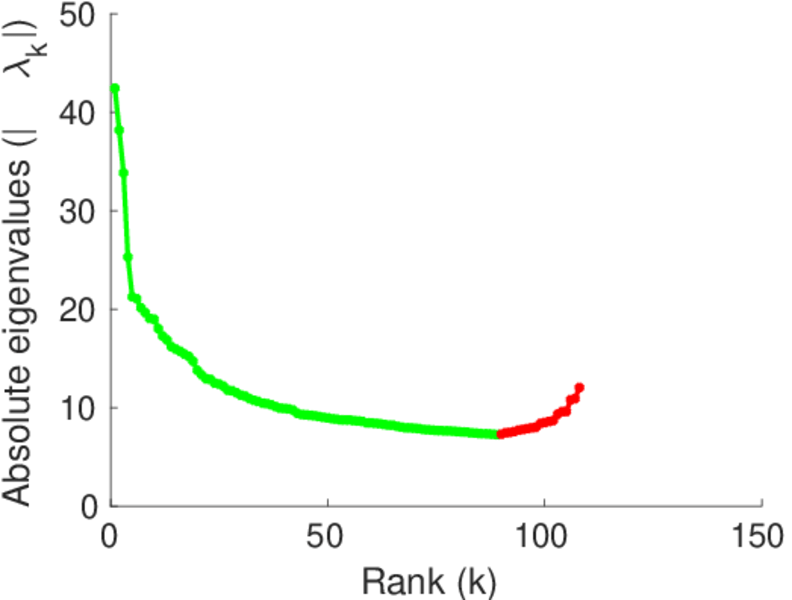
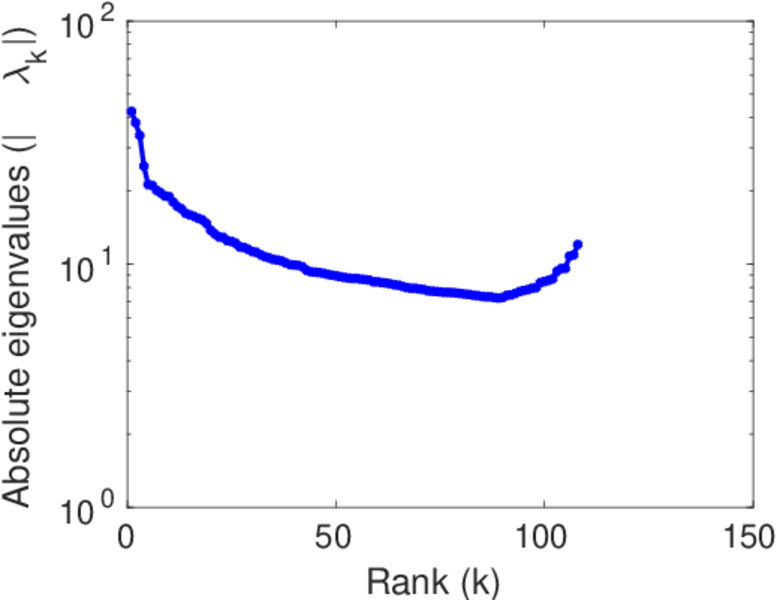
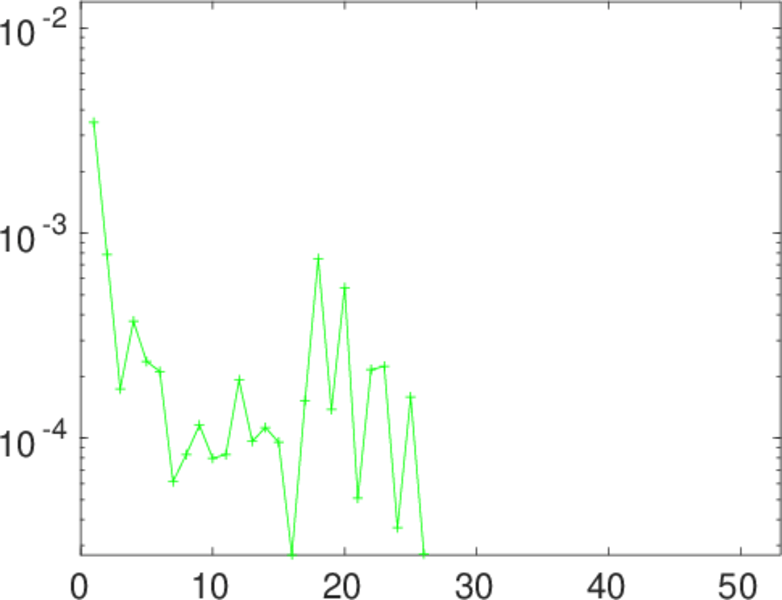
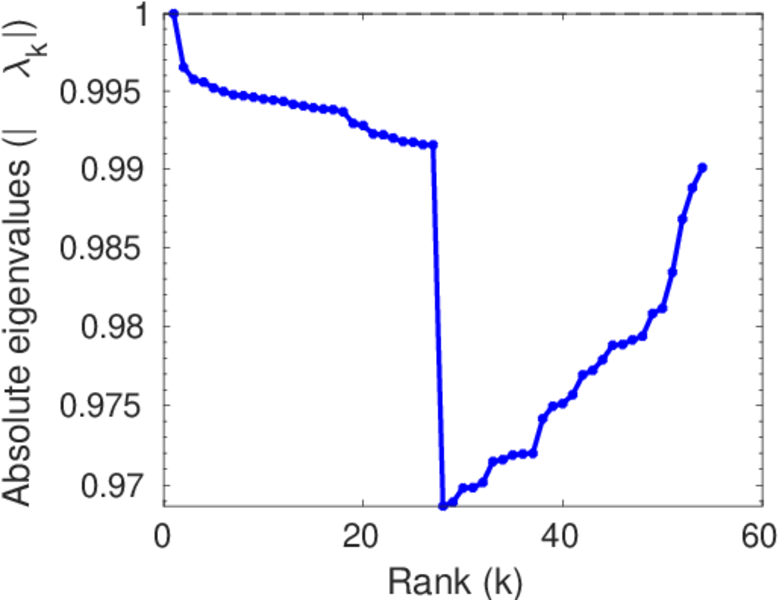
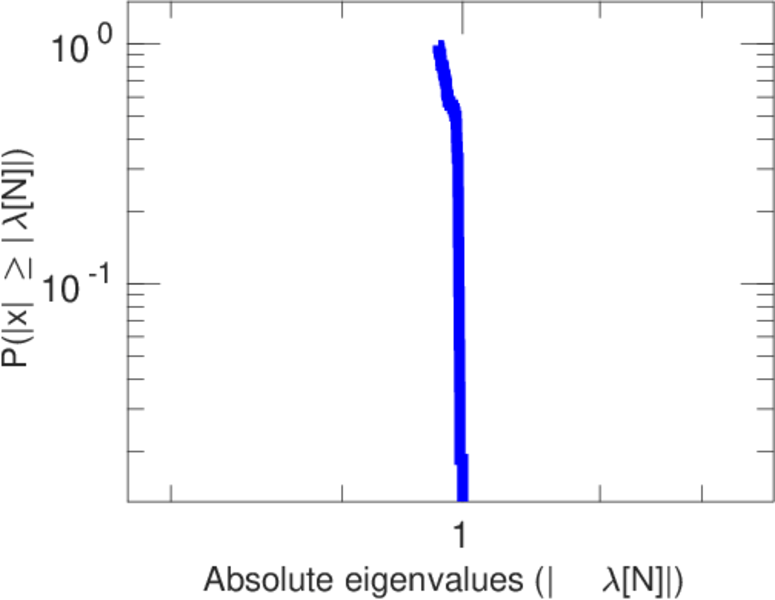
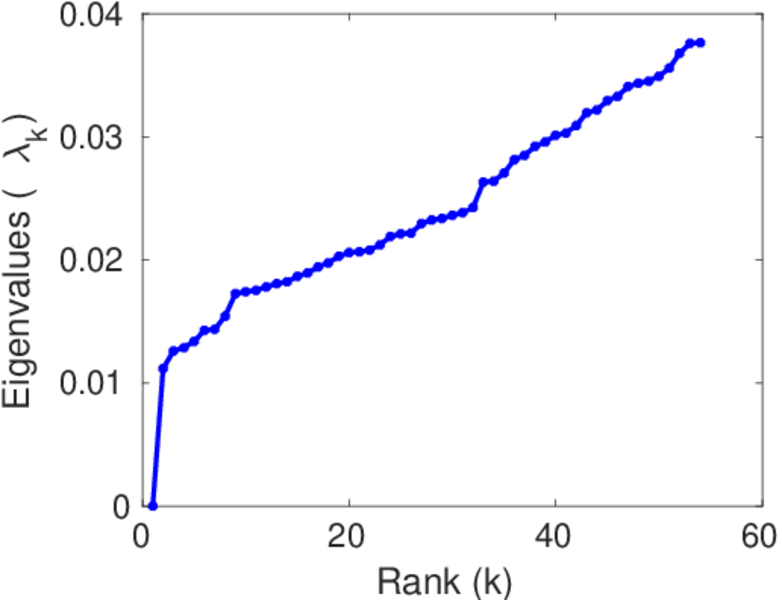
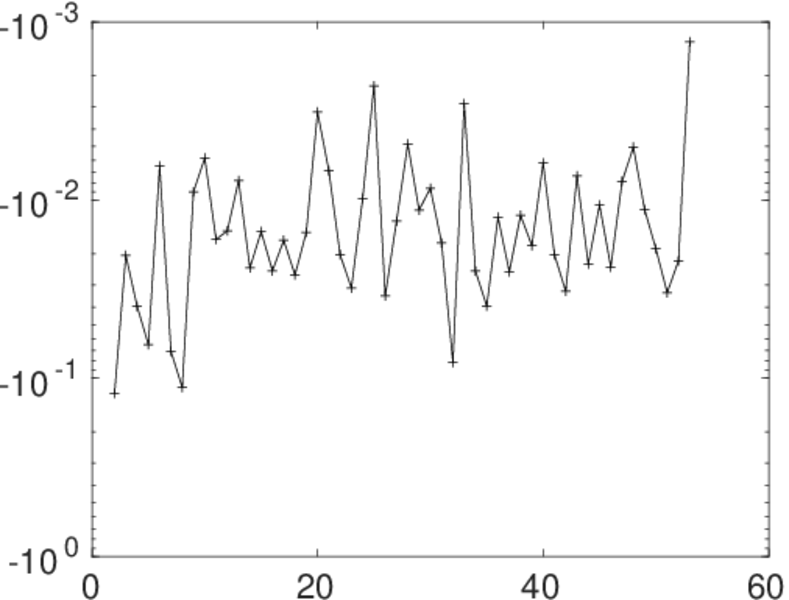
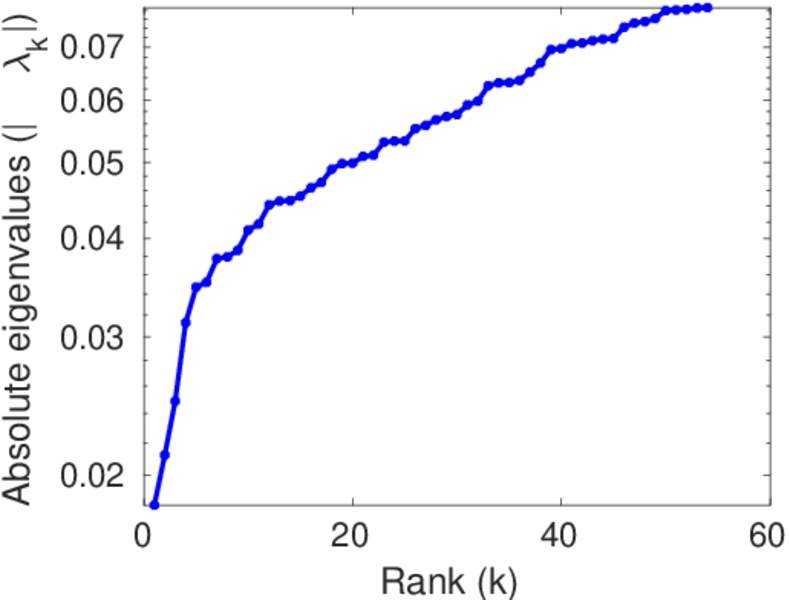
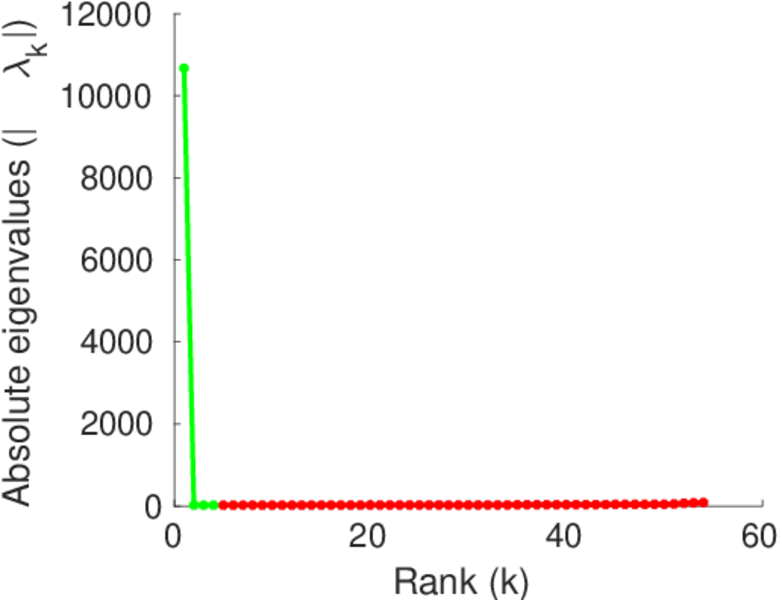
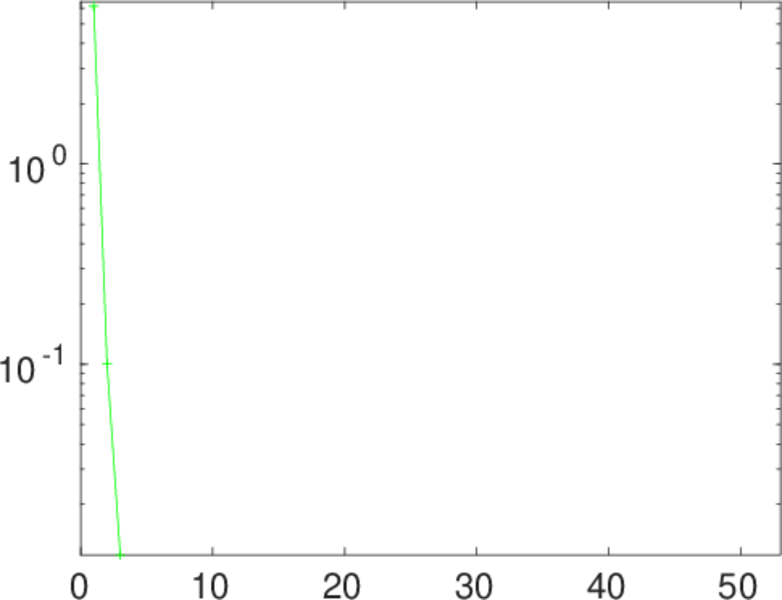
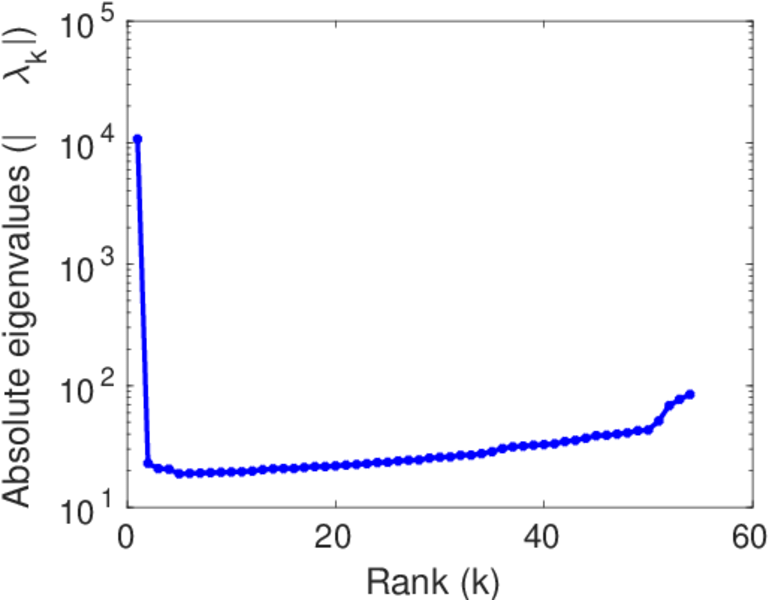
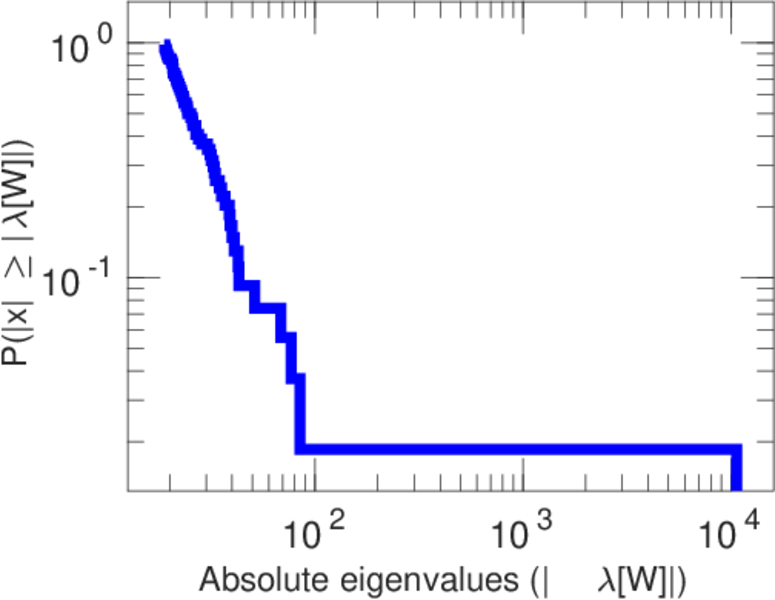
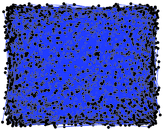
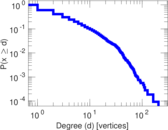
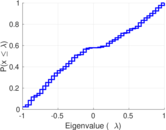
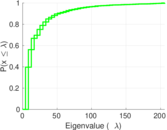
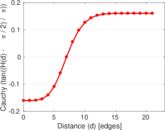
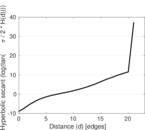
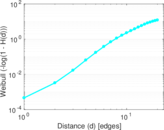
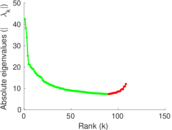
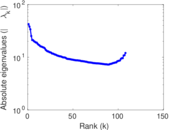
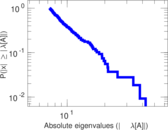
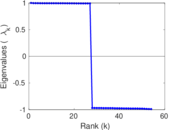
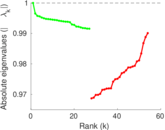
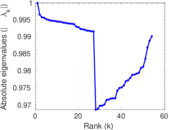
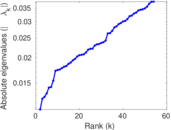
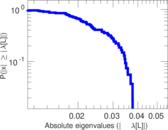
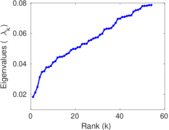
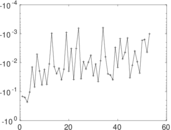
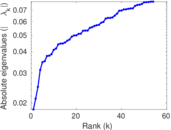
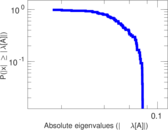
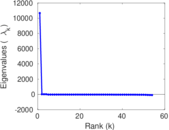
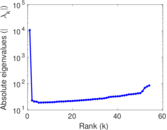
Plots


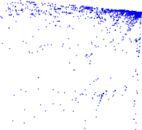
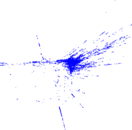


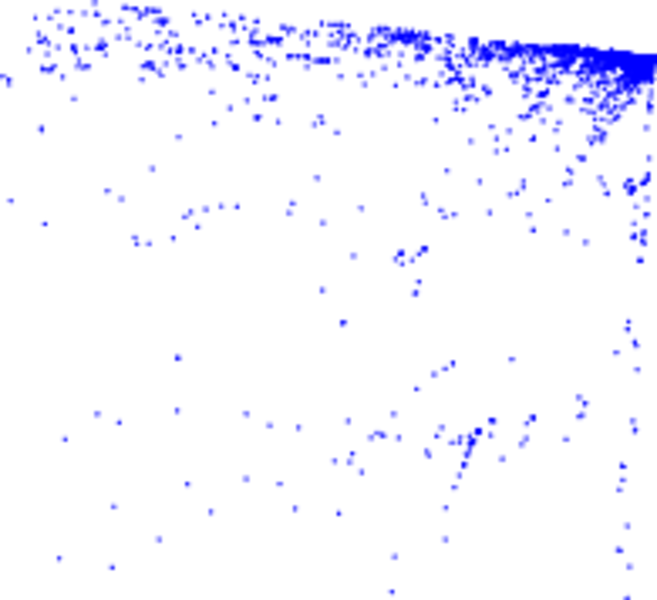
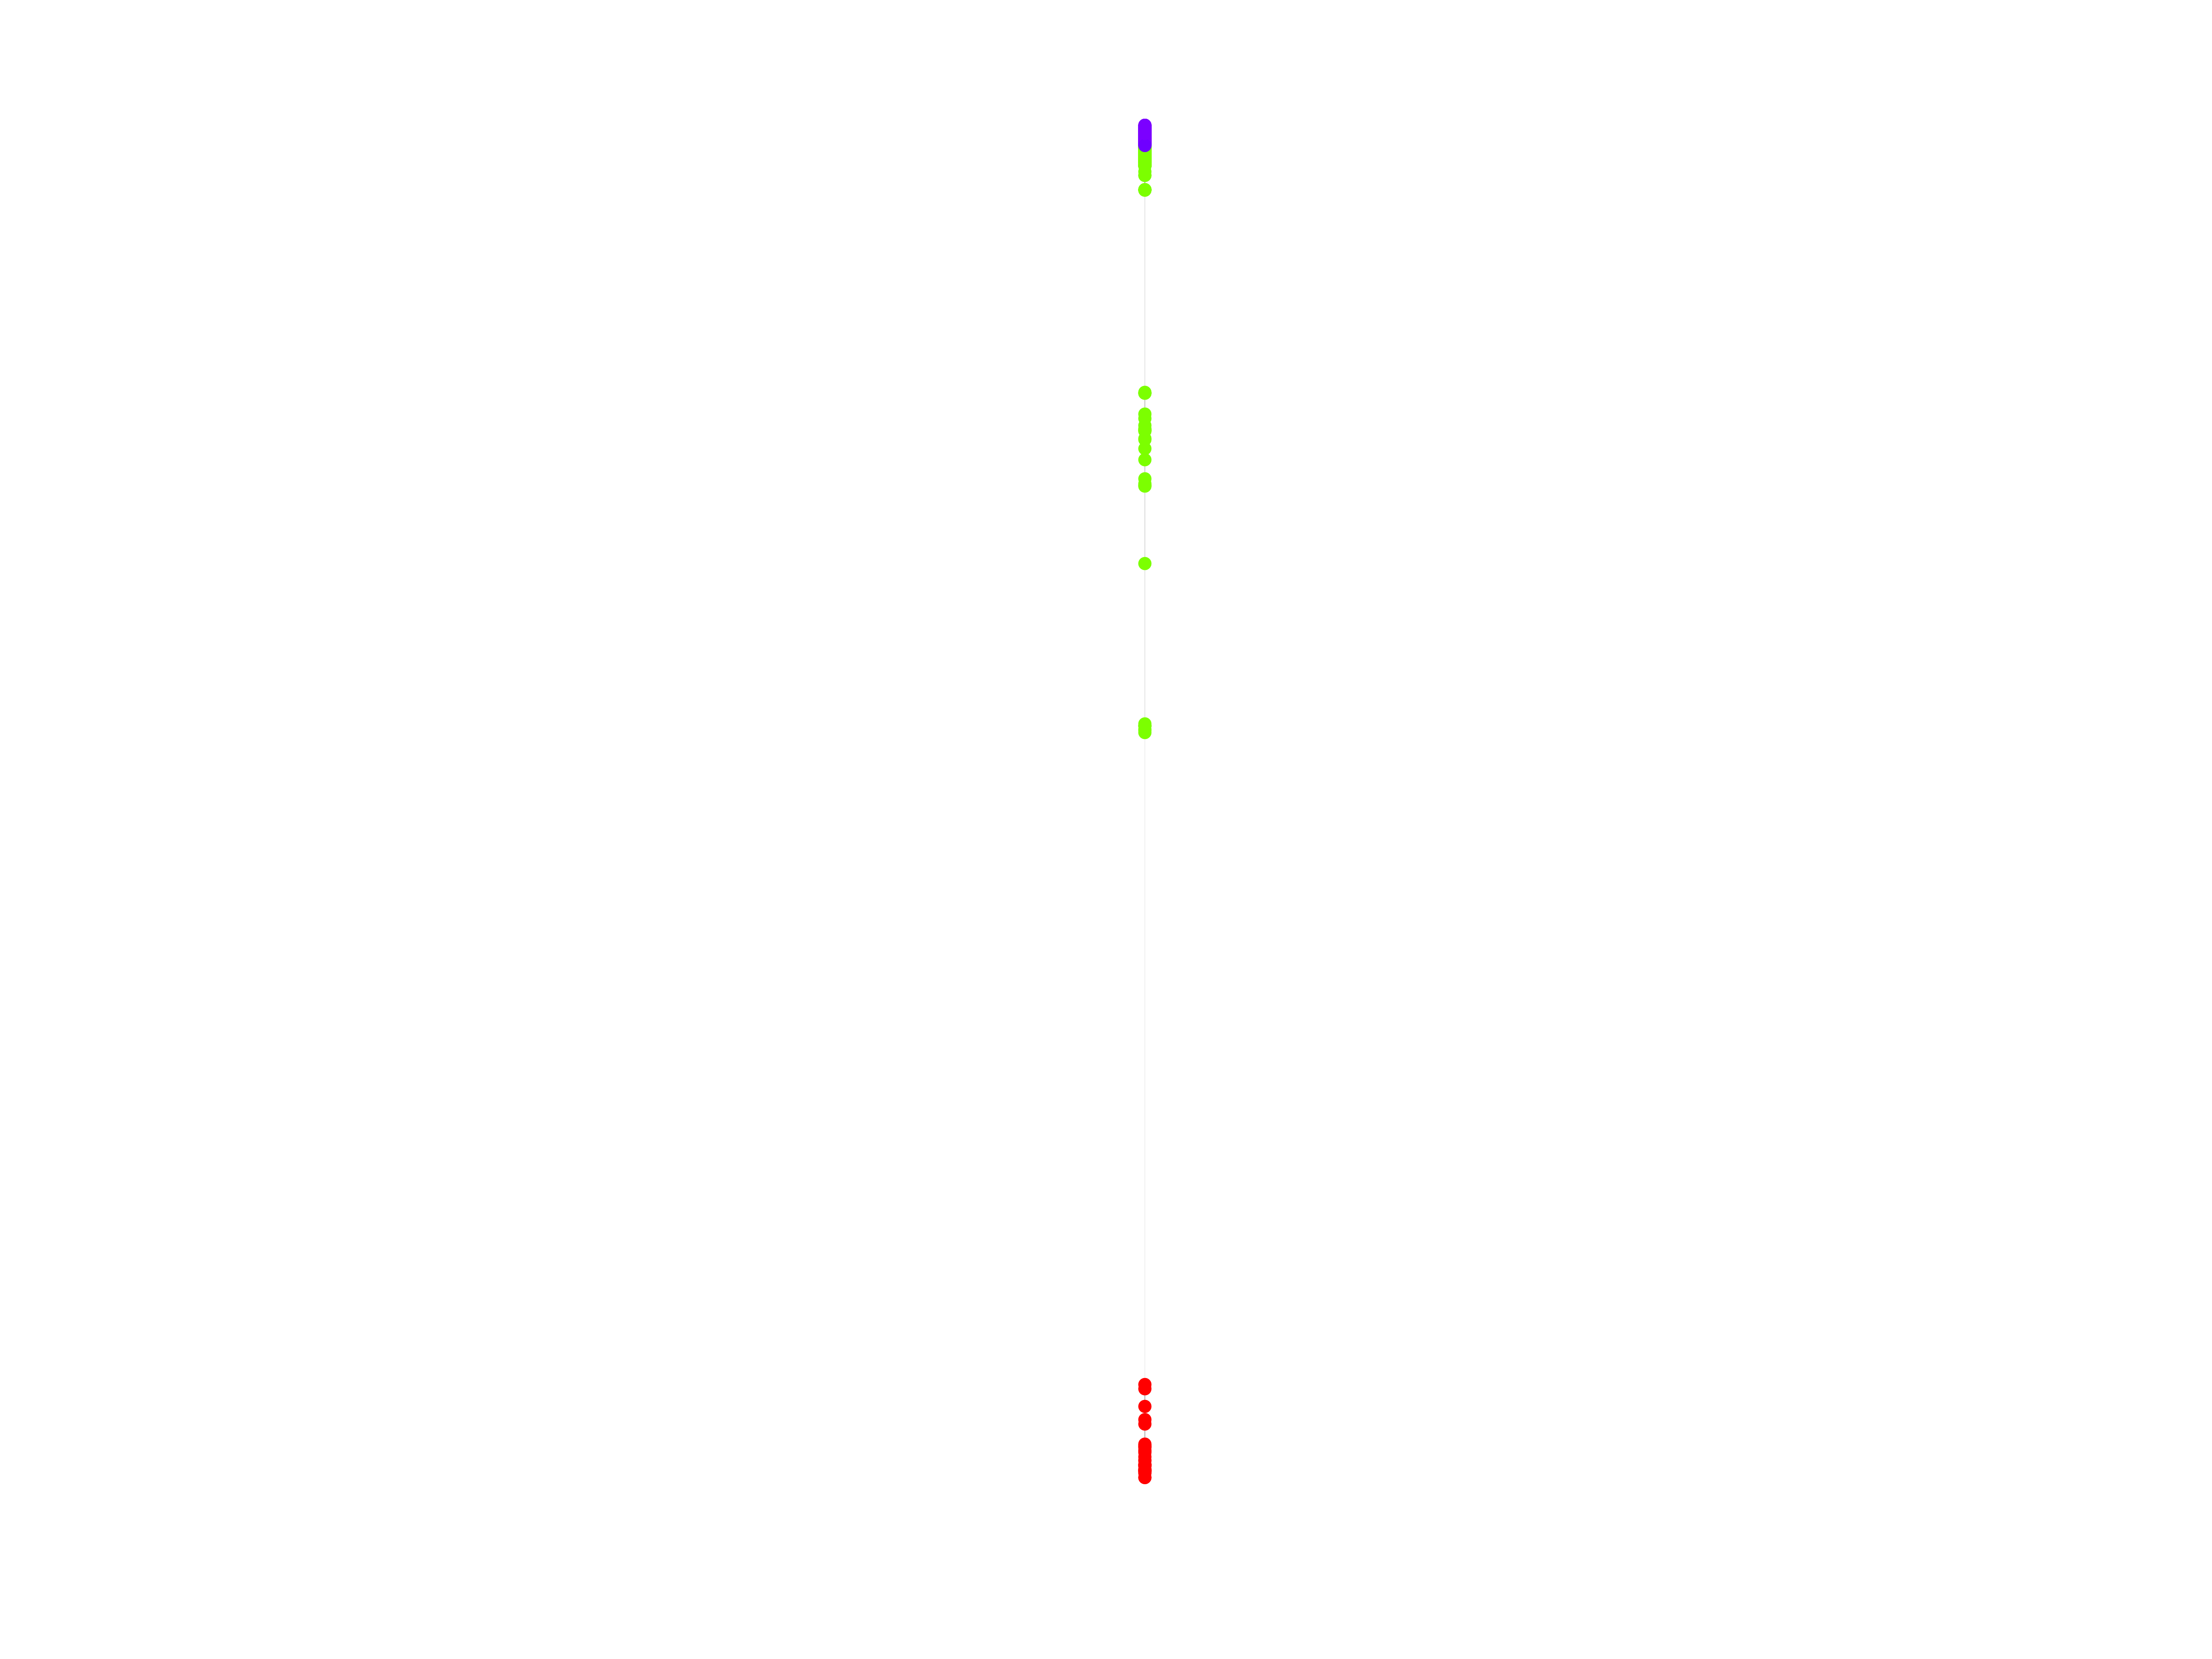
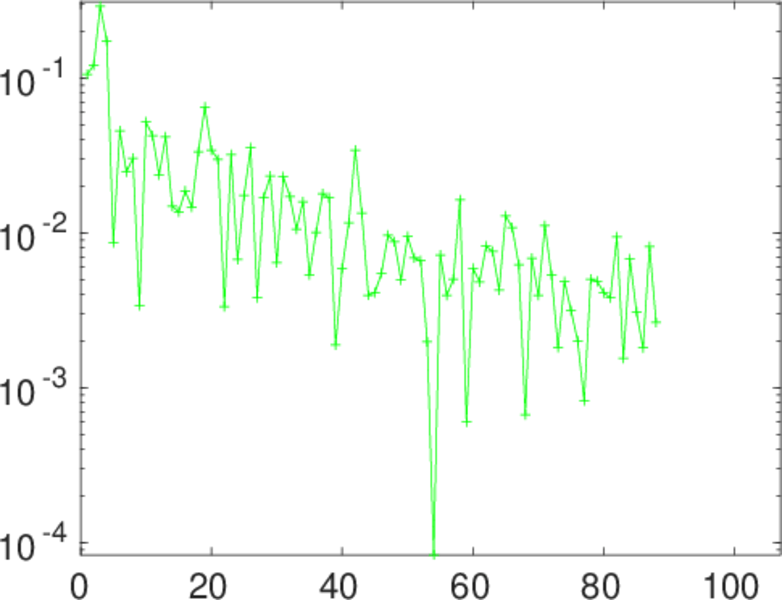
Matrix decompositions plots


Downloads
References
|
[1]
|
Jérôme Kunegis.
KONECT – The Koblenz Network Collection.
In Proc. Int. Conf. on World Wide Web Companion, pages
1343–1350, 2013.
[ http ]
|
|
[2]
|
Marián Boguñá, Romualdo Pastor-Satorras, Albert Díaz-Guilera, and Alex
Arenas.
Models of social networks based on social distance attachment.
Phys. Rev. E, 70(5):056122, 2004.
|
 KONECT ‣ Networks ‣
Buy Me a Coffee
KONECT ‣ Networks ‣
Buy Me a Coffee