CAIDA
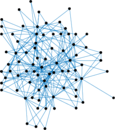
This is the undirected network of autonomous systems of the Internet connected
with each other from the CAIDA project, collected in 2007. Nodes are autonomous
systems (AS), and edges denote communication.
Metadata
Statistics
| Size | n = | 26,475
|
| Volume | m = | 53,381
|
| Loop count | l = | 0
|
| Wedge count | s = | 14,906,270
|
| Claw count | z = | 7,839,606,991
|
| Cross count | x = | 3,916,793,044,776
|
| Triangle count | t = | 36,365
|
| Square count | q = | 2,287,349
|
| 4-Tour count | T4 = | 78,030,634
|
| Maximum degree | dmax = | 2,628
|
| Average degree | d = | 4.032 56
|
| Fill | p = | 0.000 152 321
|
| Size of LCC | N = | 26,475
|
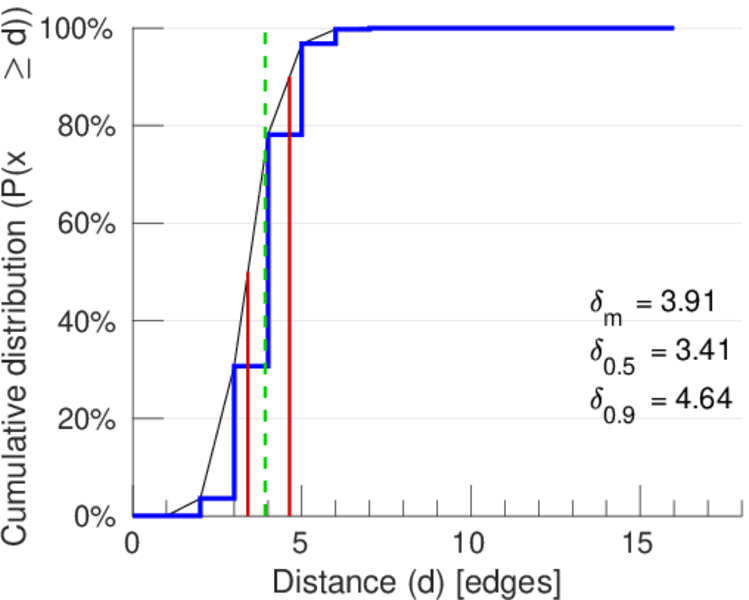
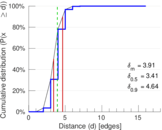
| Diameter | δ = | 17
|
| 50-Percentile effective diameter | δ0.5 = | 3.407 07
|
| 90-Percentile effective diameter | δ0.9 = | 4.636 96
|
| Median distance | δM = | 4
|
| Mean distance | δm = | 3.912 47
|
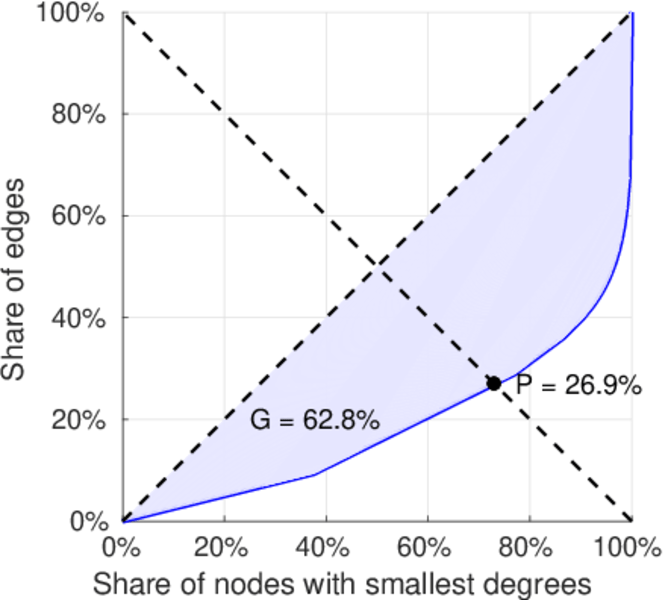
| Gini coefficient | G = | 0.628 058
|
| Balanced inequality ratio | P = | 0.268 963
|
| Relative edge distribution entropy | Her = | 0.838 051
|
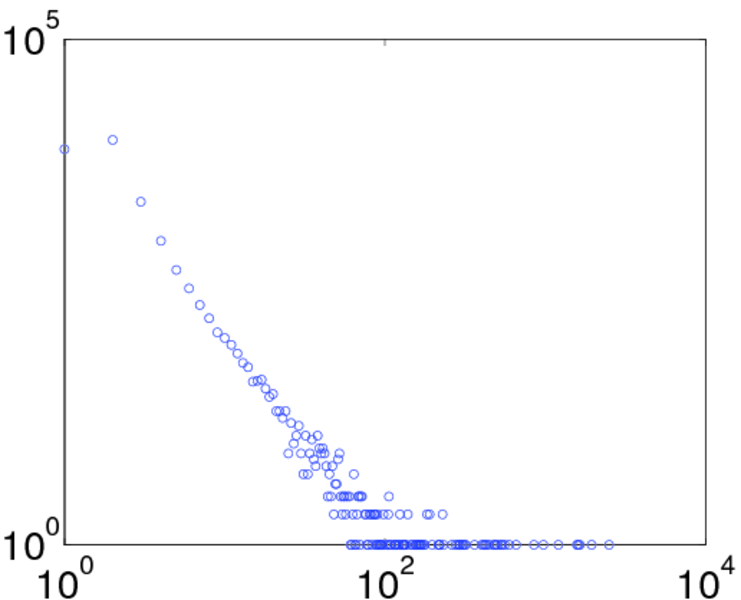
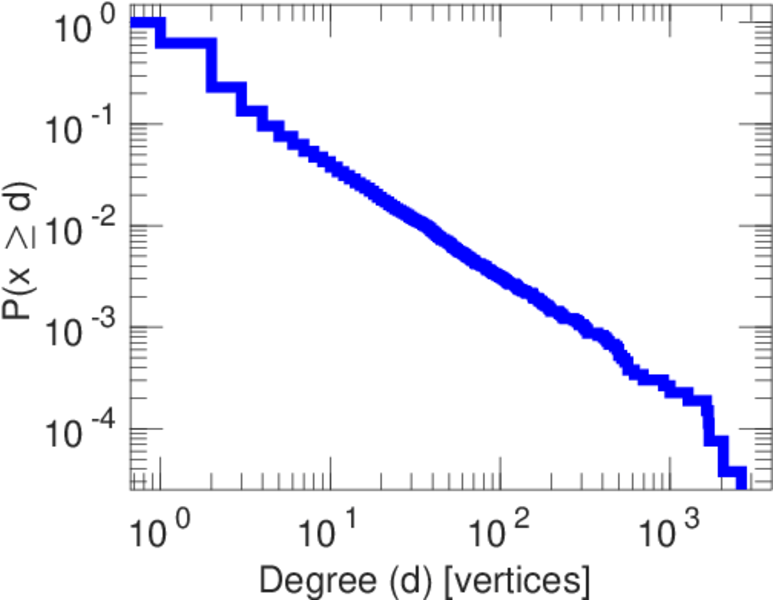
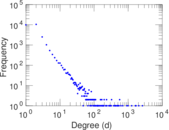
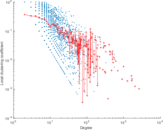
| Power law exponent | γ = | 2.508 65
|
| Tail power law exponent | γt = | 2.091 00
|
| Tail power law exponent with p | γ3 = | 2.091 00
|
| p-value | p = | 0.733 000
|
| Degree assortativity | ρ = | −0.194 646
|
| Degree assortativity p-value | pρ = | 0.000 00
|
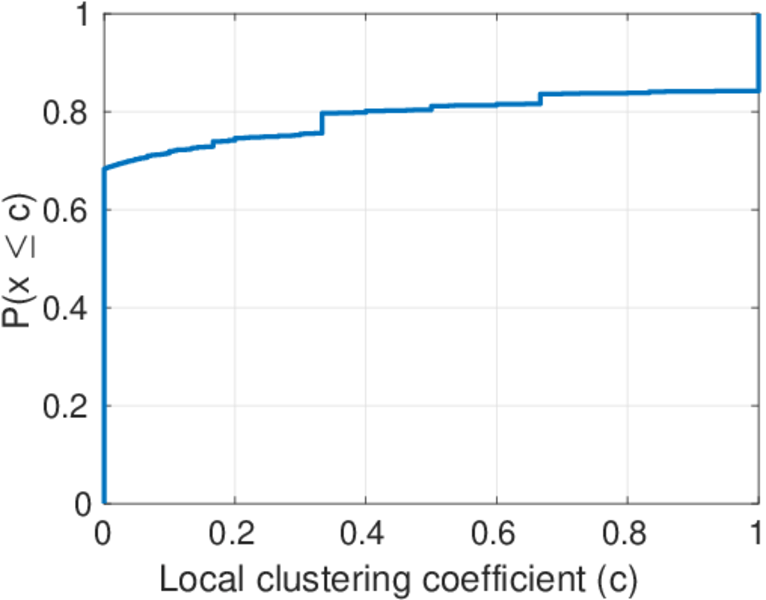
| Clustering coefficient | c = | 0.007 318 73
|
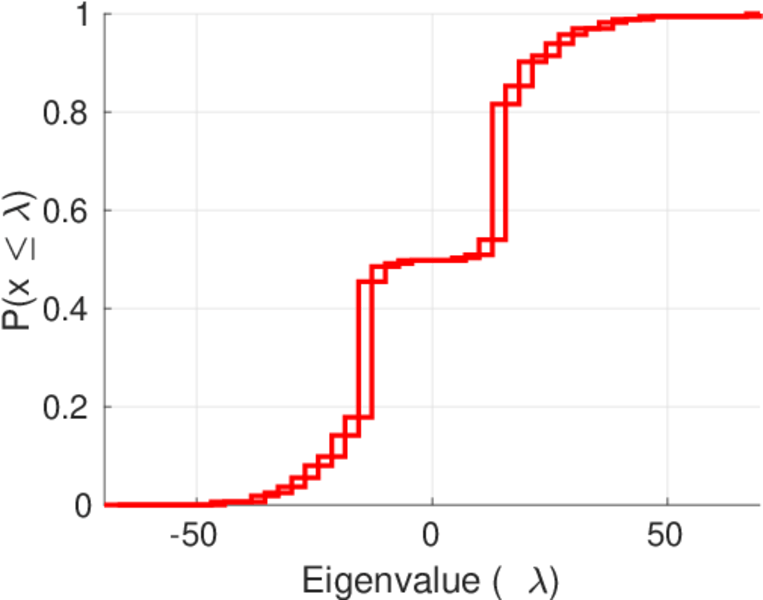
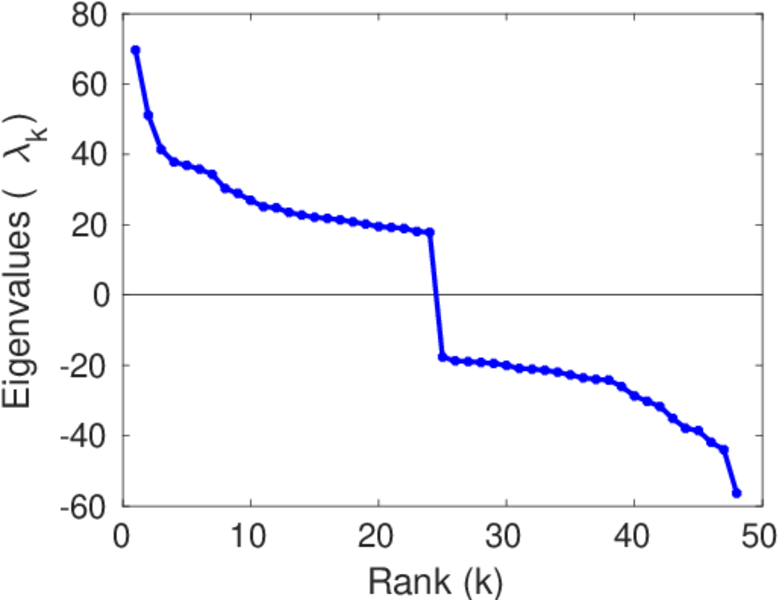
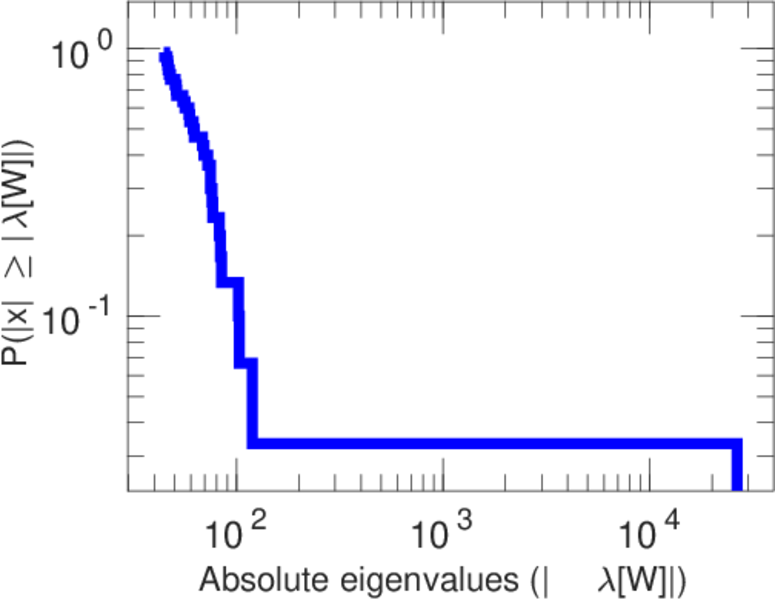
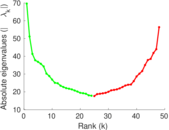
| Spectral norm | α = | 69.643 4
|
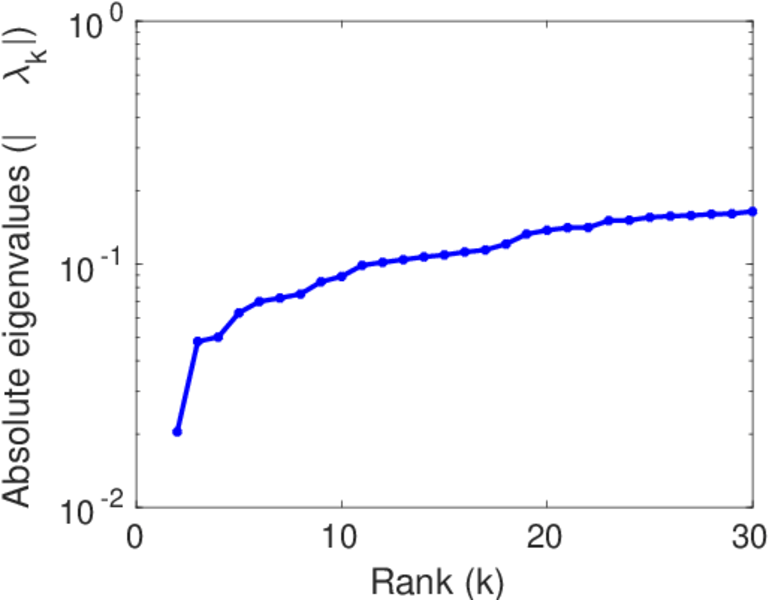
| Algebraic connectivity | a = | 0.020 436 8
|
| Spectral separation | |λ1[A] / λ2[A]| = | 1.235 74
|
| Non-bipartivity | bA = | 0.190 767
|
| Normalized non-bipartivity | bN = | 0.011 209 8
|
| Algebraic non-bipartivity | χ = | 0.020 451 8
|
| Spectral bipartite frustration | bK = | 0.001 267 92
|
| Controllability | C = | 19,127
|
| Relative controllability | Cr = | 0.722 455
|
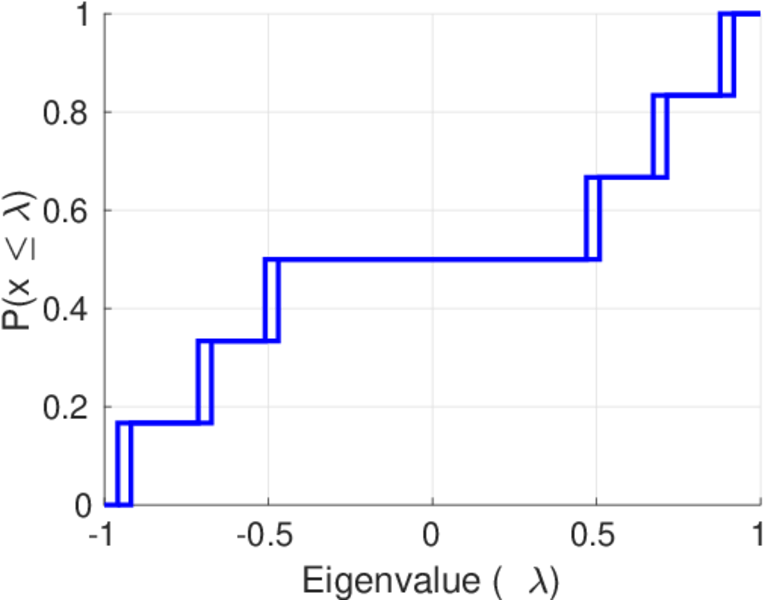
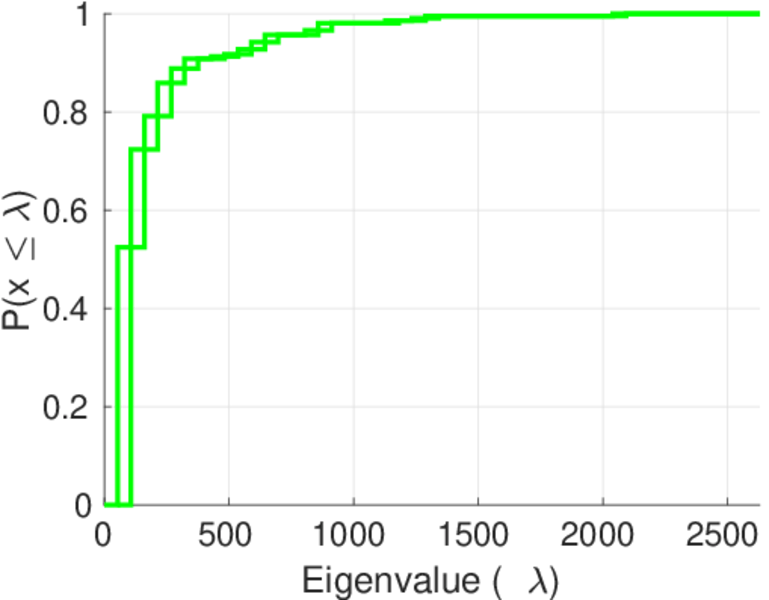
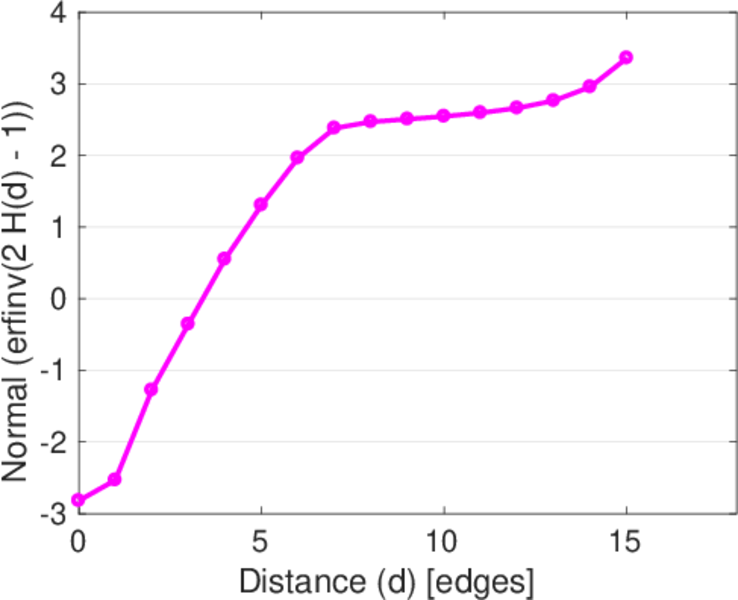
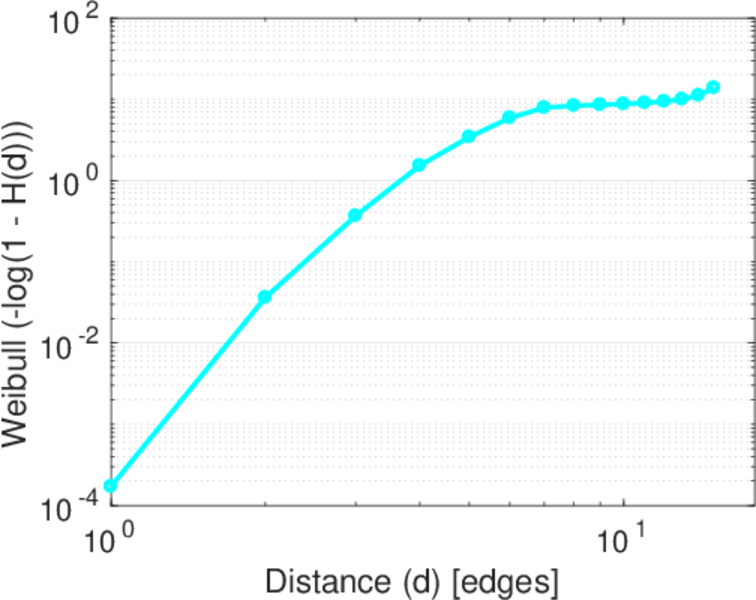
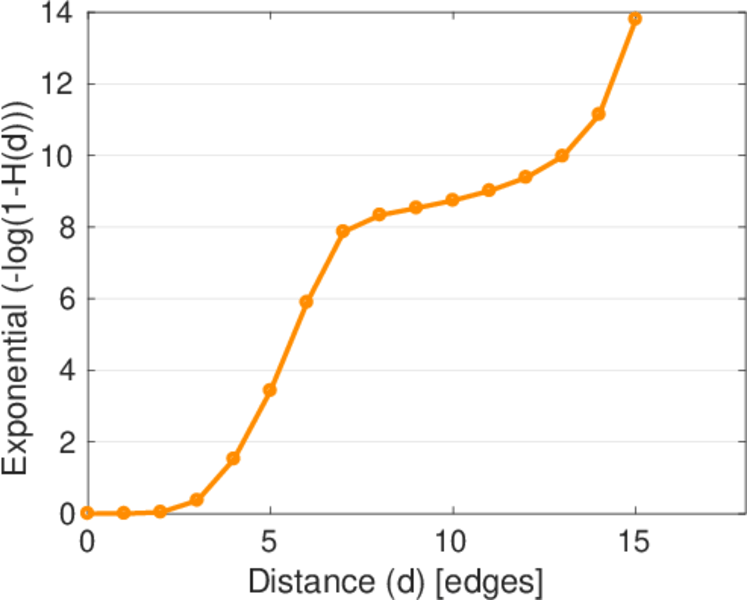
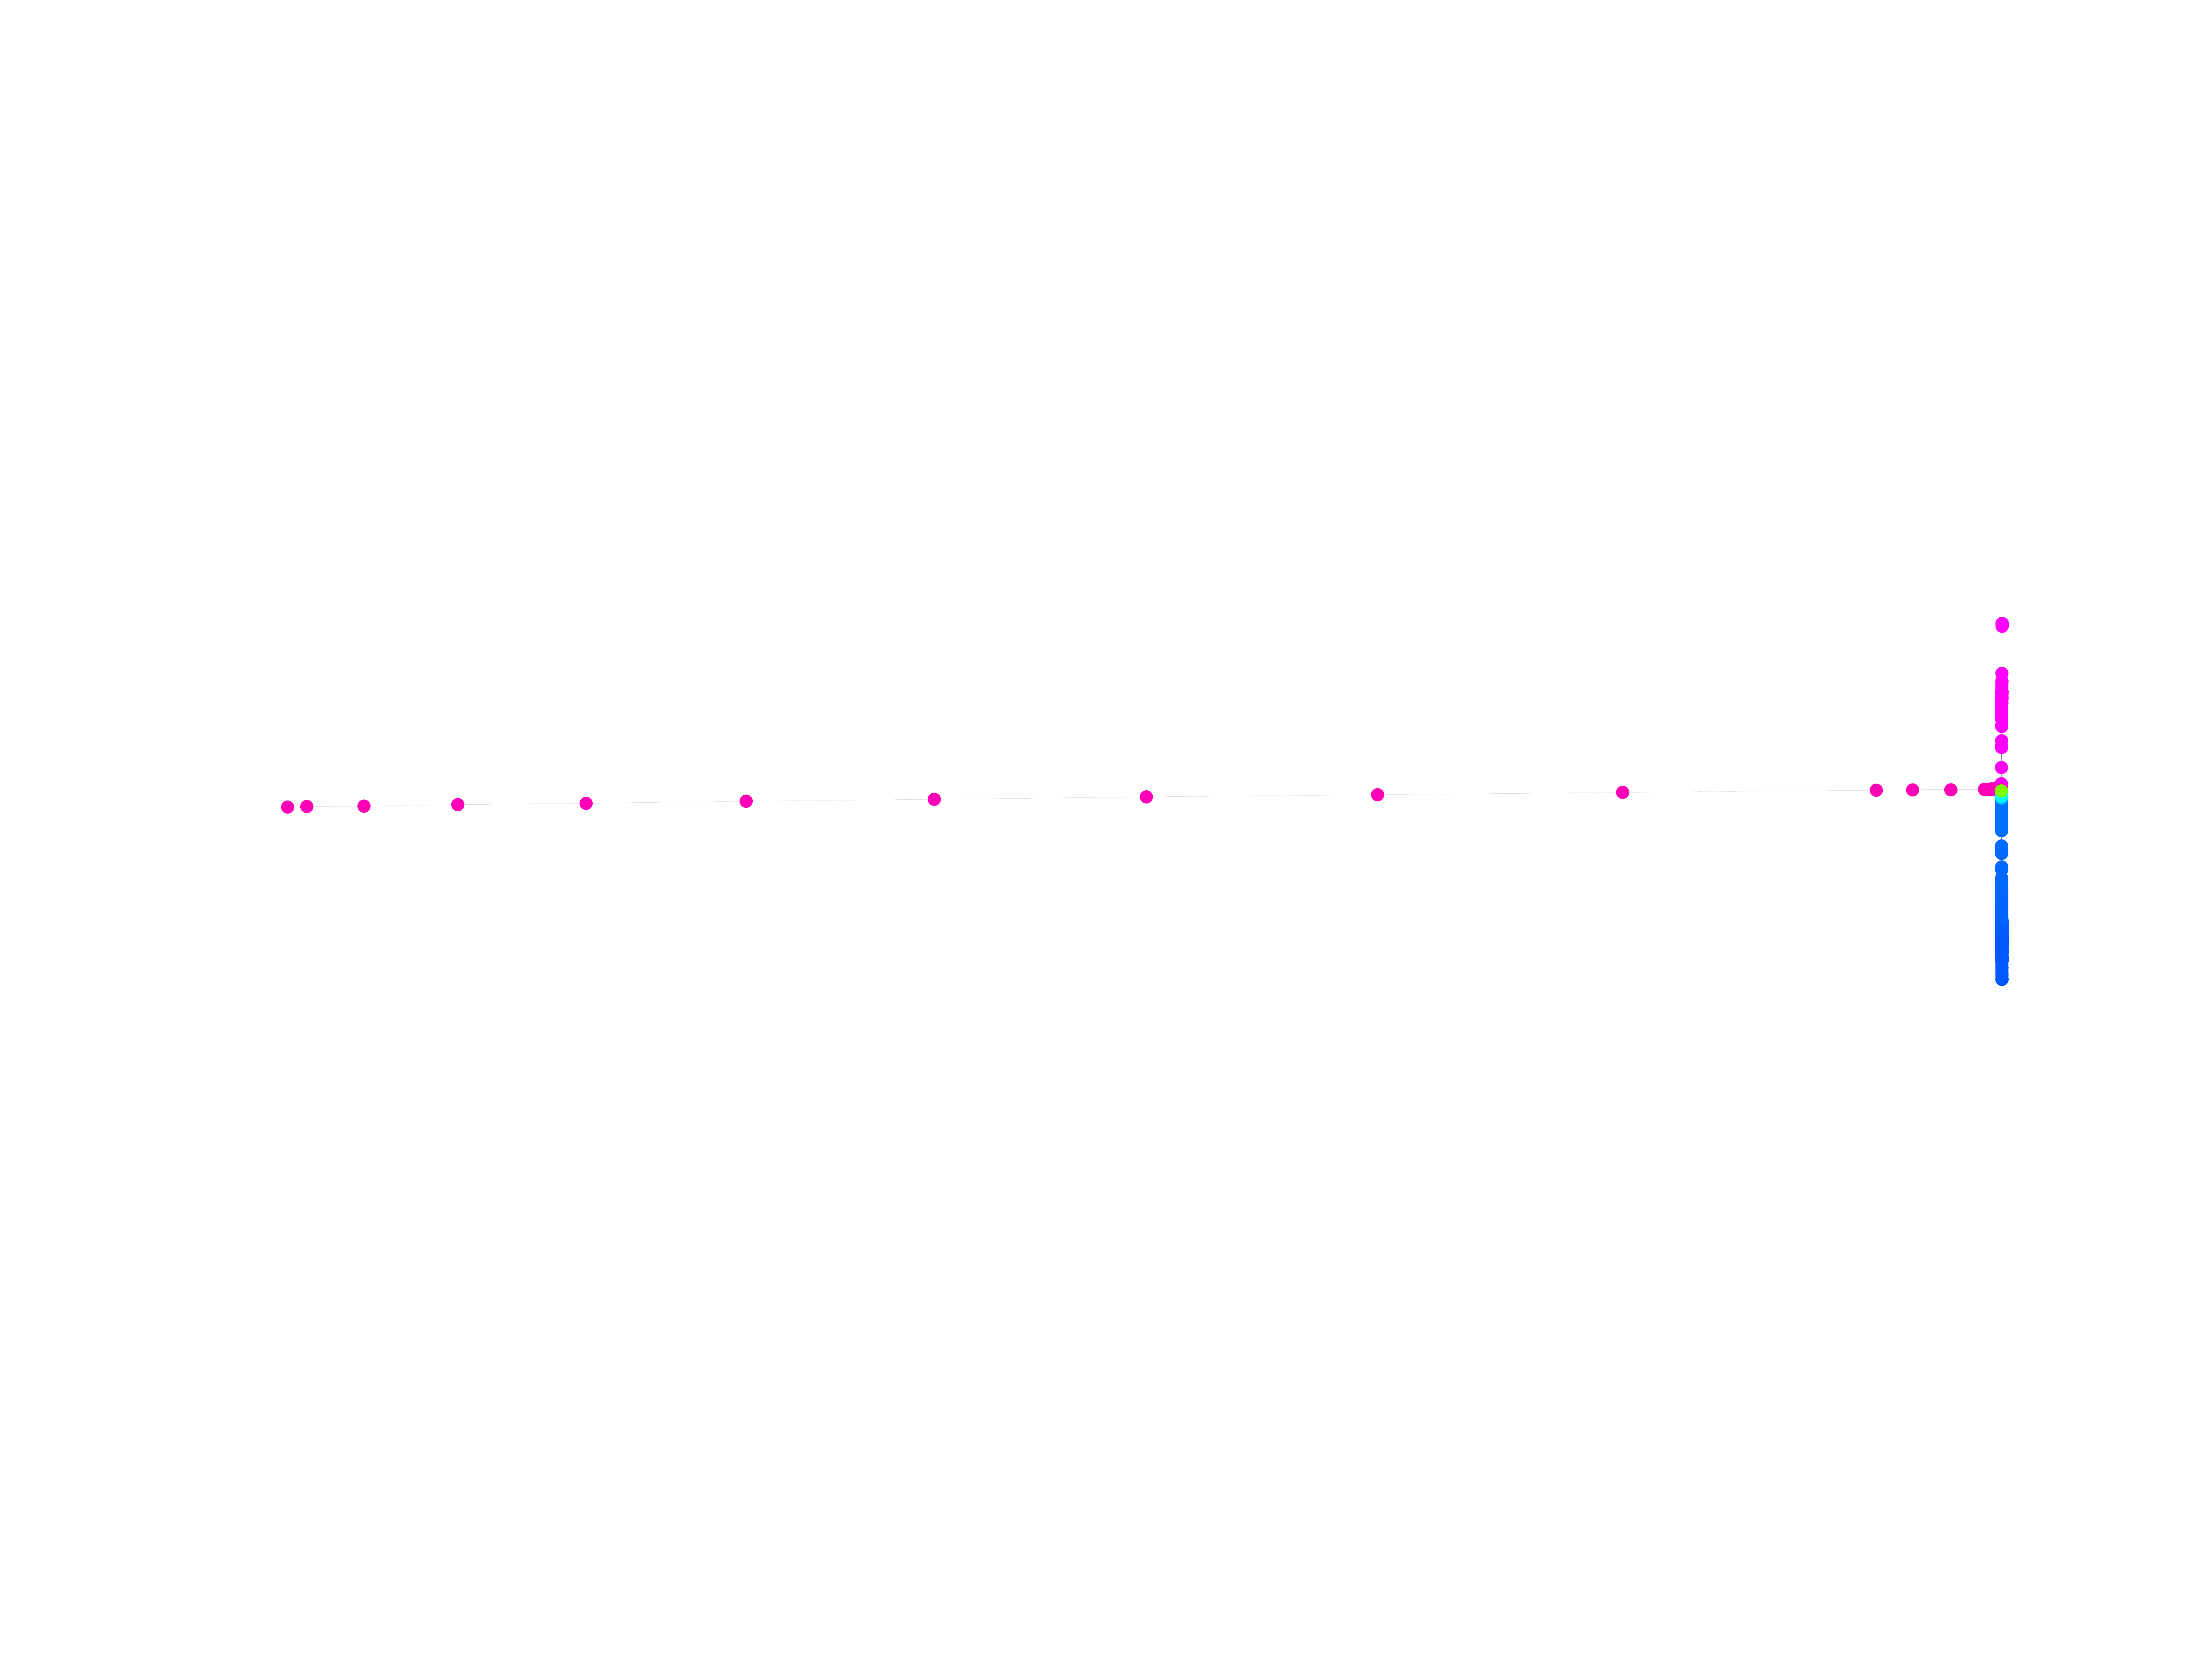
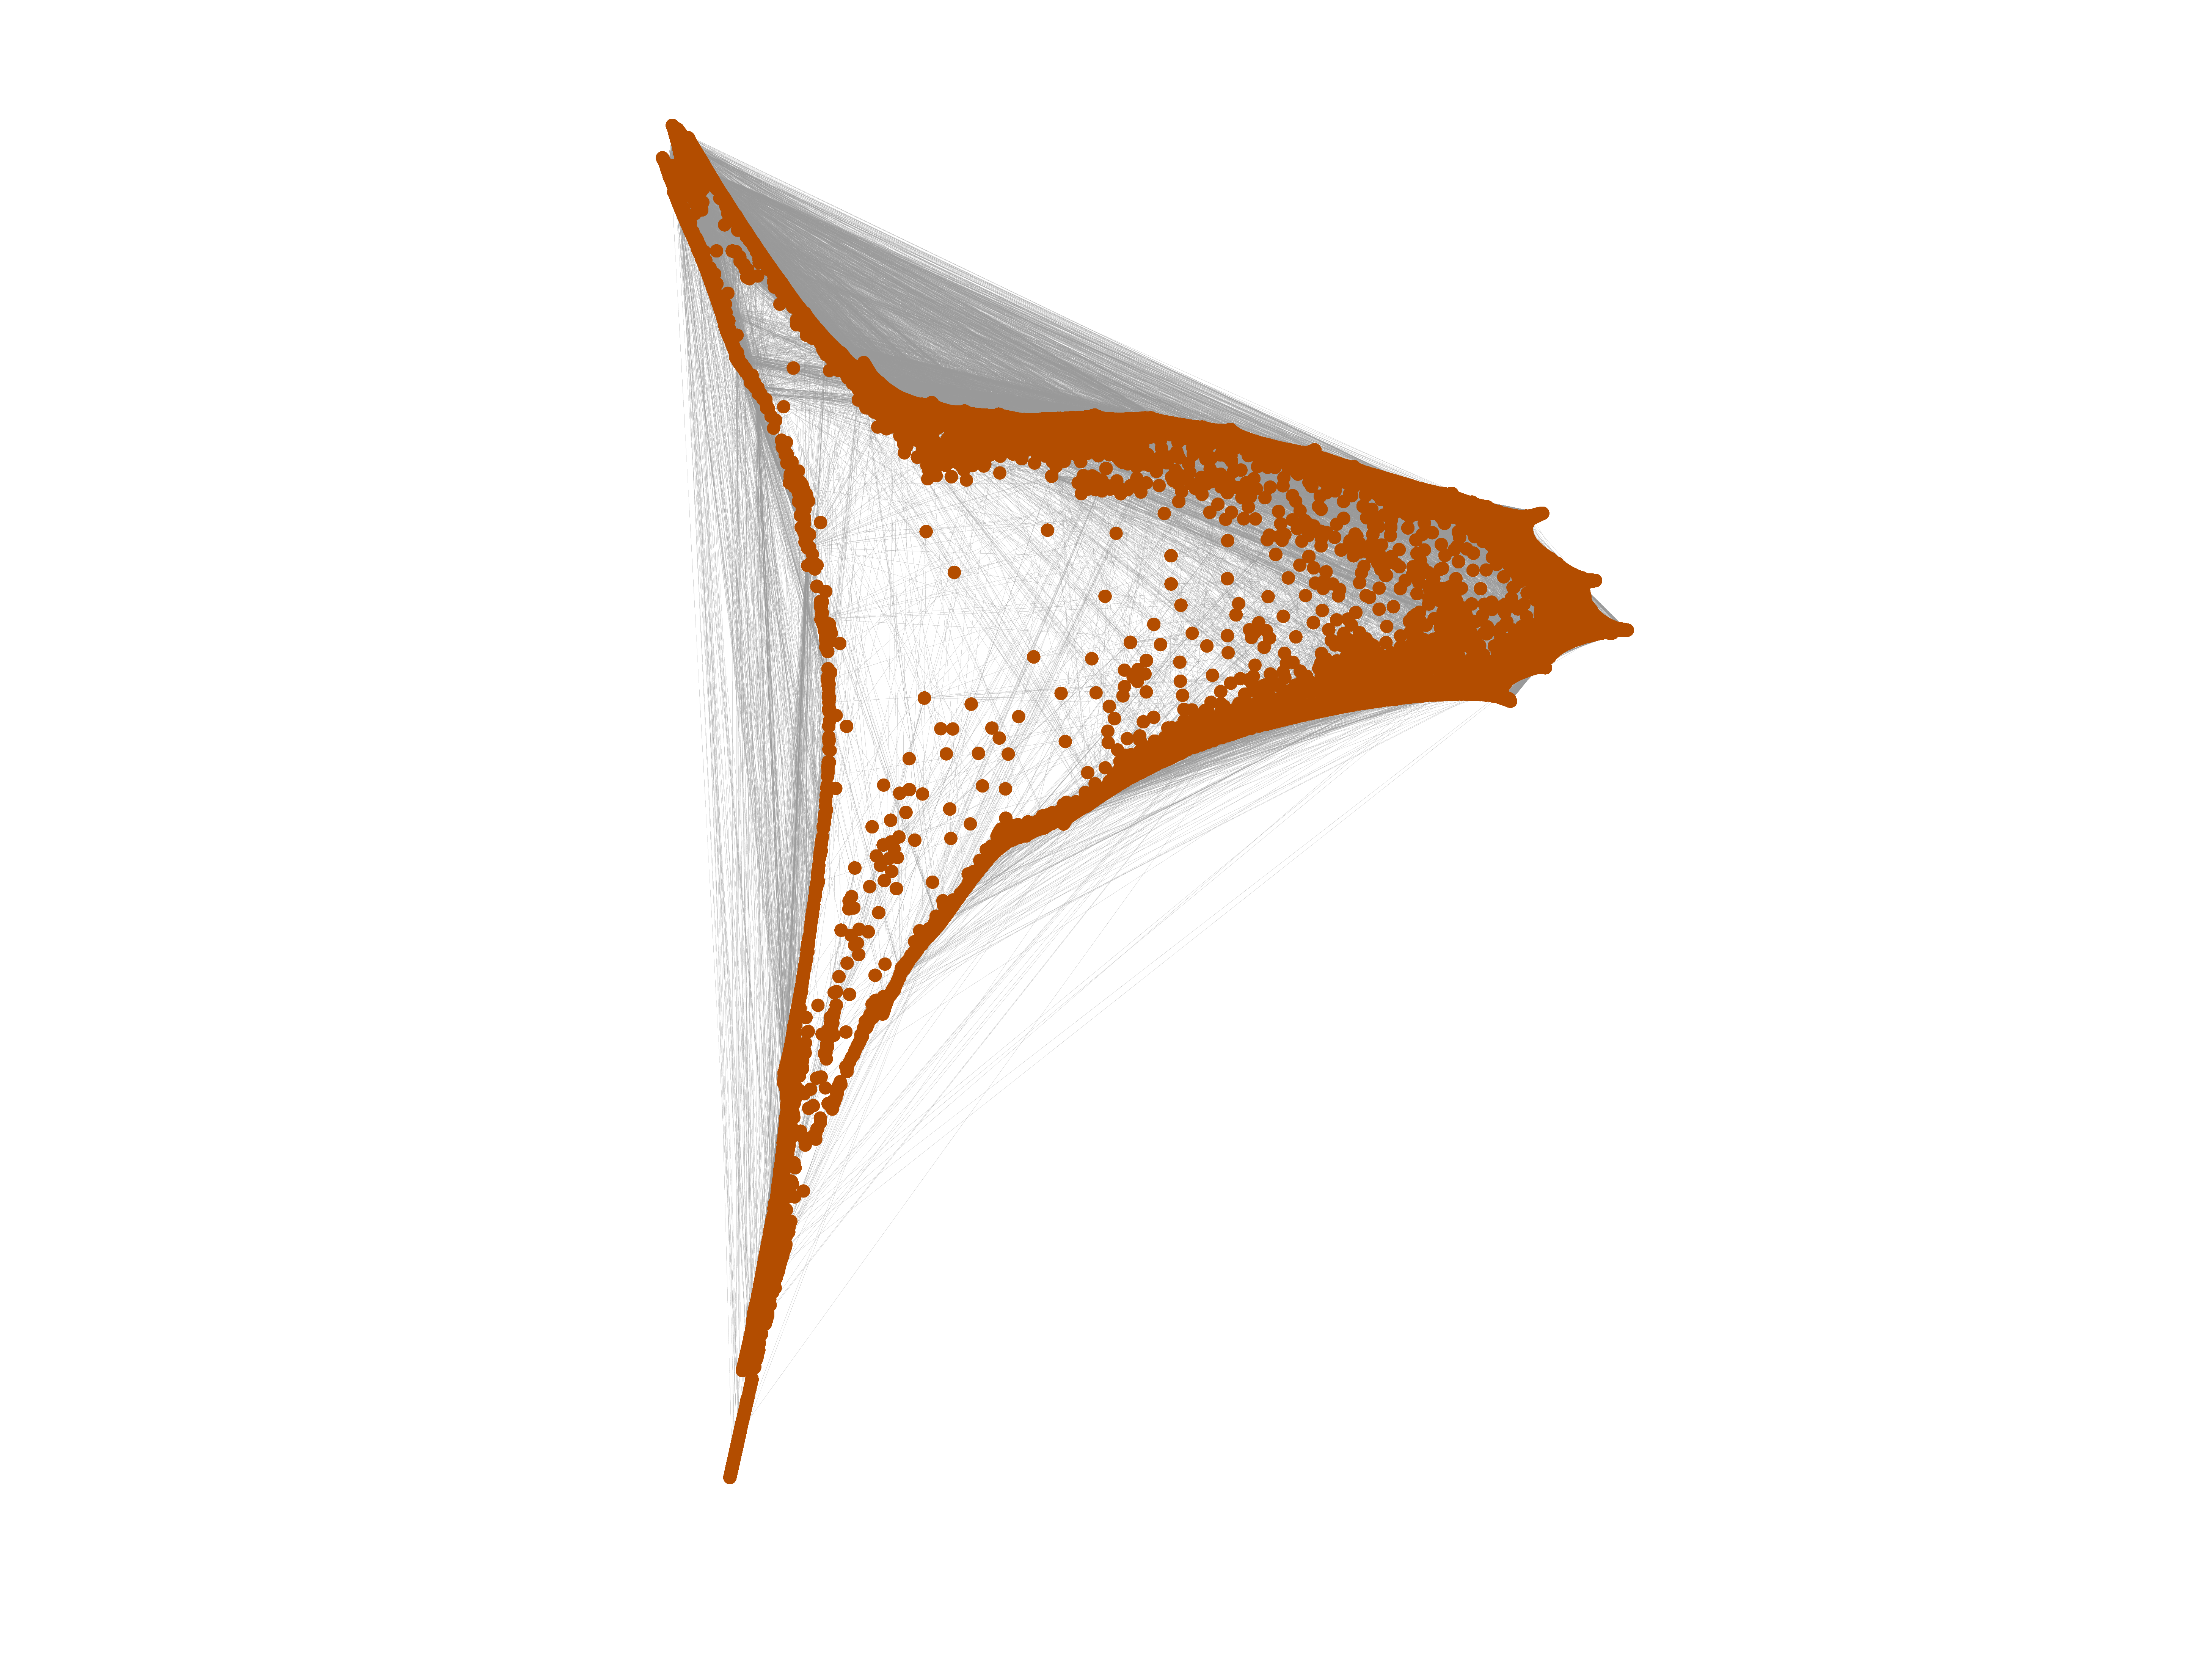
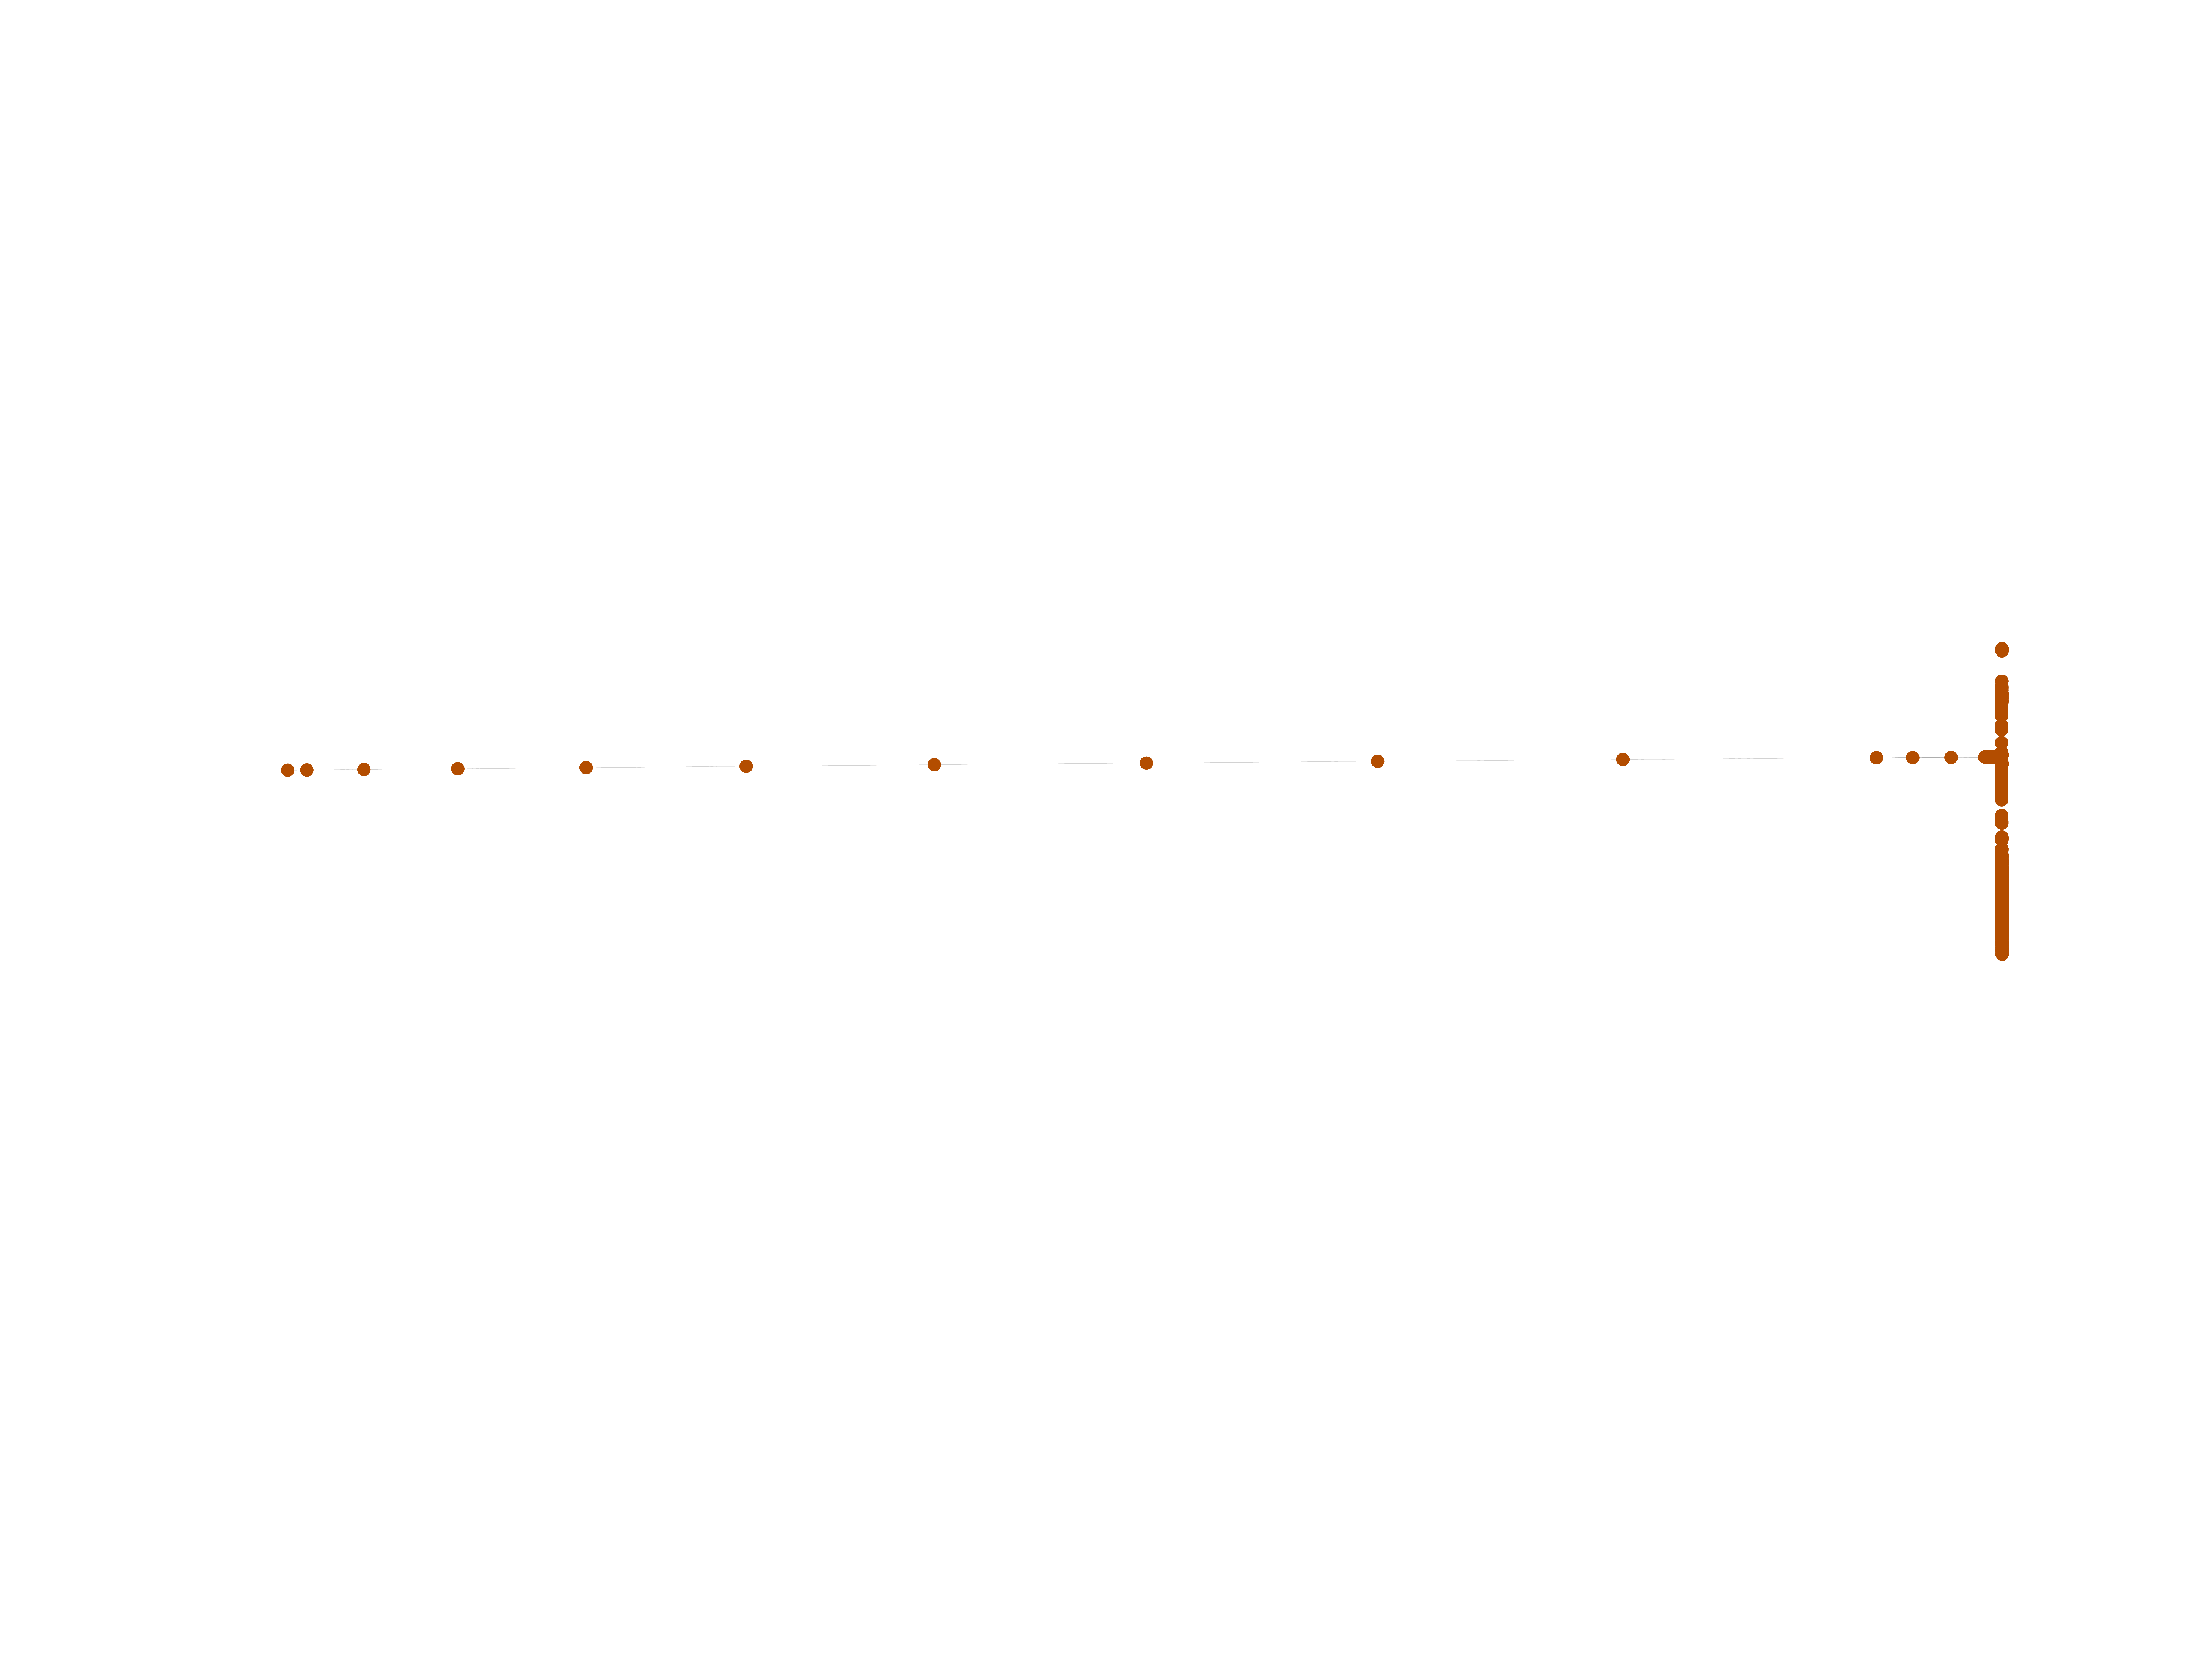
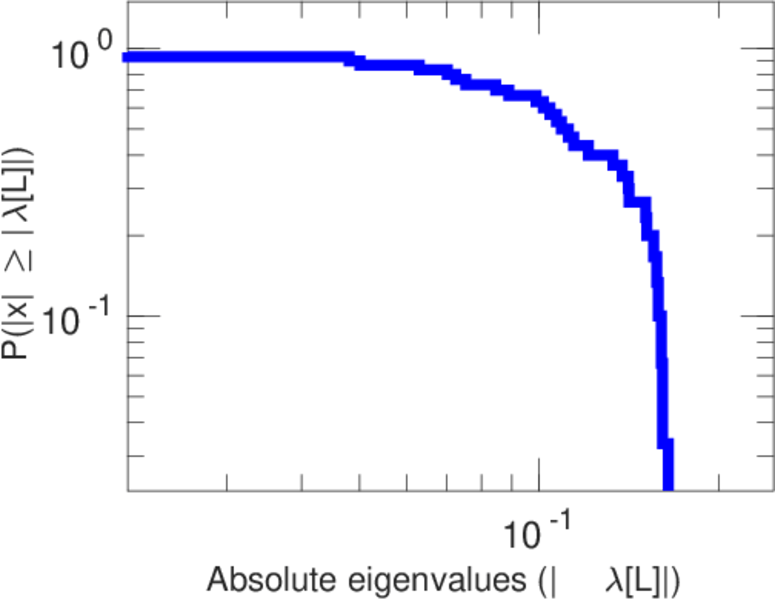
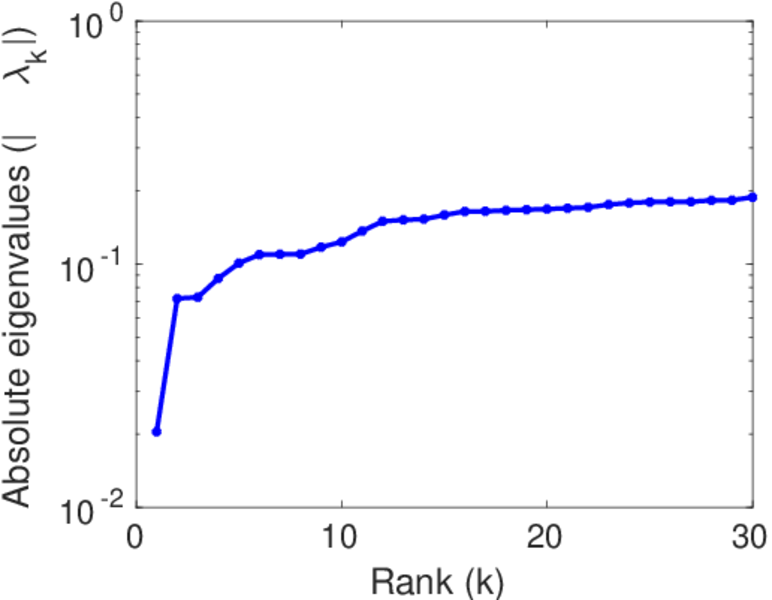
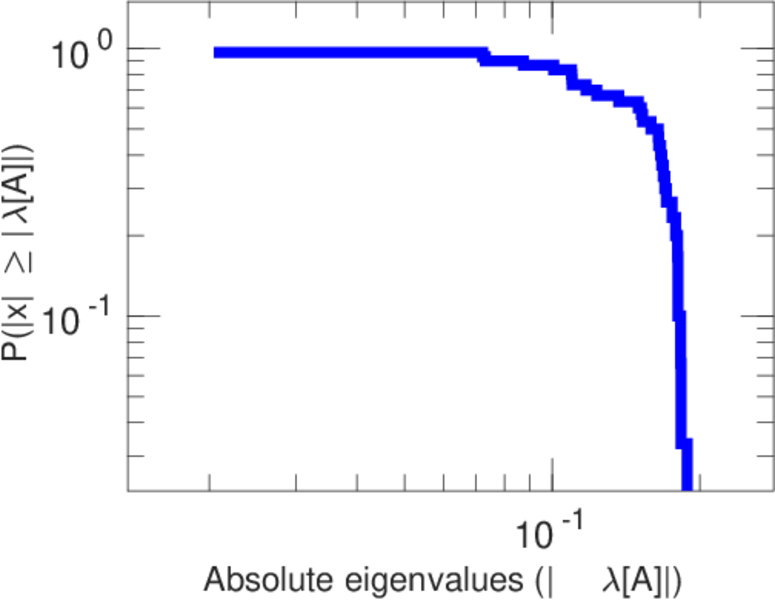
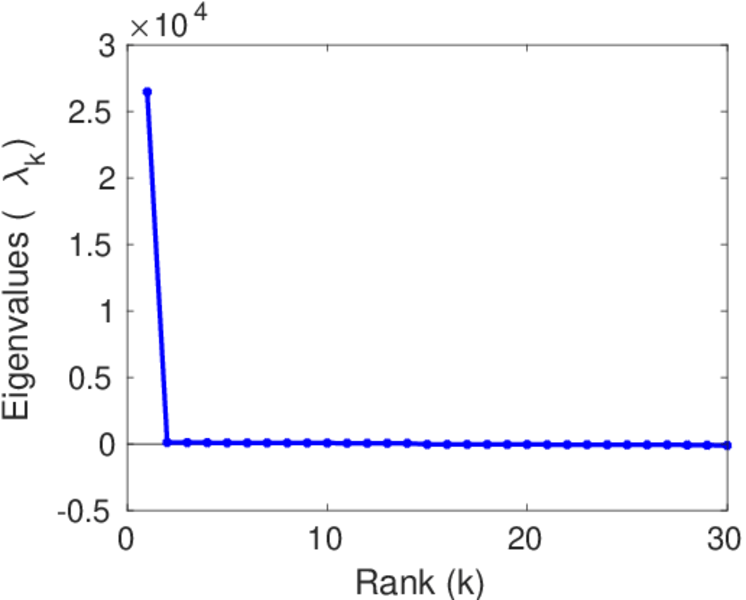
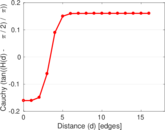
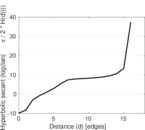
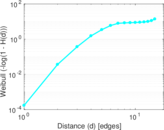
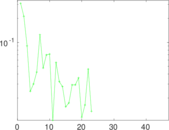
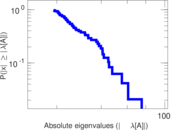
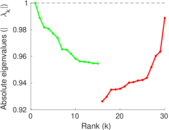
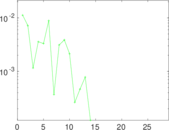
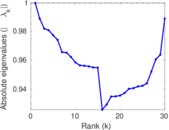
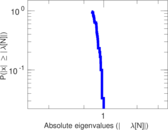
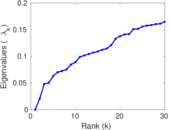
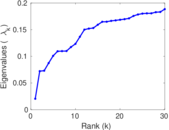
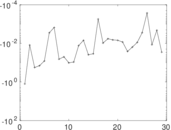
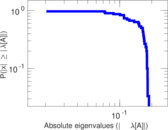
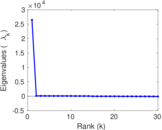
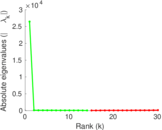
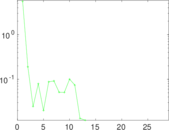
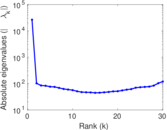
Plots


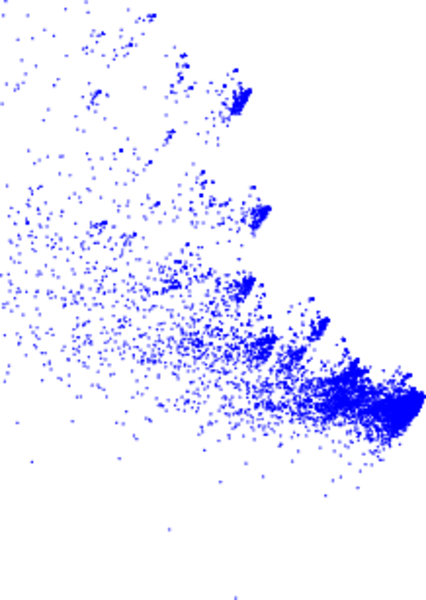
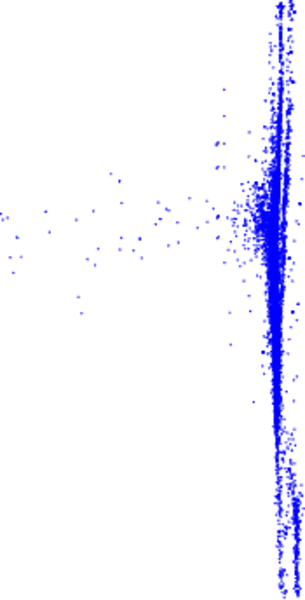
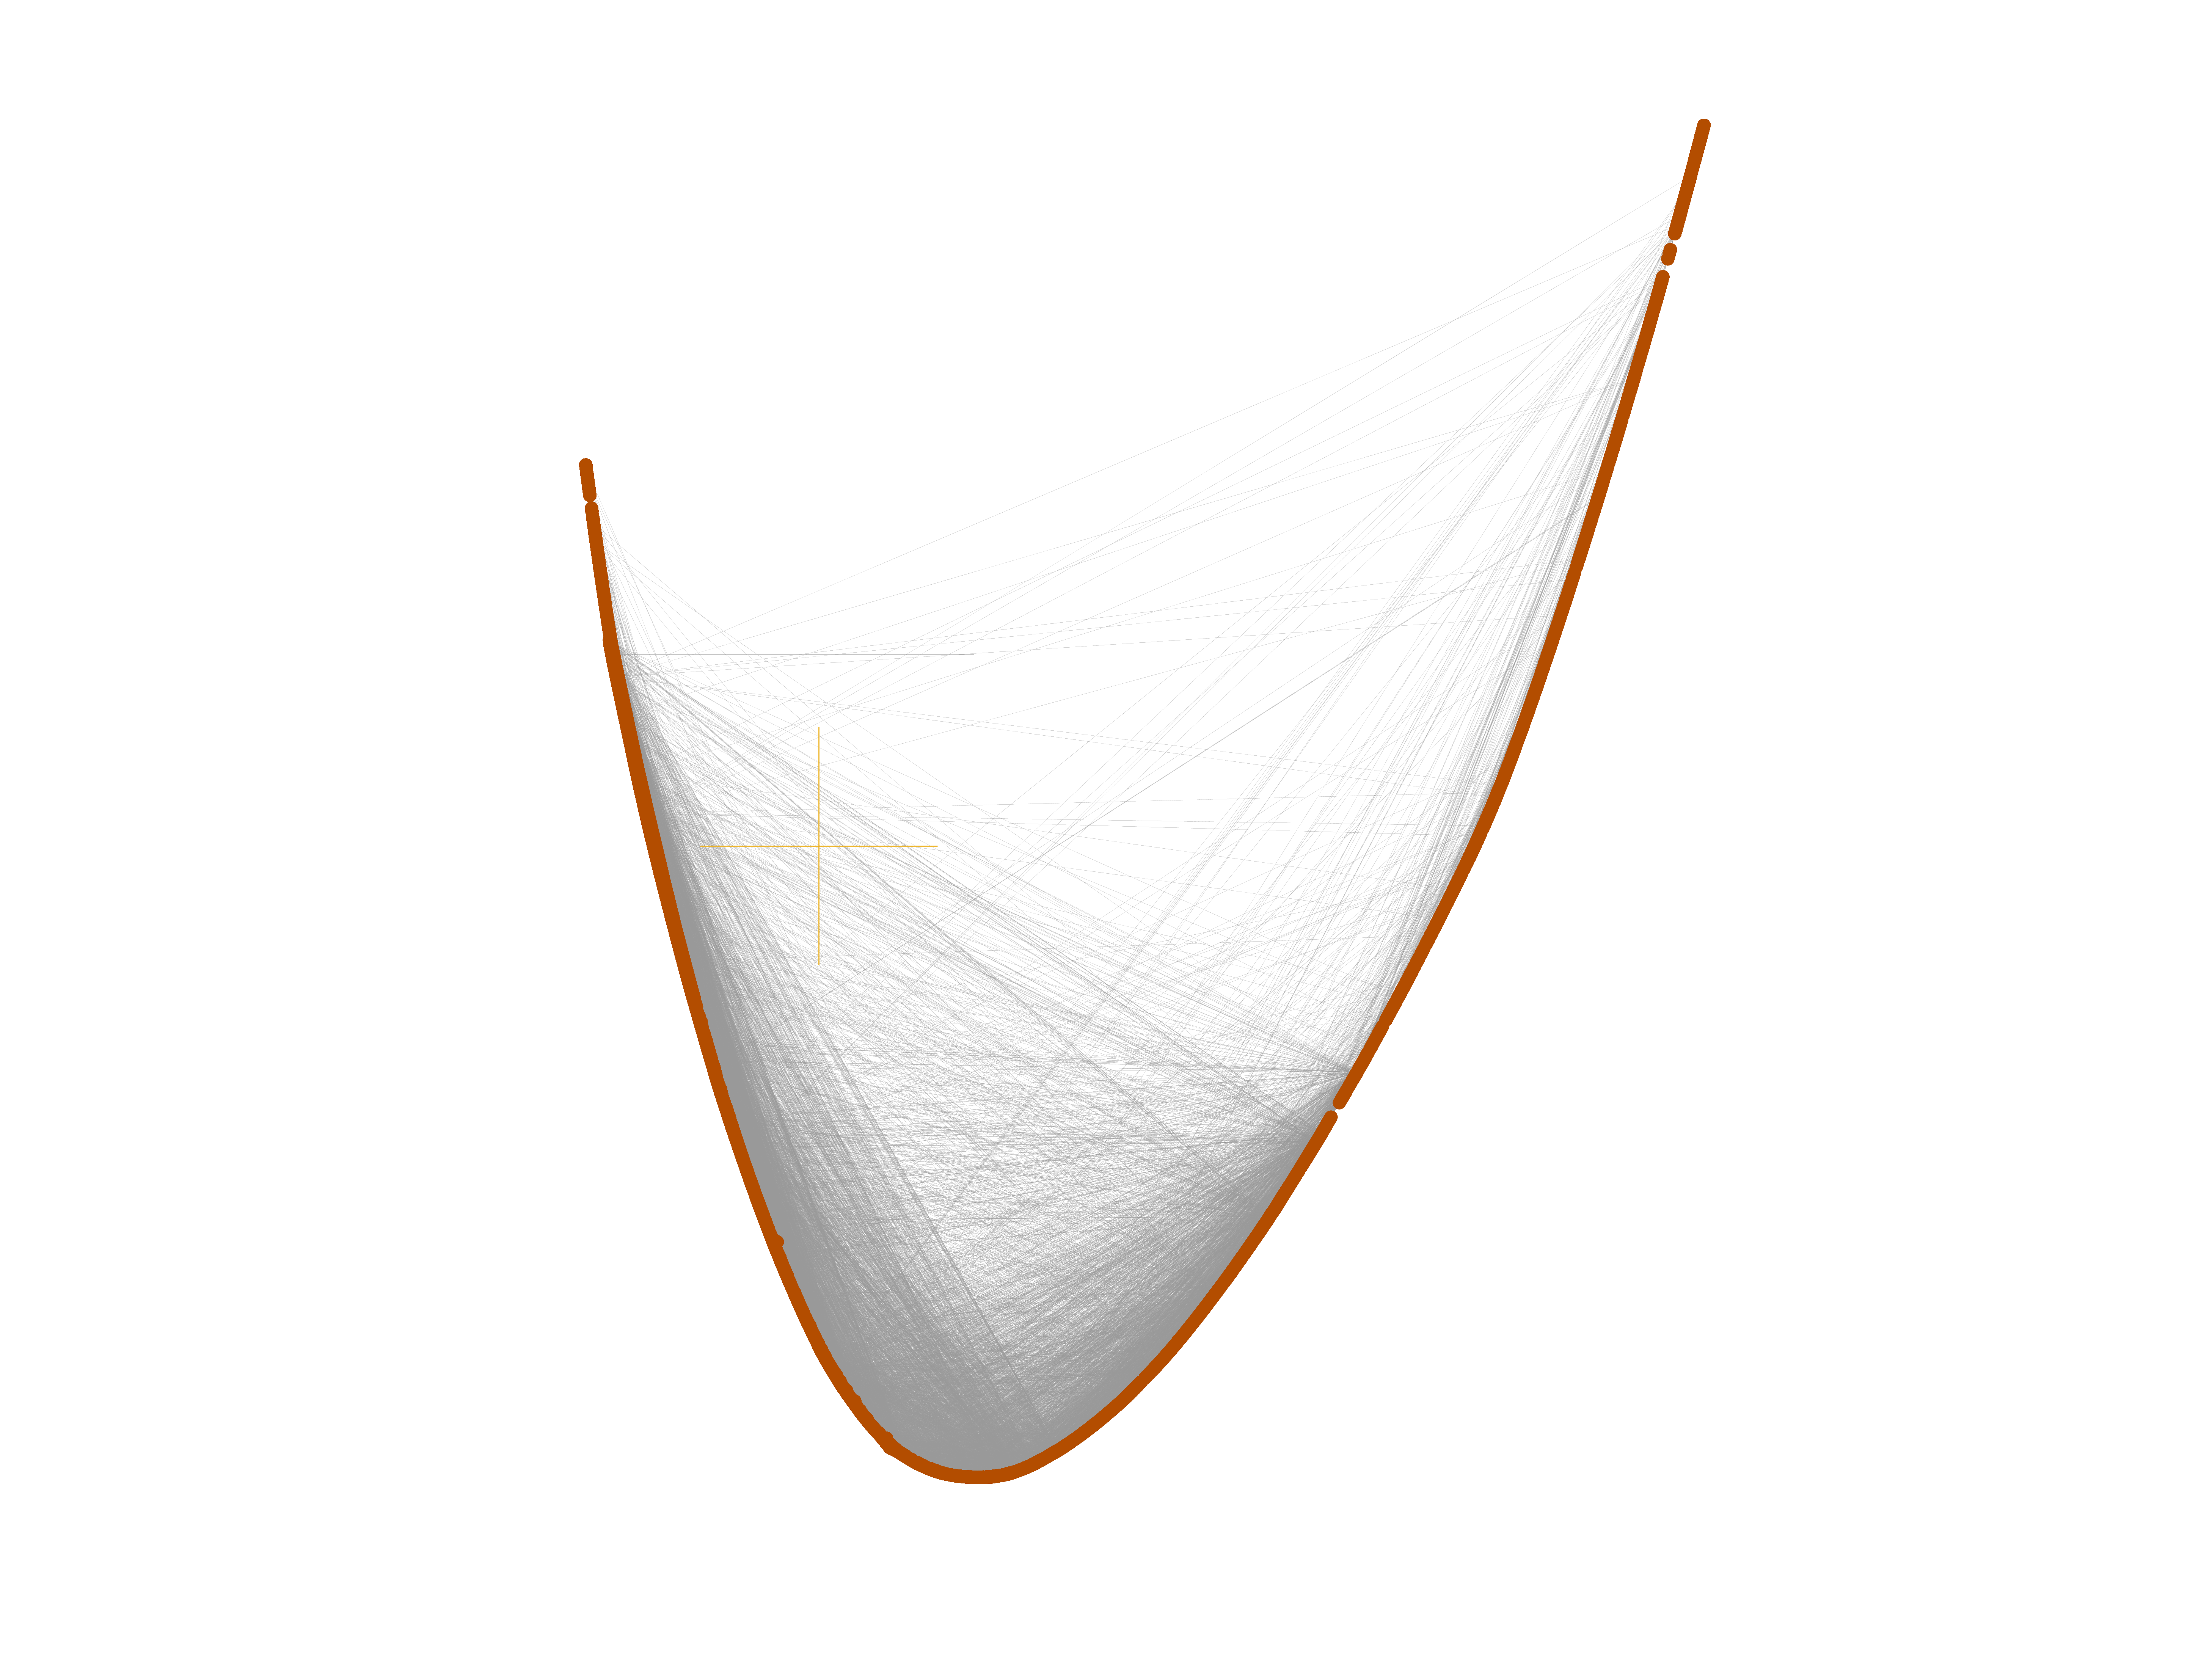
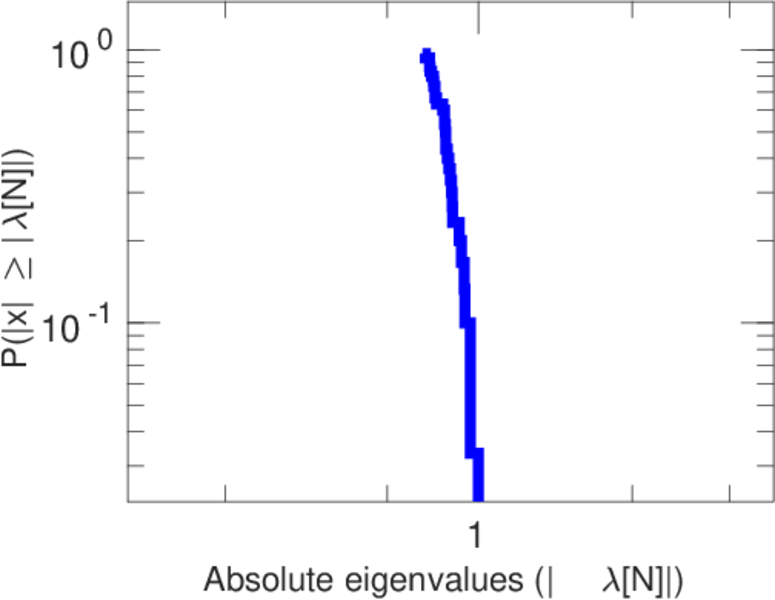
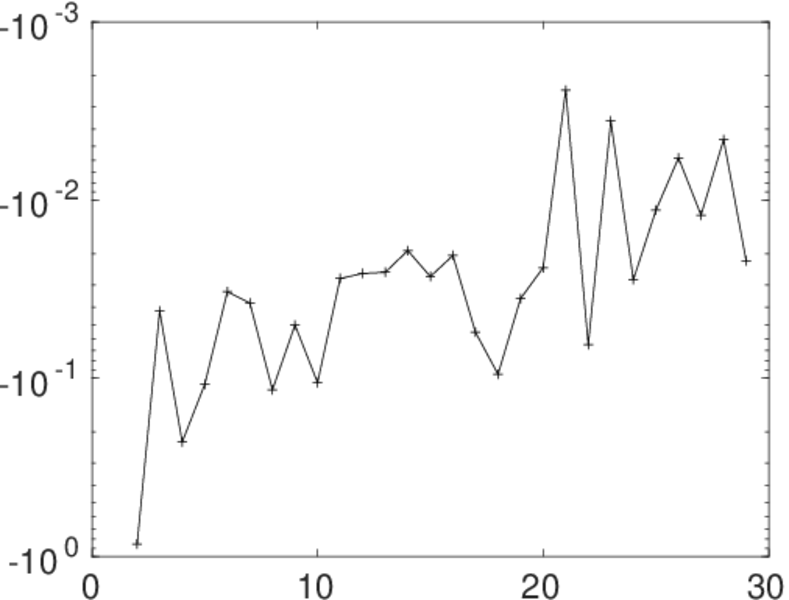
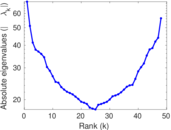
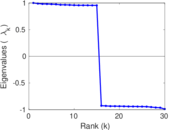
Matrix decompositions plots


Downloads
References
|
[1]
|
Jérôme Kunegis.
KONECT – The Koblenz Network Collection.
In Proc. Int. Conf. on World Wide Web Companion, pages
1343–1350, 2013.
[ http ]
|
|
[2]
|
Jure Leskovec, Jon Kleinberg, and Christos Faloutsos.
Graph evolution: Densification and shrinking diameters.
ACM Trans. Knowl. Discov. from Data, 1(1):1–40, 2007.
|
 KONECT ‣ Networks ‣
Buy Me a Coffee
KONECT ‣ Networks ‣
Buy Me a Coffee