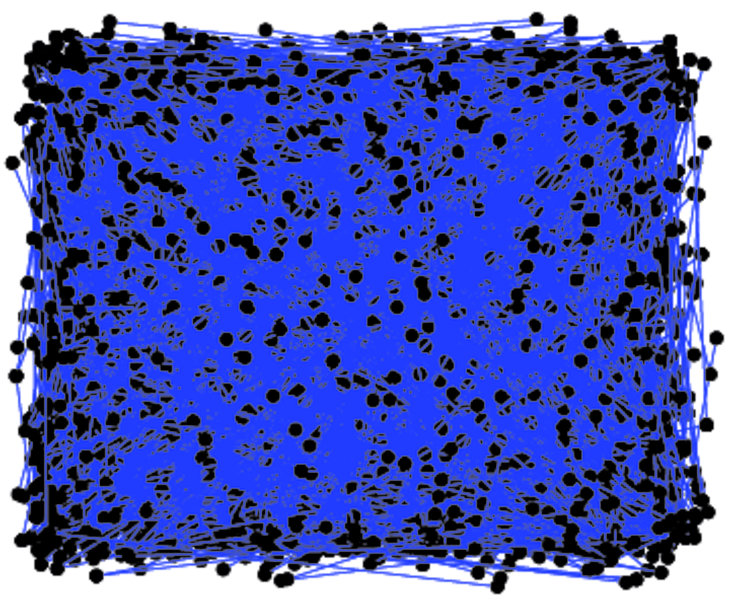
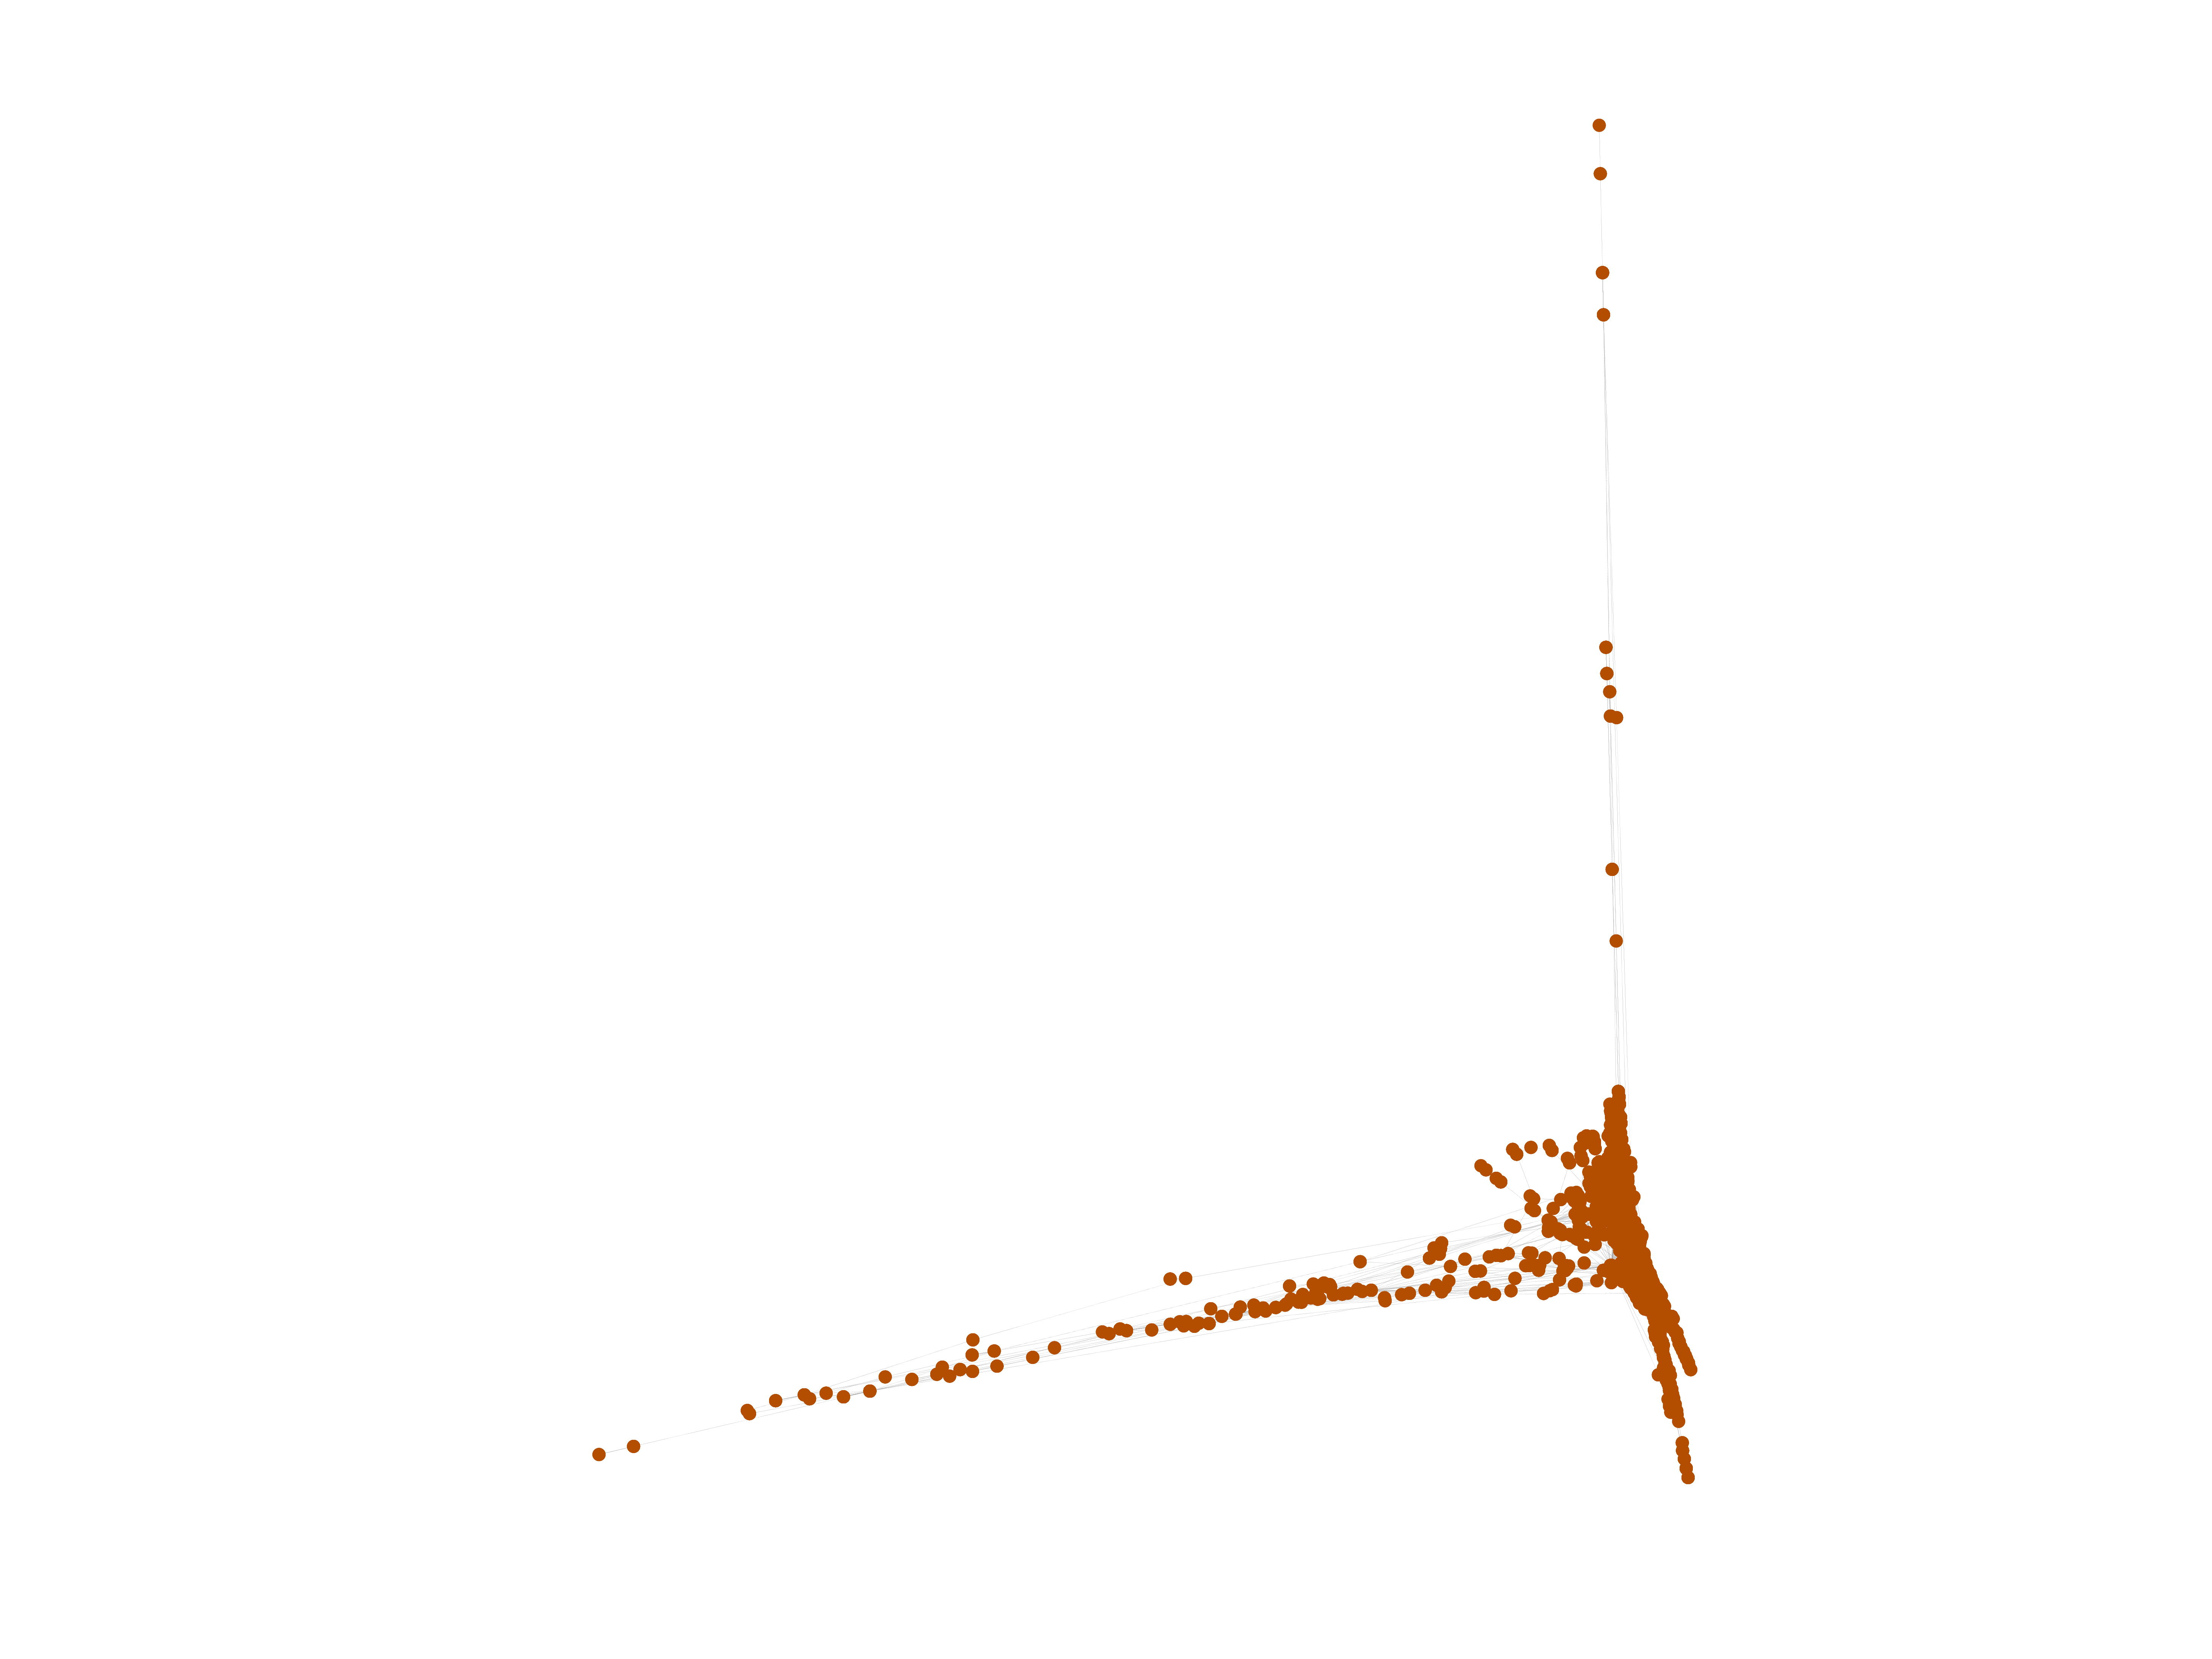
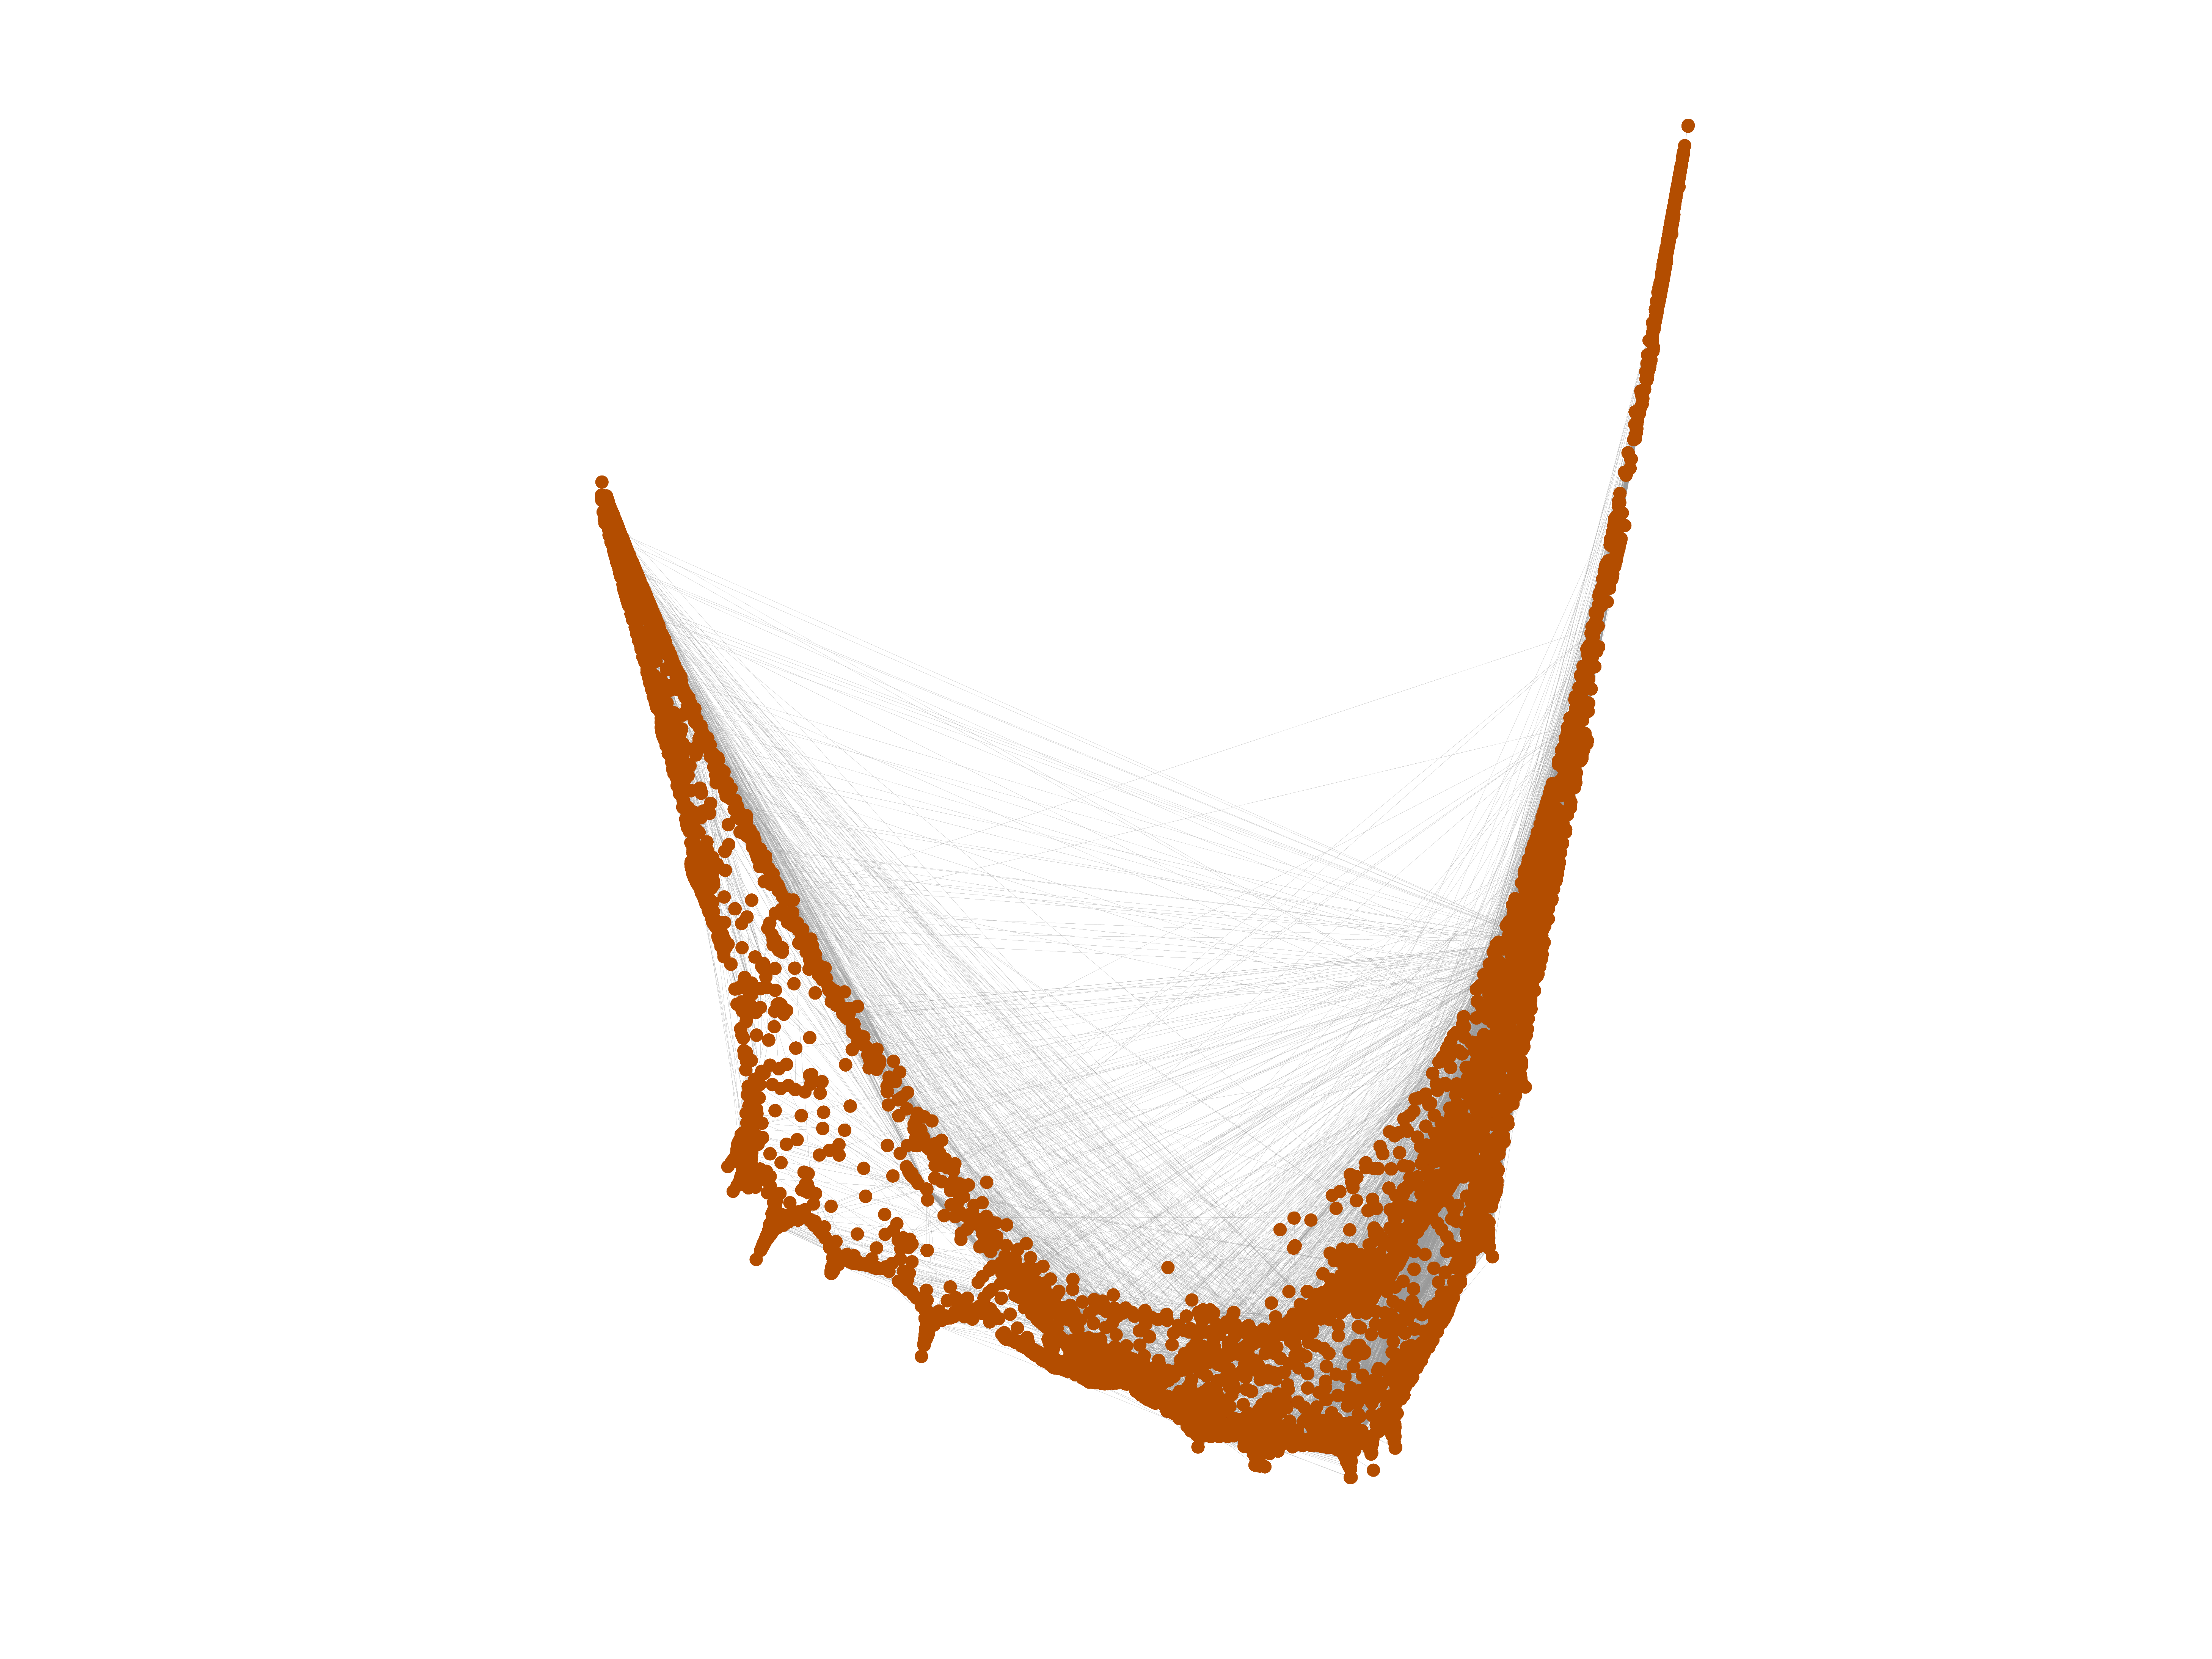
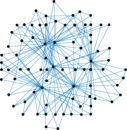
Route views
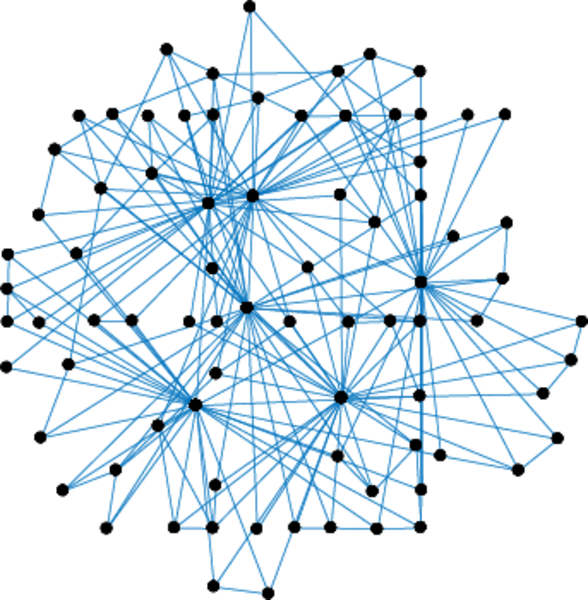
This is the undirected network of autonomous systems of the Internet connected
with each other. Nodes are autonomous systems (AS), and edges denote
communitation. The network contains loops.
Metadata
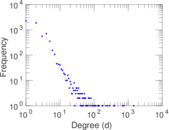
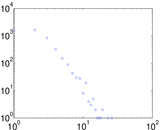
Statistics
| Size | n = | 6,474
|
| Volume | m = | 13,895
|
| Loop count | l = | 1,323
|
| Wedge count | s = | 2,059,364
|
| Claw count | z = | 674,974,421
|
| Cross count | x = | 212,651,094,228
|
| Triangle count | t = | 6,584
|
| Square count | q = | 288,840
|
| 4-Tour count | T4 = | 10,573,320
|
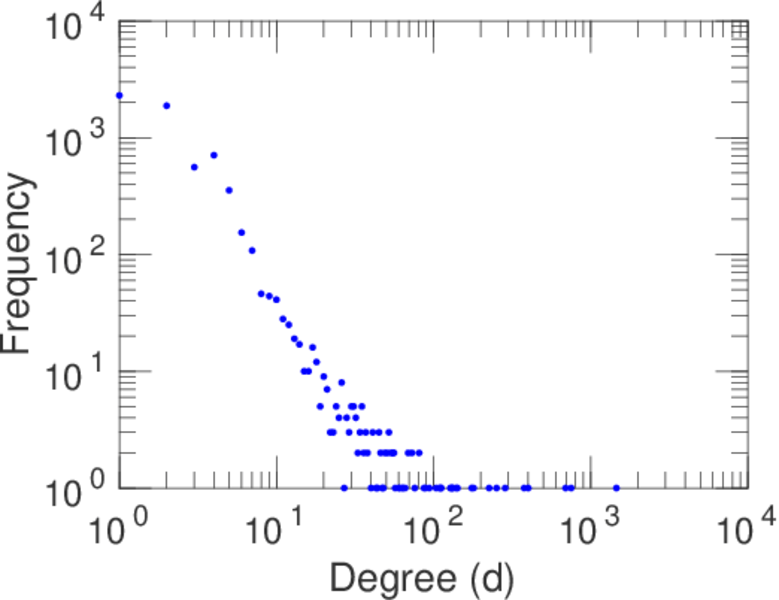
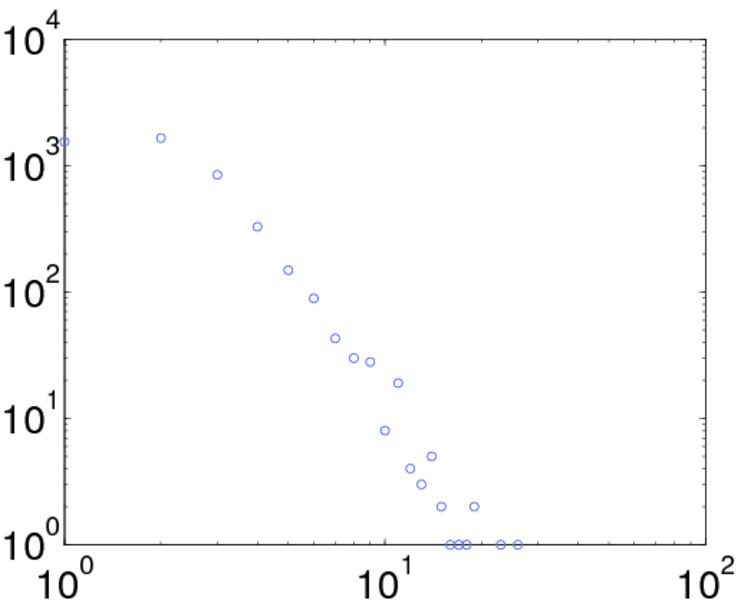
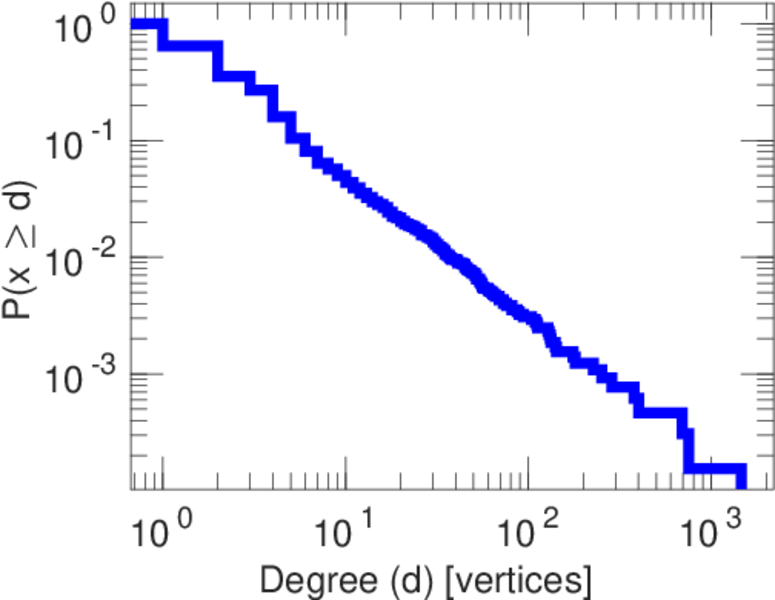
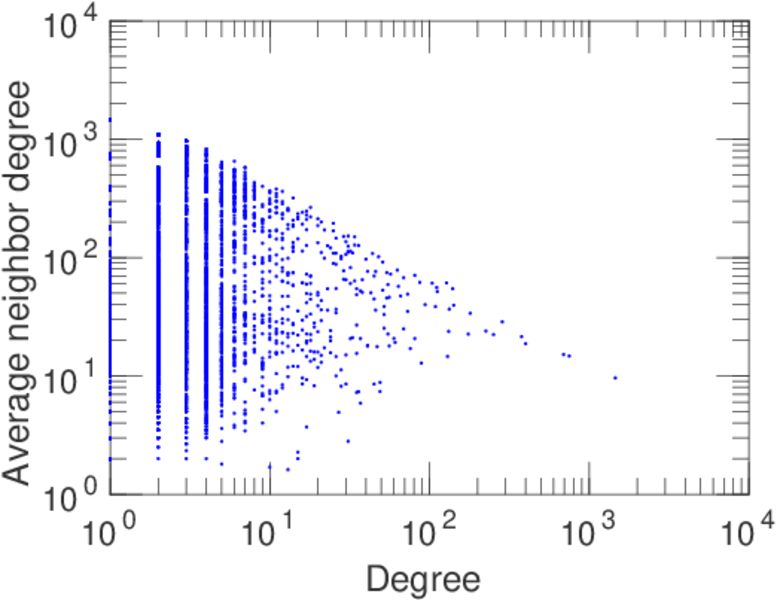
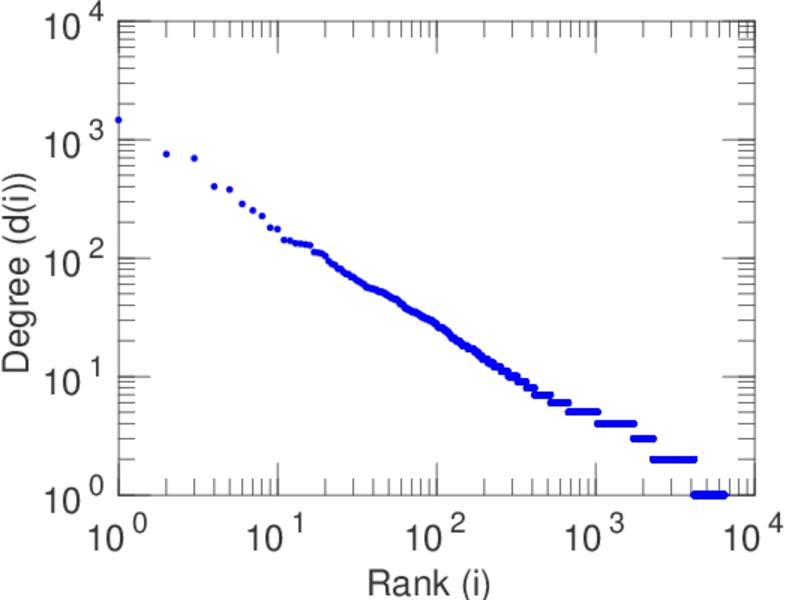
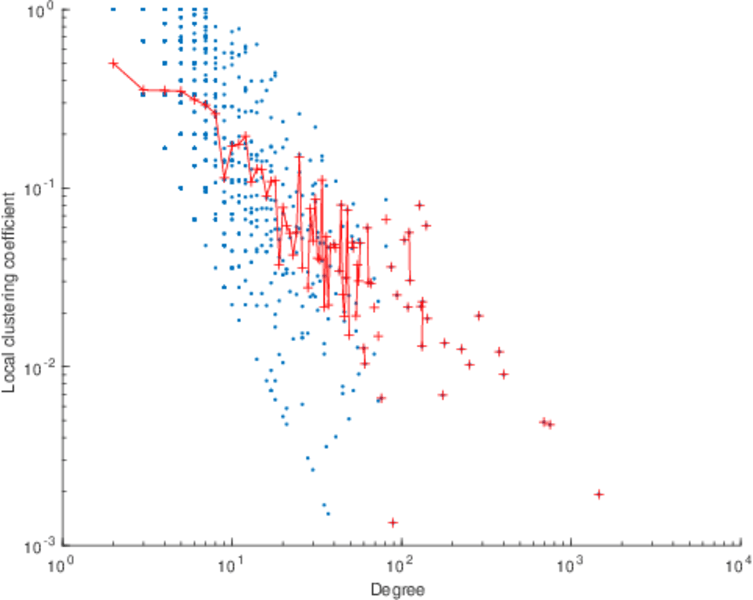
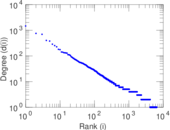
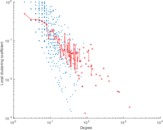
| Maximum degree | dmax = | 1,459
|
| Average degree | d = | 4.292 55
|
| Fill | p = | 0.000 662 943
|
| Size of LCC | N = | 6,474
|
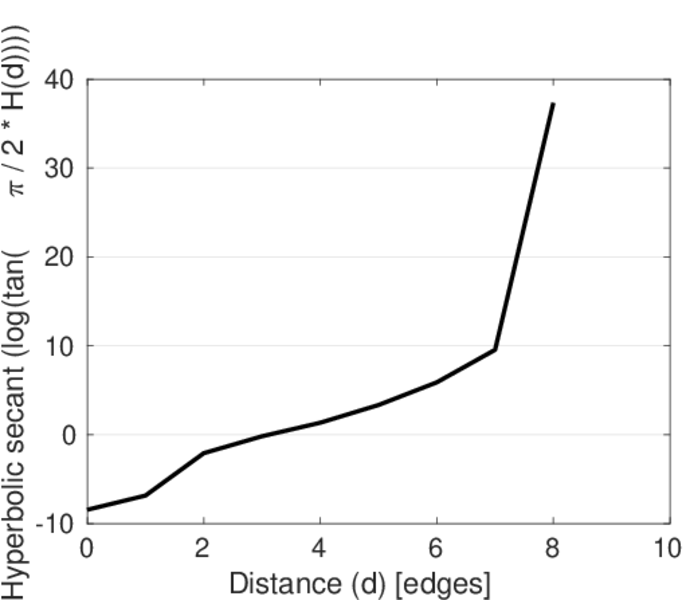
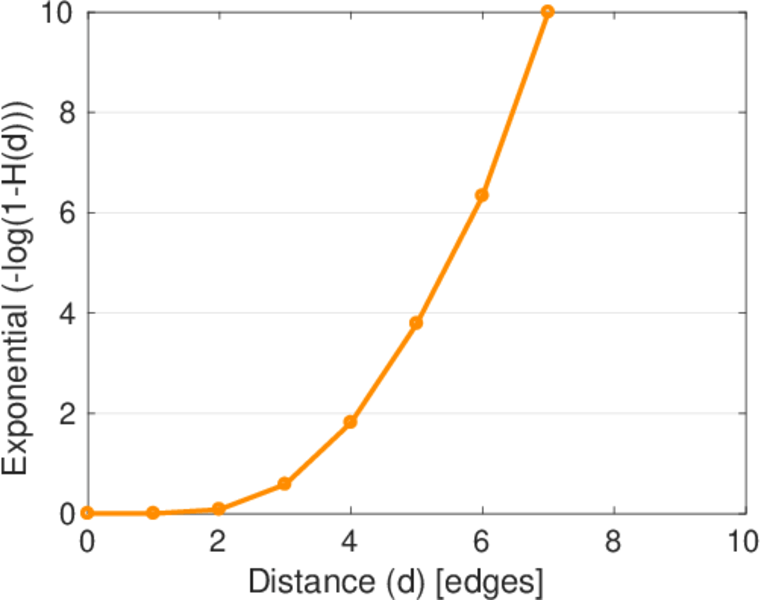
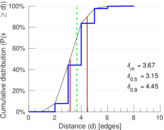
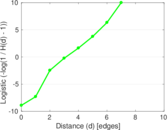
| Diameter | δ = | 9
|
| 50-Percentile effective diameter | δ0.5 = | 3.148 22
|
| 90-Percentile effective diameter | δ0.9 = | 4.449 21
|
| Median distance | δM = | 4
|
| Mean distance | δm = | 3.666 86
|
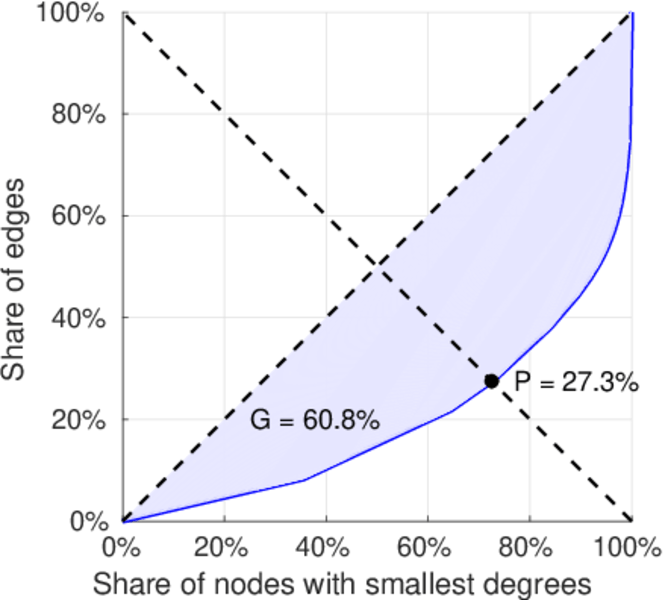
| Gini coefficient | G = | 0.608 189
|
| Balanced inequality ratio | P = | 0.273 480
|
| Relative edge distribution entropy | Her = | 0.853 888
|
| Power law exponent | γ = | 2.336 32
|
| Tail power law exponent | γt = | 2.111 00
|
| Tail power law exponent with p | γ3 = | 2.111 00
|
| p-value | p = | 0.291 000
|
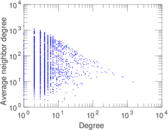
| Degree assortativity | ρ = | −0.181 755
|
| Degree assortativity p-value | pρ = | 1.098 82 × 10−185
|
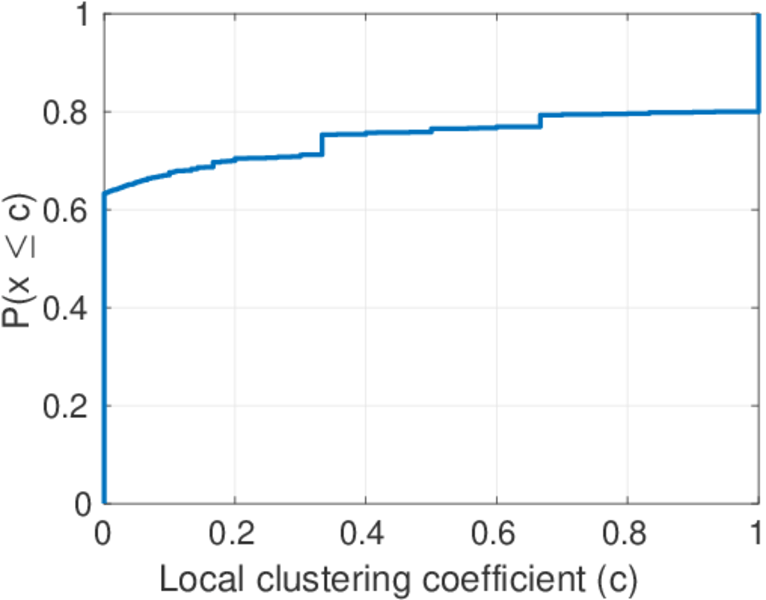
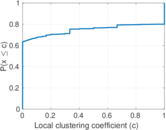
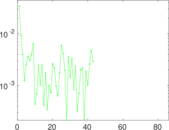
| Clustering coefficient | c = | 0.009 591 31
|
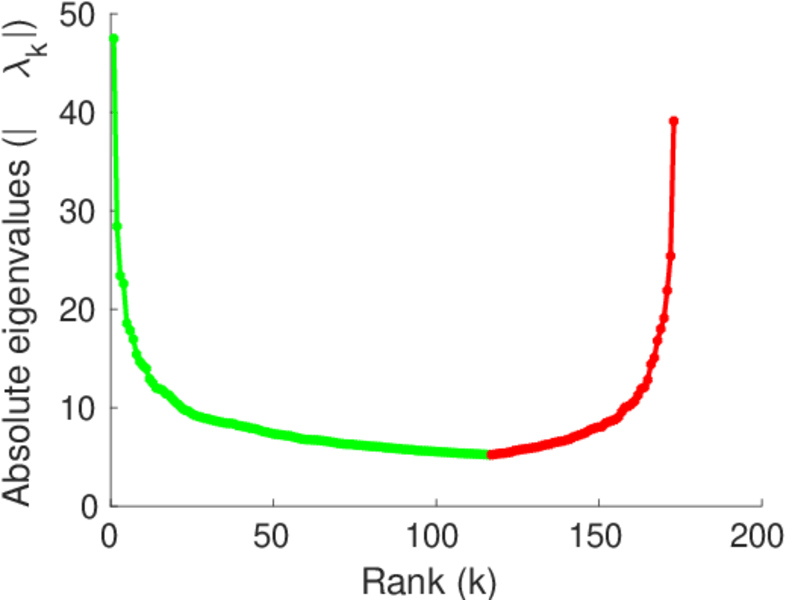
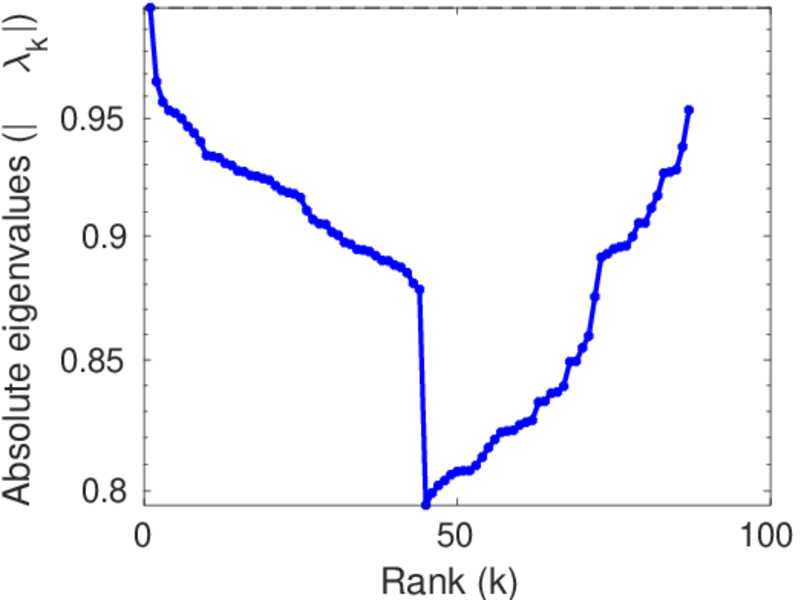
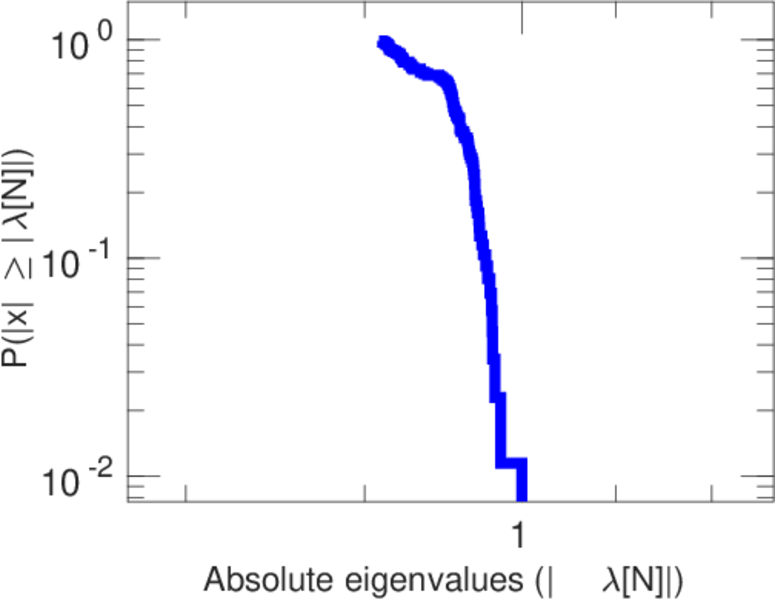
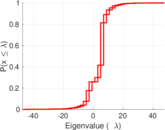
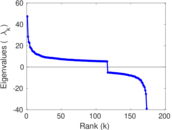
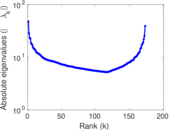
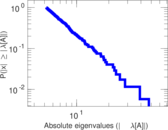
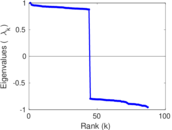
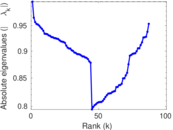
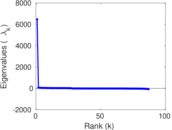
| Spectral norm | α = | 47.476 6
|
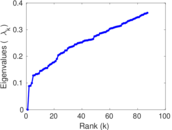
| Algebraic connectivity | a = | 0.088 030 8
|
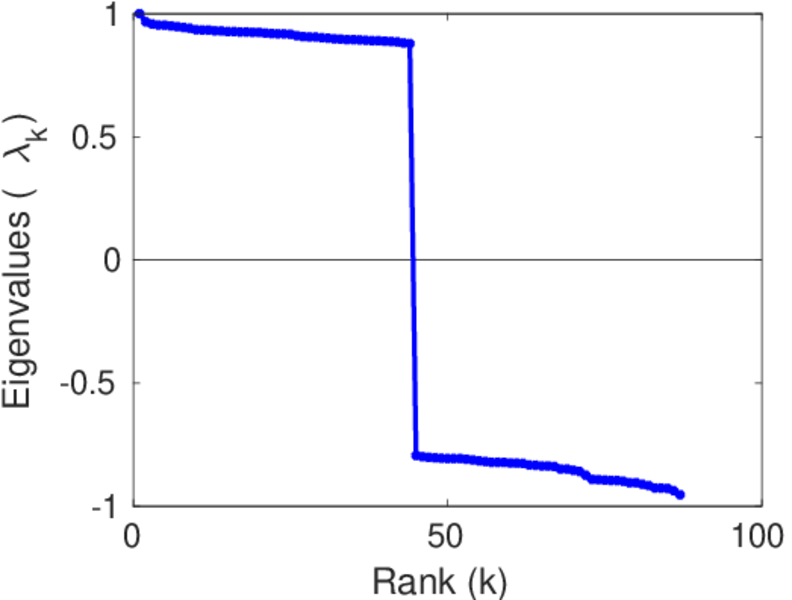
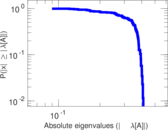
| Spectral separation | |λ1[A] / λ2[A]| = | 1.214 21
|
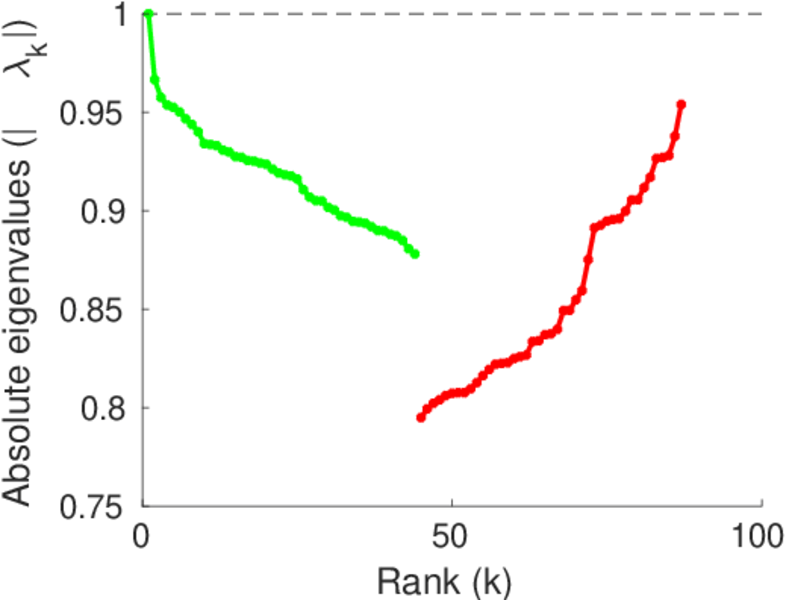
| Non-bipartivity | bA = | 0.176 419
|
| Normalized non-bipartivity | bN = | 0.045 798 5
|
| Algebraic non-bipartivity | χ = | 0.089 770 8
|
| Spectral bipartite frustration | bK = | 0.005 228 29
|
| Controllability | C = | 3,605
|
| Relative controllability | Cr = | 0.556 843
|
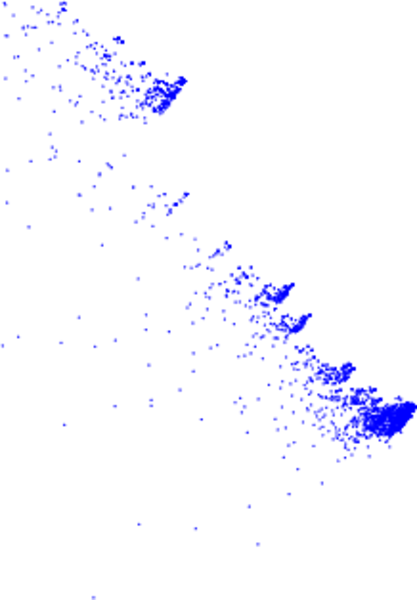
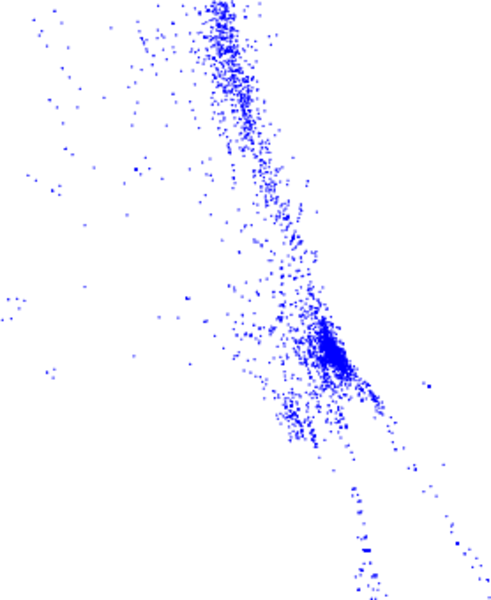
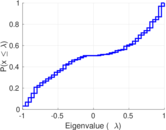
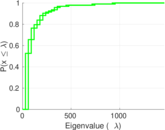
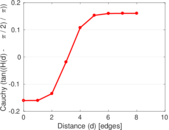
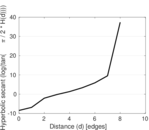
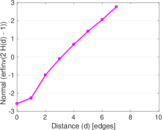
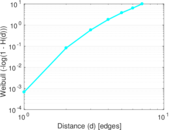
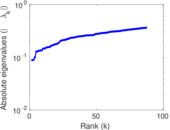
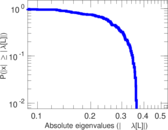
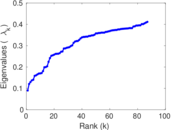
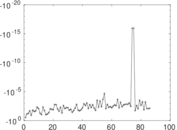
Plots


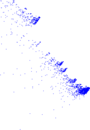
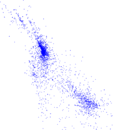


Matrix decompositions plots


Downloads
References
|
[1]
|
Jérôme Kunegis.
KONECT – The Koblenz Network Collection.
In Proc. Int. Conf. on World Wide Web Companion, pages
1343–1350, 2013.
[ http ]
|
|
[2]
|
Jure Leskovec, Jon Kleinberg, and Christos Faloutsos.
Graph evolution: Densification and shrinking diameters.
ACM Trans. Knowl. Discov. from Data, 1(1):1–40, 2007.
|
 KONECT ‣ Networks ‣
Buy Me a Coffee
KONECT ‣ Networks ‣
Buy Me a Coffee