Corporate club memberships

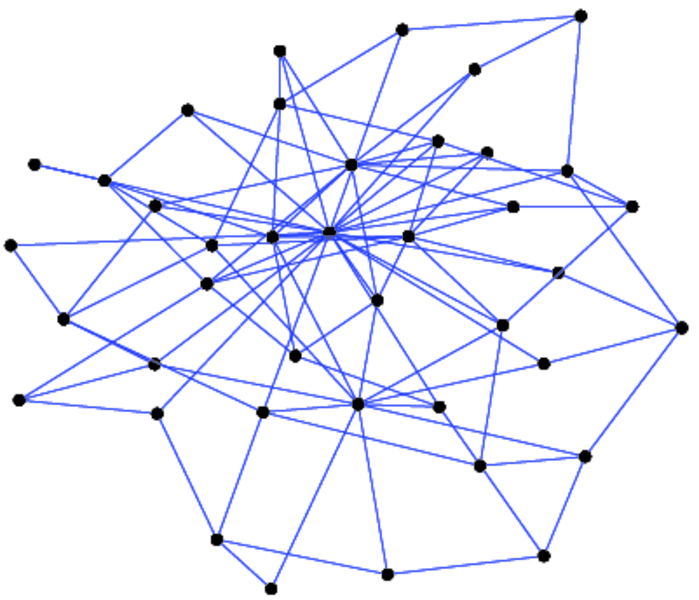
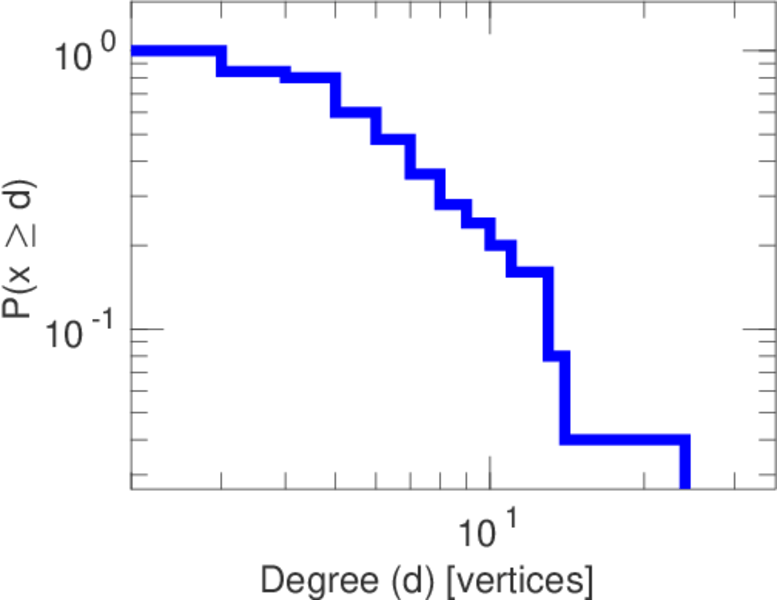
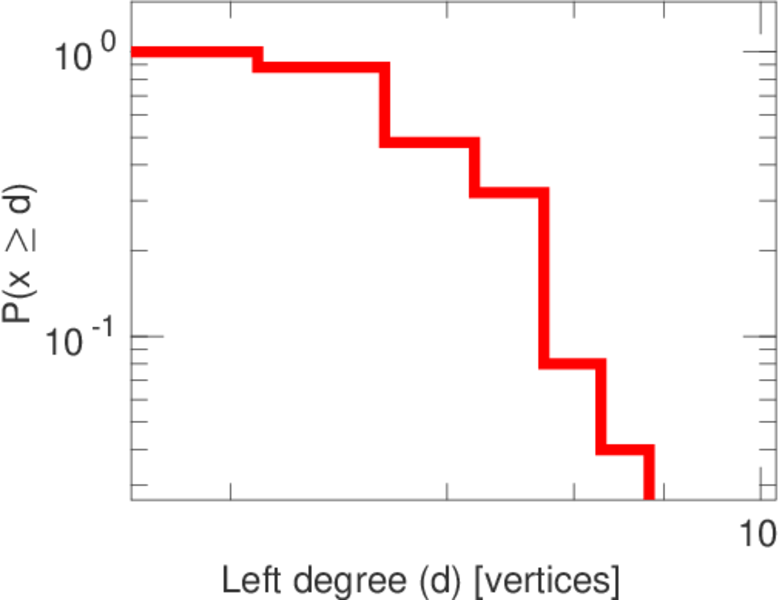
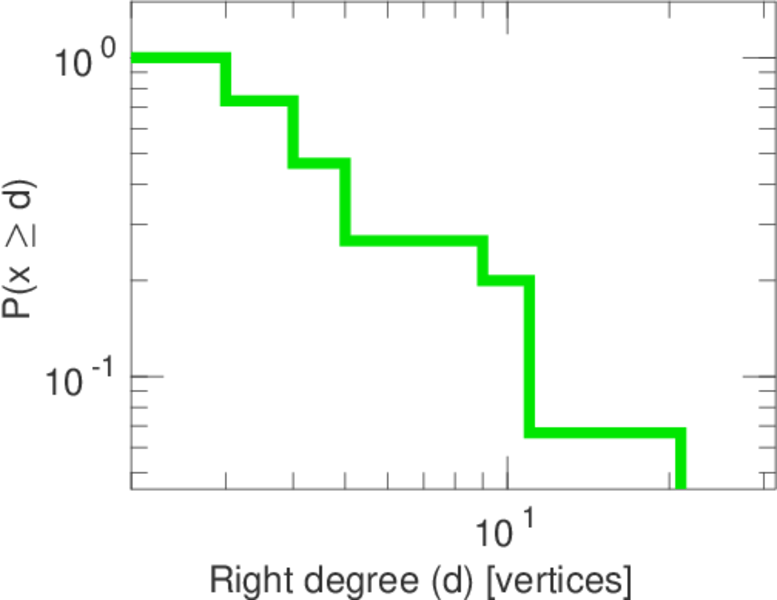
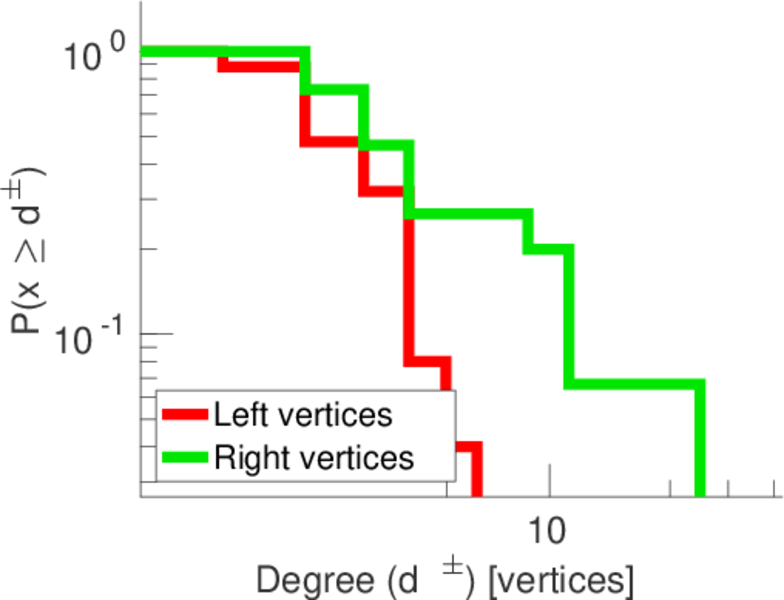
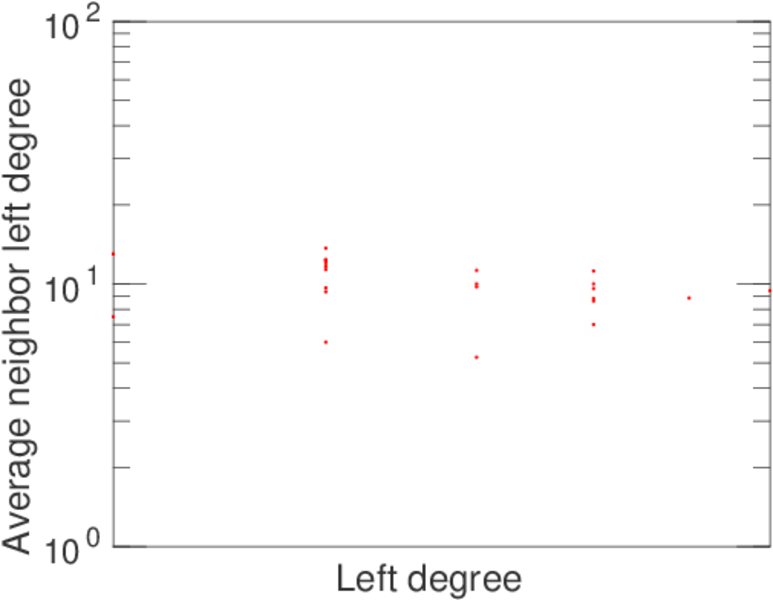
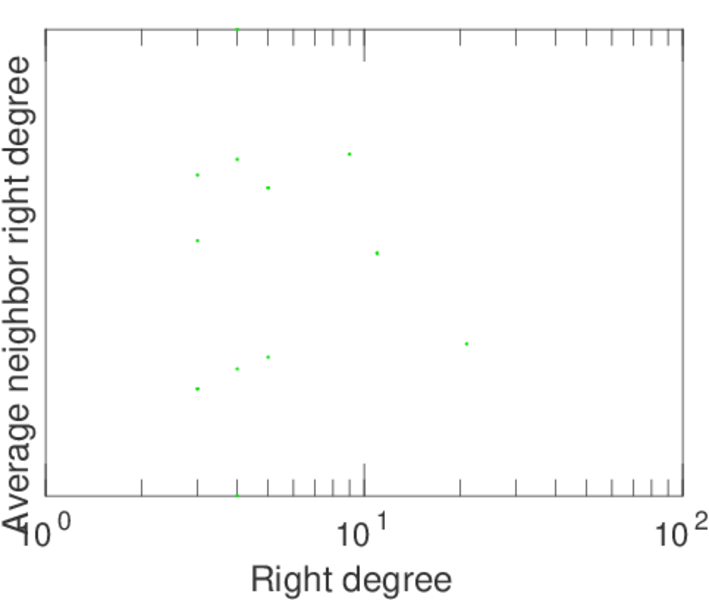
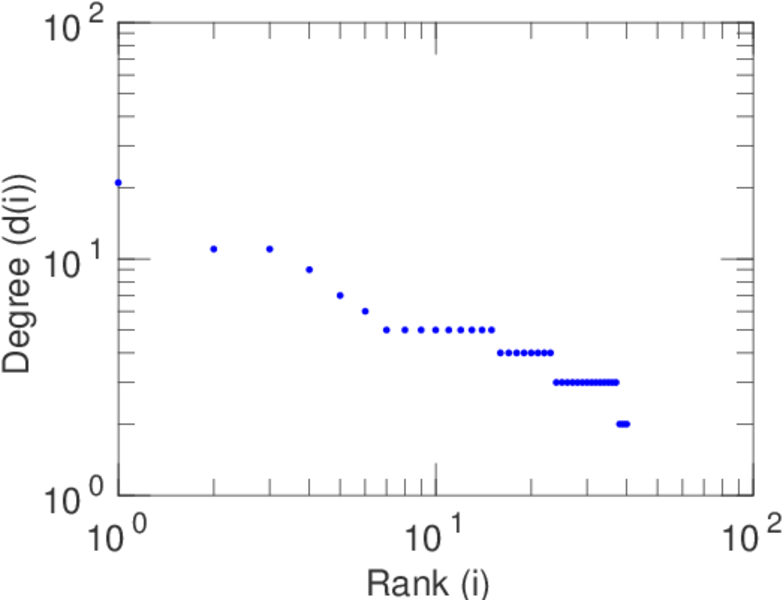
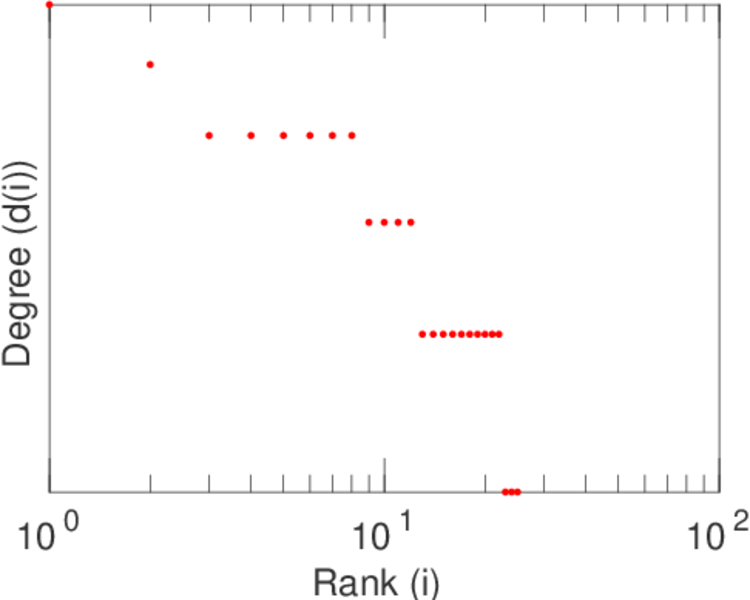
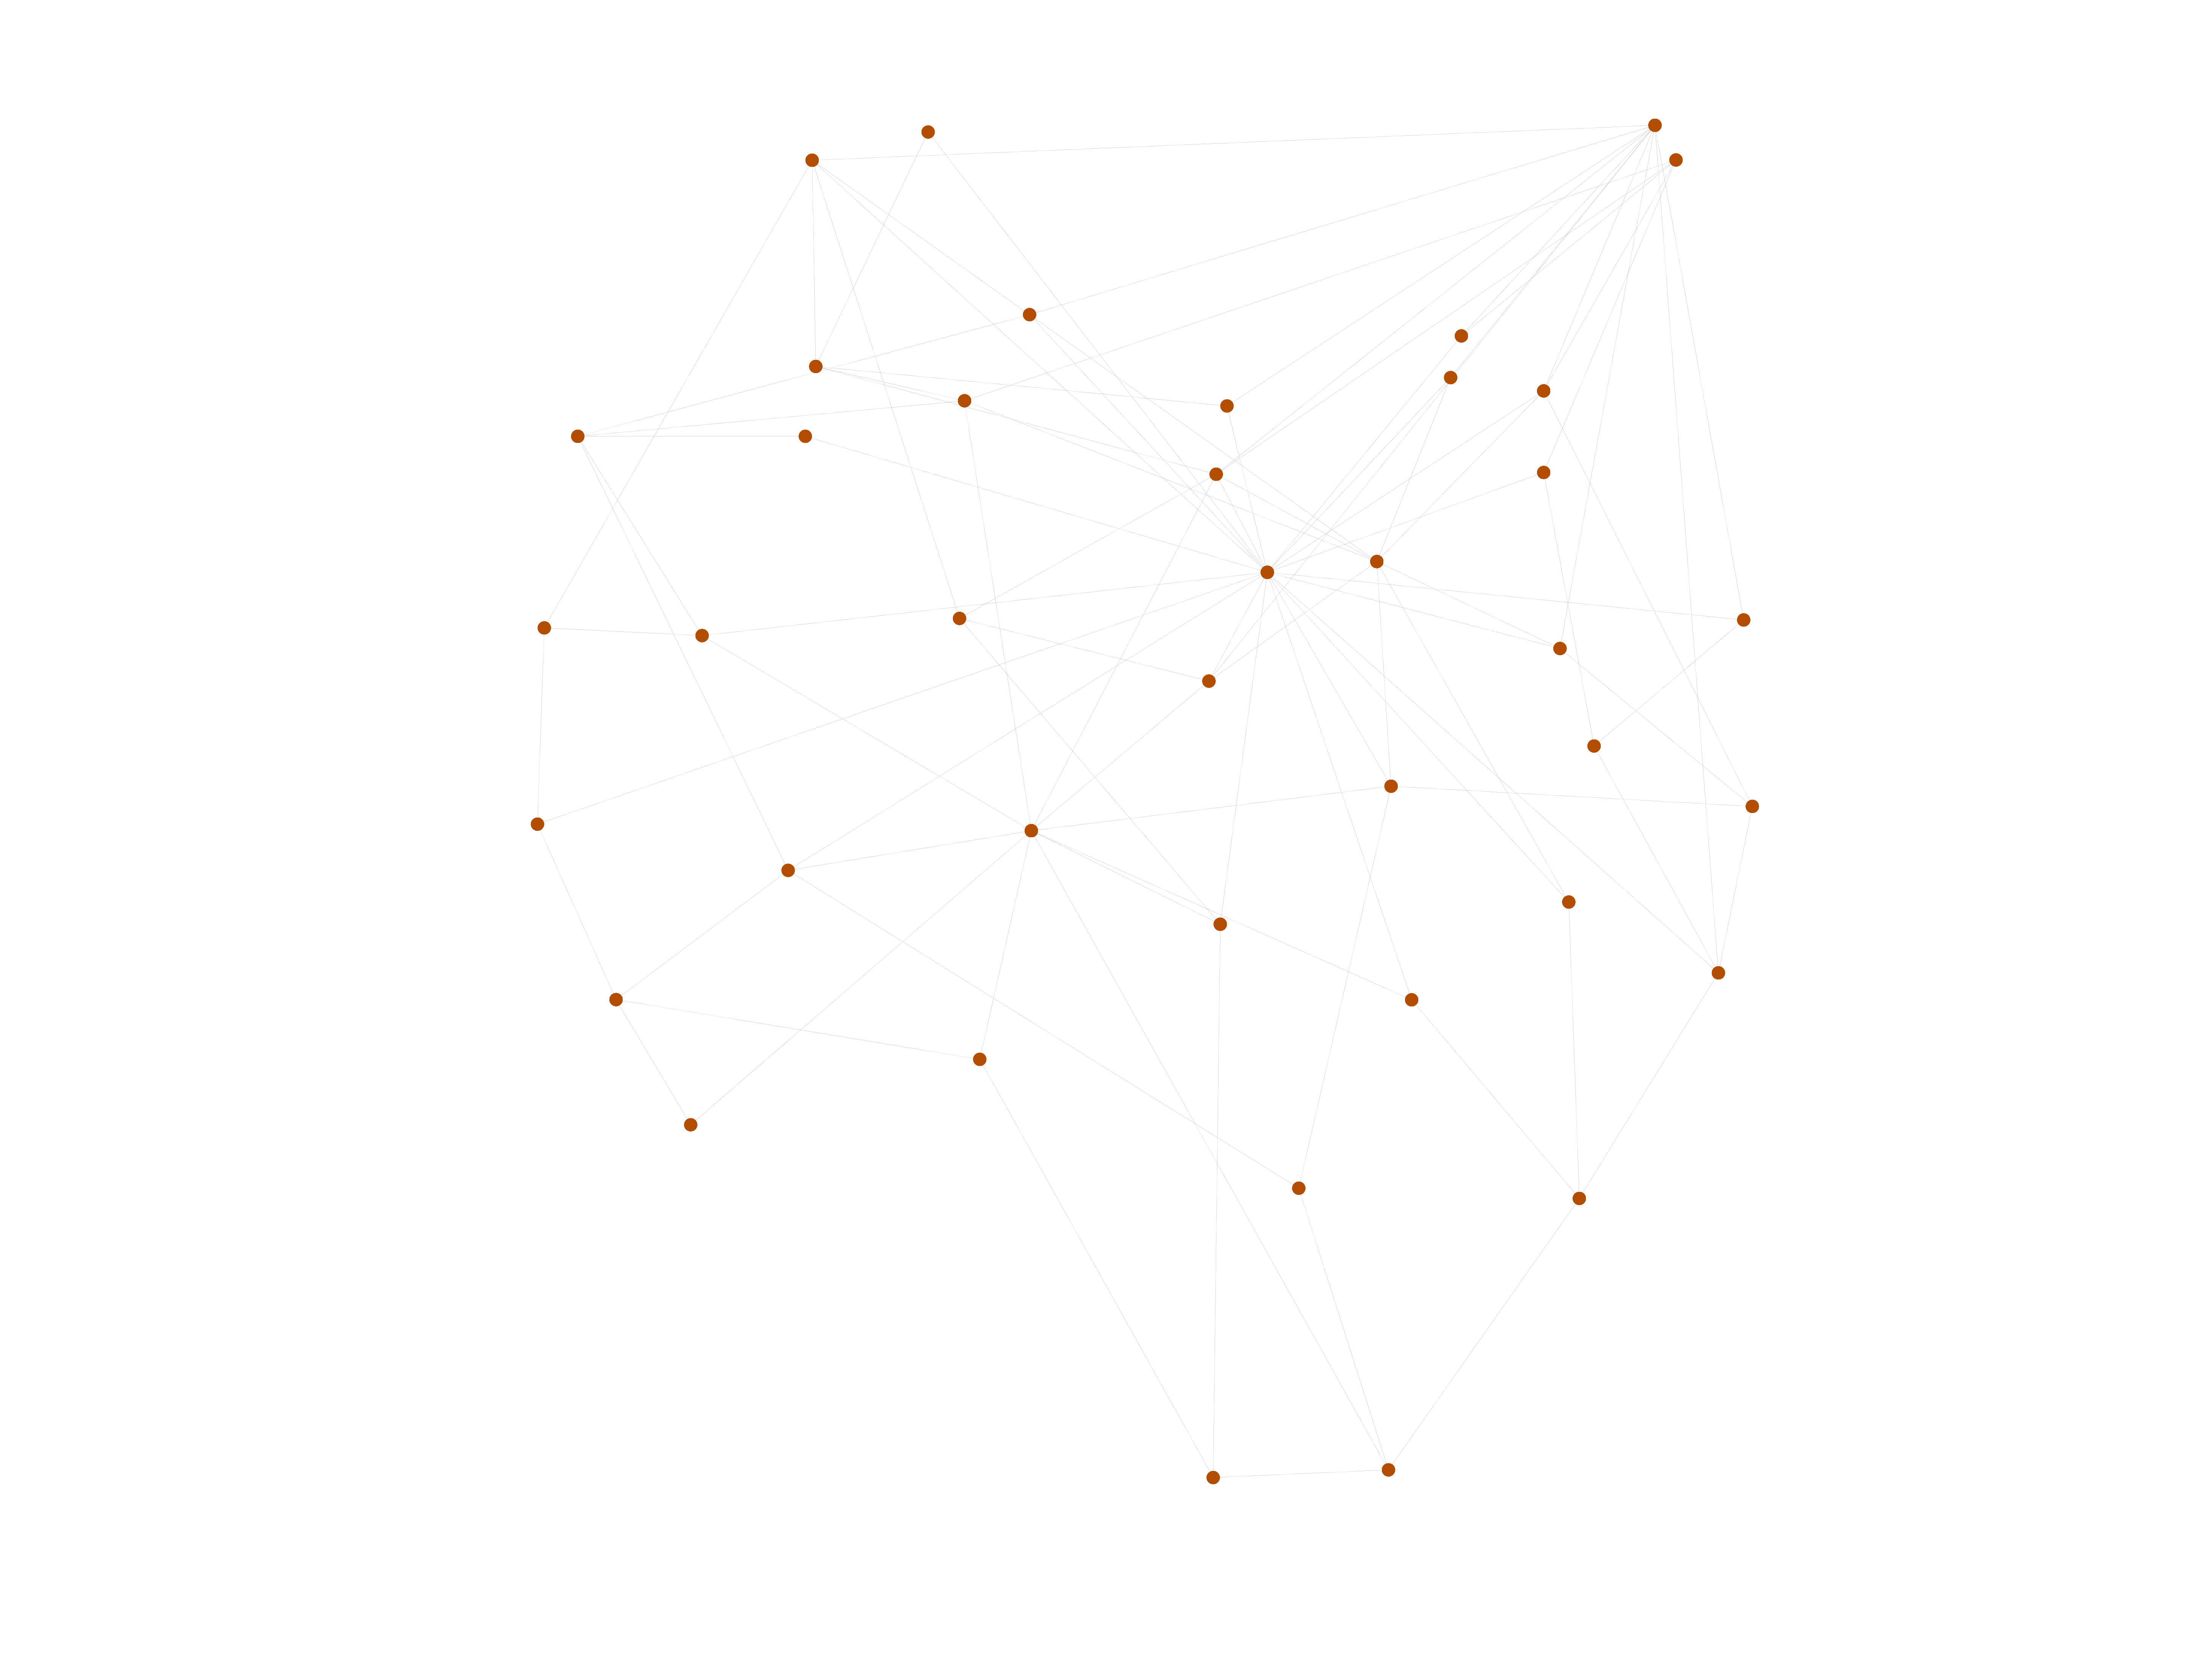
This bipartite network contains membership information of corporate executive officers in social organizations such as clubs and boards. Left nodes represent persons and right nodes represent social organisations. An edge between a person and a social organization shows that the person is a member.

Metadata

CodeBM
Internal namebrunson_club-membership
NameCorporate club memberships
Data sourcehttps://github.com/corybrunson/triadic
AvailabilityDataset is available for download
Consistency checkDataset passed all tests
Category
Affiliation network
Node meaningPerson, organization
Edge meaningMembership
Network formatBipartite, undirected
Edge typeUnweighted, no multiple edges

Statistics

Size n =40
Left size n1 =25
Right size n2 =15
Volume m =95
Wedge count s =534
Claw count z =1,935
Cross count x =6,874
Square count q =212
4-Tour count T4 =4,186
Maximum degree dmax =21
Maximum left degree d1max =7
Maximum right degree d2max =21
Average degree d =4.750 00
Average left degree d1 =3.800 00
Average right degree d2 =6.333 33
Fill p =0.253 333
Size of LCC N =40
Diameter δ =5
50-Percentile effective diameter δ0.5 =2.066 34
90-Percentile effective diameter δ0.9 =3.373 17
Median distance δM =3
Mean distance δm =2.546 67
Gini coefficient G =0.300 632
Balanced inequality ratio P =0.384 211
Left balanced inequality ratio P1 =0.421 053
Right balanced inequality ratio P2 =0.347 368
Relative edge distribution entropy Her =0.954 522
Power law exponent γ =2.375 30
Tail power law exponent γt =2.871 00
Tail power law exponent with p γ3 =2.871 00
p-value p =0.238 000
Left tail power law exponent with p γ3,1 =8.031 00
Left p-value p1 =0.927 000
Right tail power law exponent with p γ3,2 =2.401 00
Right p-value p2 =0.558 000
Degree assortativity ρ =−0.113 162
Degree assortativity p-value pρ =0.274 887
Spectral norm α =6.465 51
Algebraic connectivity a =0.867 610
Spectral separation 1[A] / λ2[A]| =1.806 22
Controllability C =10
Relative controllability Cr =0.250 000

Plots

Fruchterman–Reingold graph drawing

Degree distribution

Cumulative degree distribution

Lorenz curve

Spectral distribution of the adjacency matrix

Spectral distribution of the normalized adjacency matrix

Spectral distribution of the Laplacian

Spectral graph drawing based on the adjacency matrix

Spectral graph drawing based on the Laplacian

Spectral graph drawing based on the normalized adjacency matrix

Degree assortativity

Zipf plot

Hop distribution

Double Laplacian graph drawing

Delaunay graph drawing

Matrix decompositions plots

Downloads

References

[1] Jérôme Kunegis. KONECT – The Koblenz Network Collection. In Proc. Int. Conf. on World Wide Web Companion, pages 1343–1350, 2013. [ http ]
[2] Katherine Faust. Centrality in affiliation networks. Soc. Netw., 19(2):157–191, 1997.