Corporate leaderships

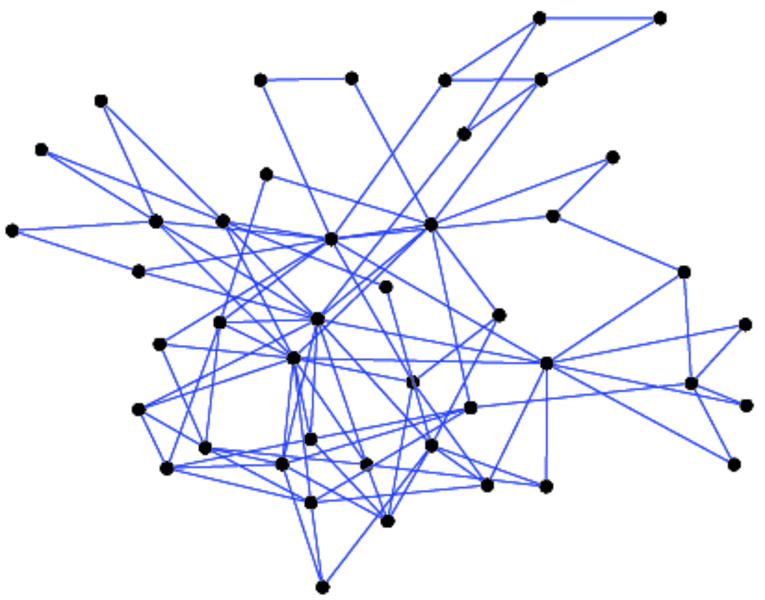
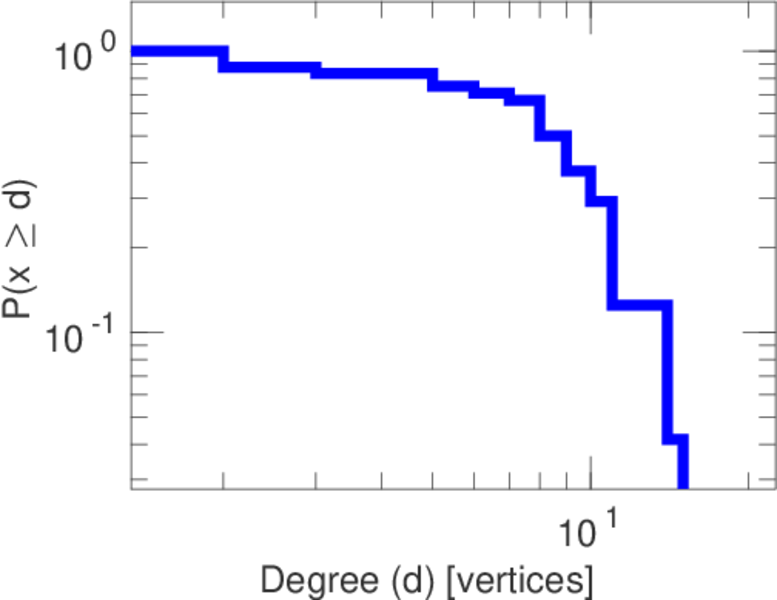
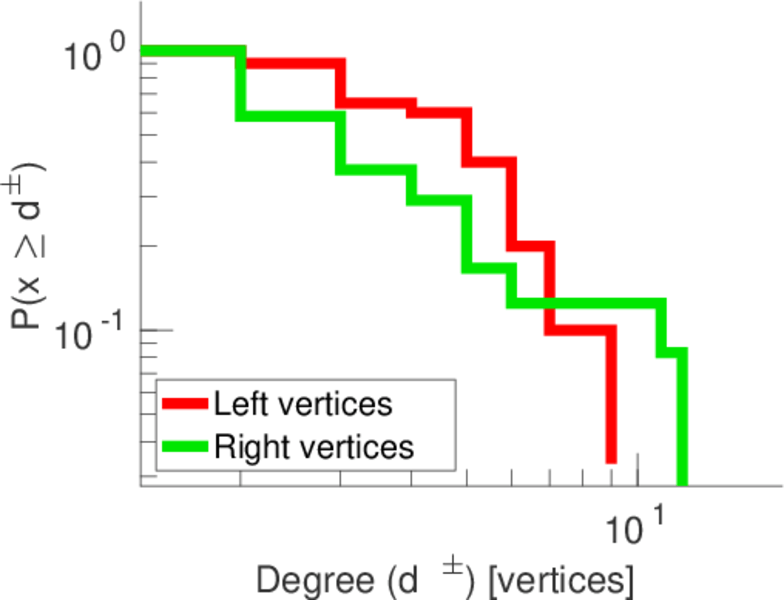
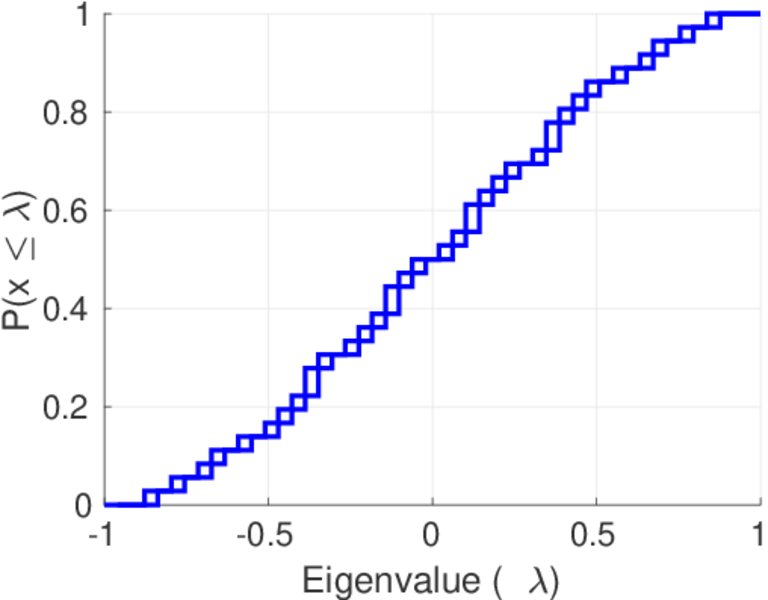
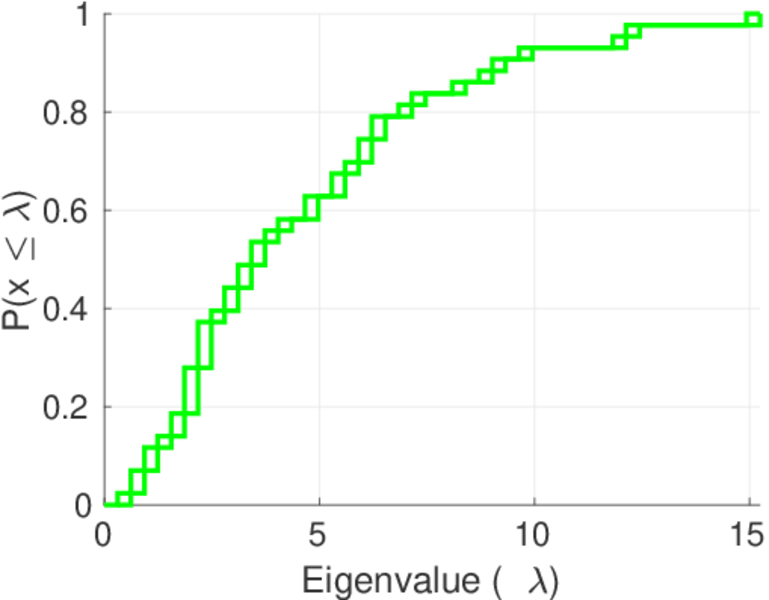
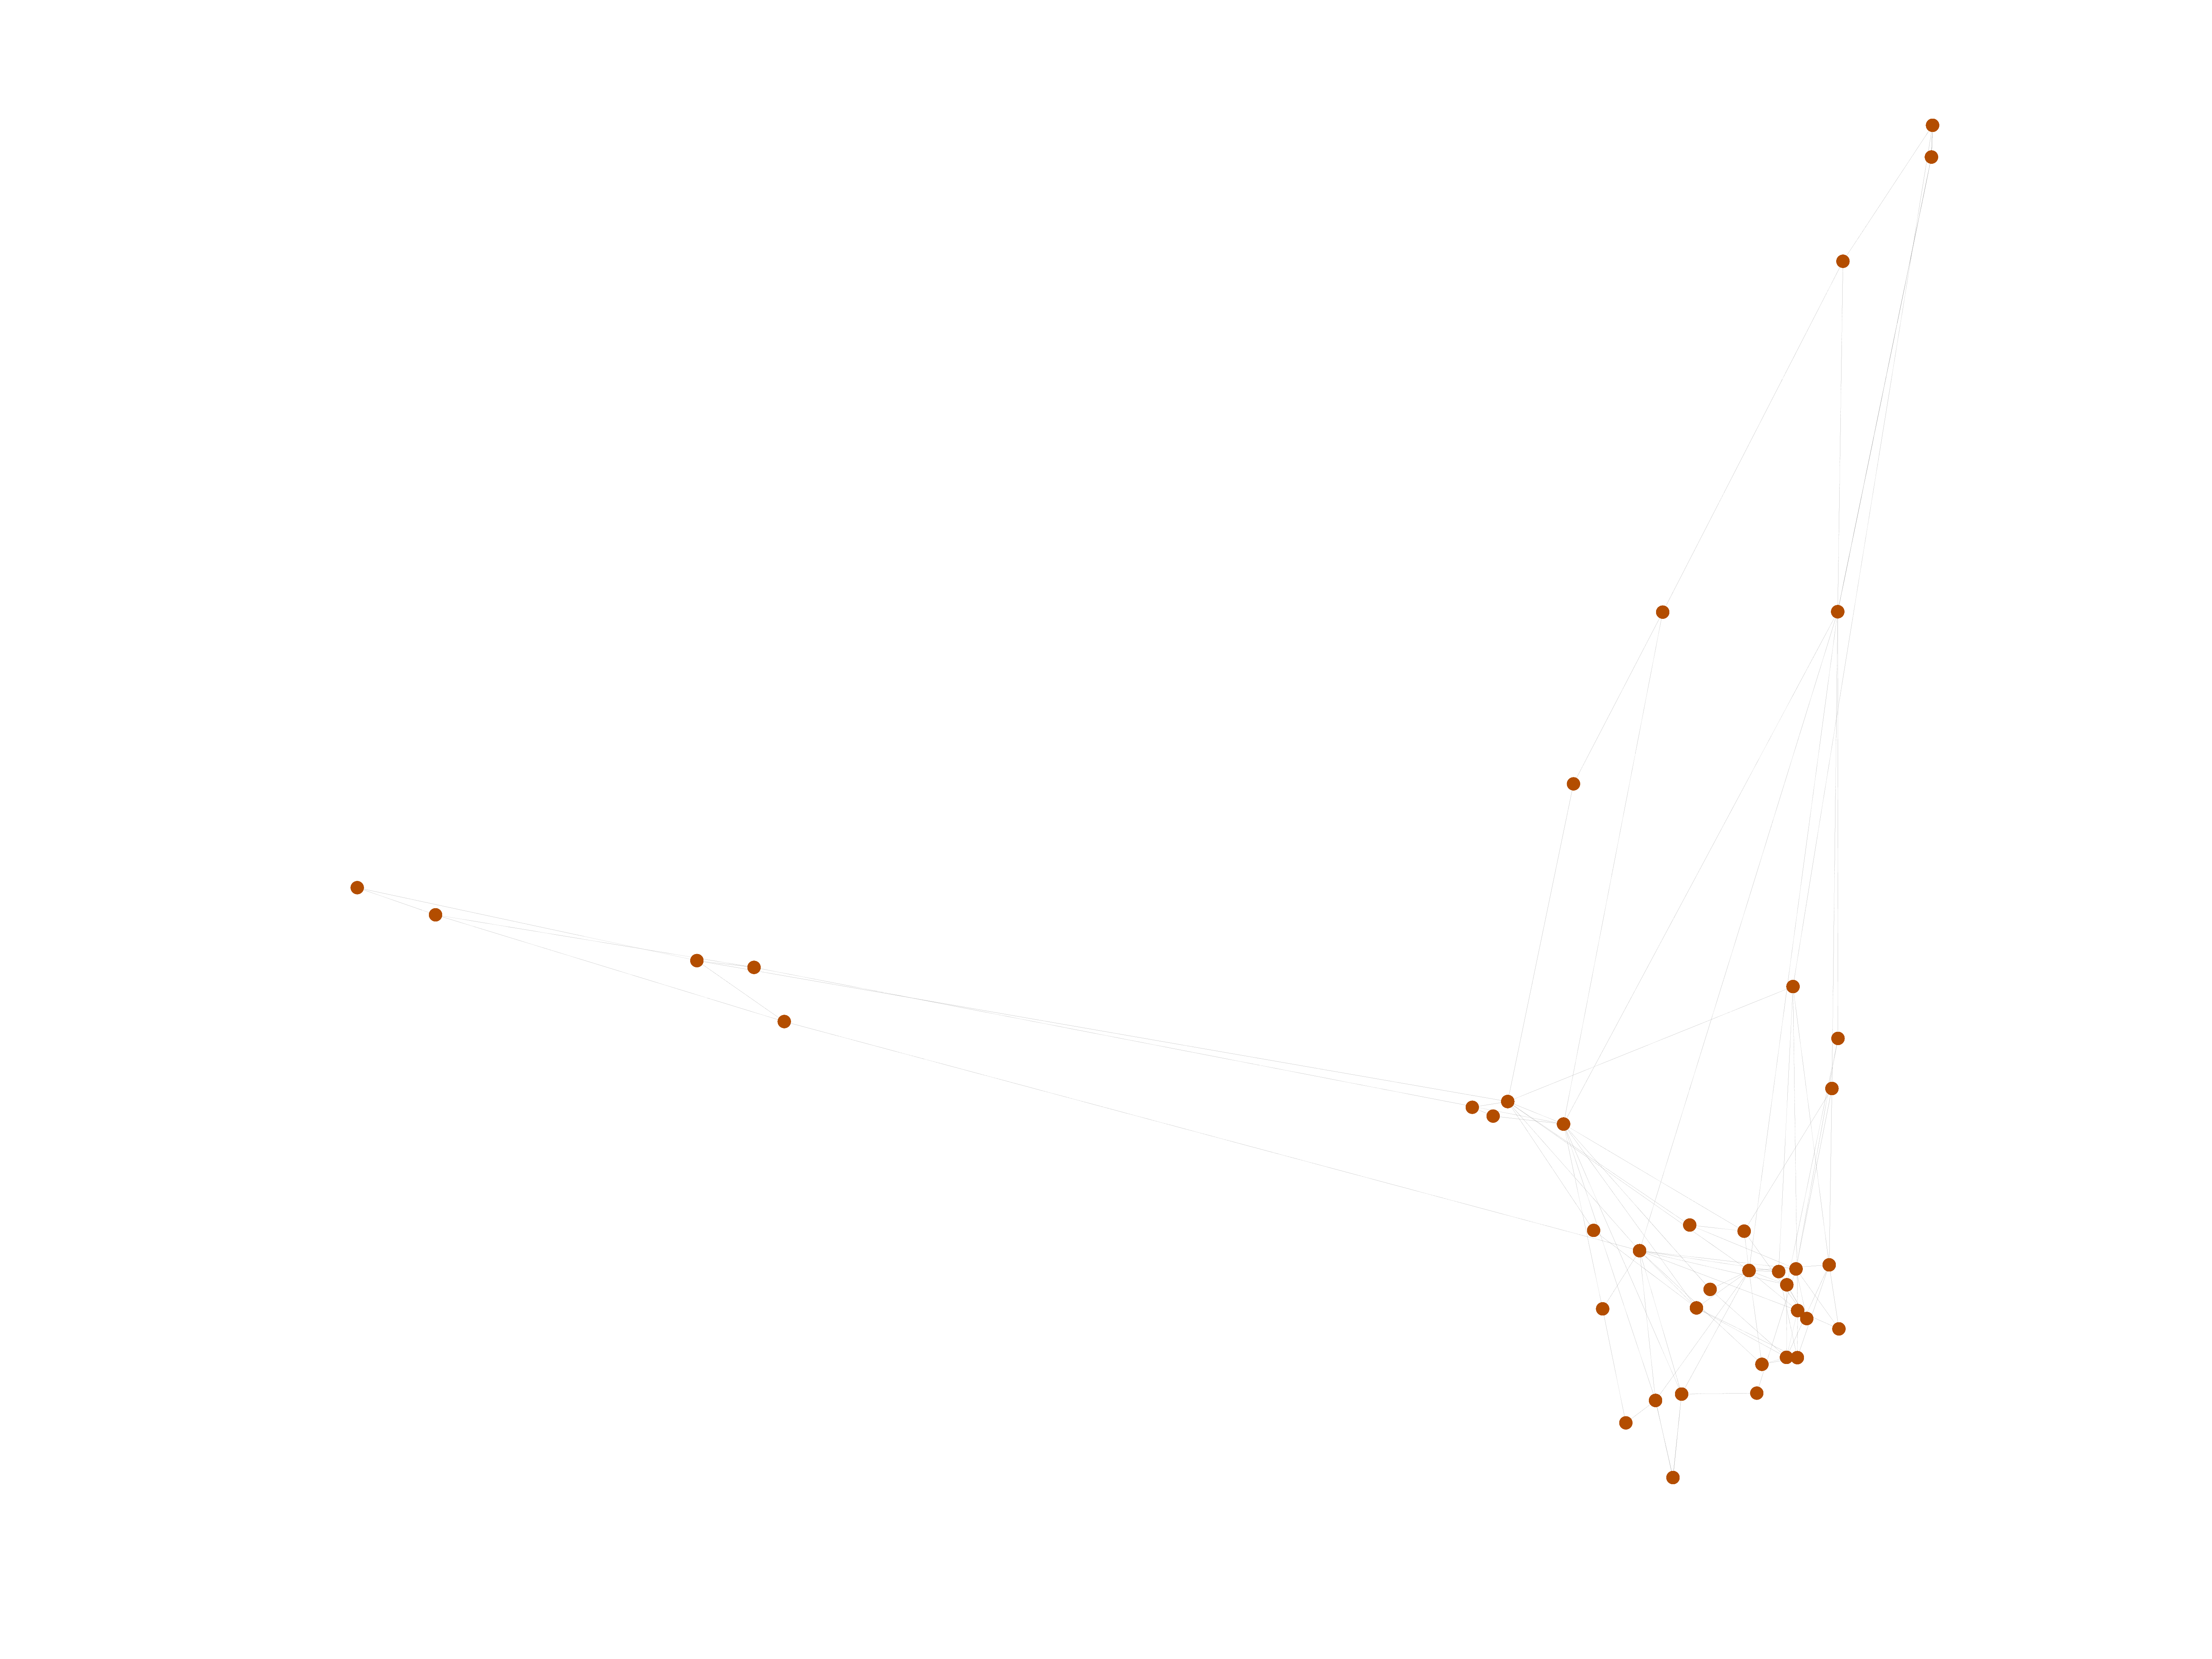
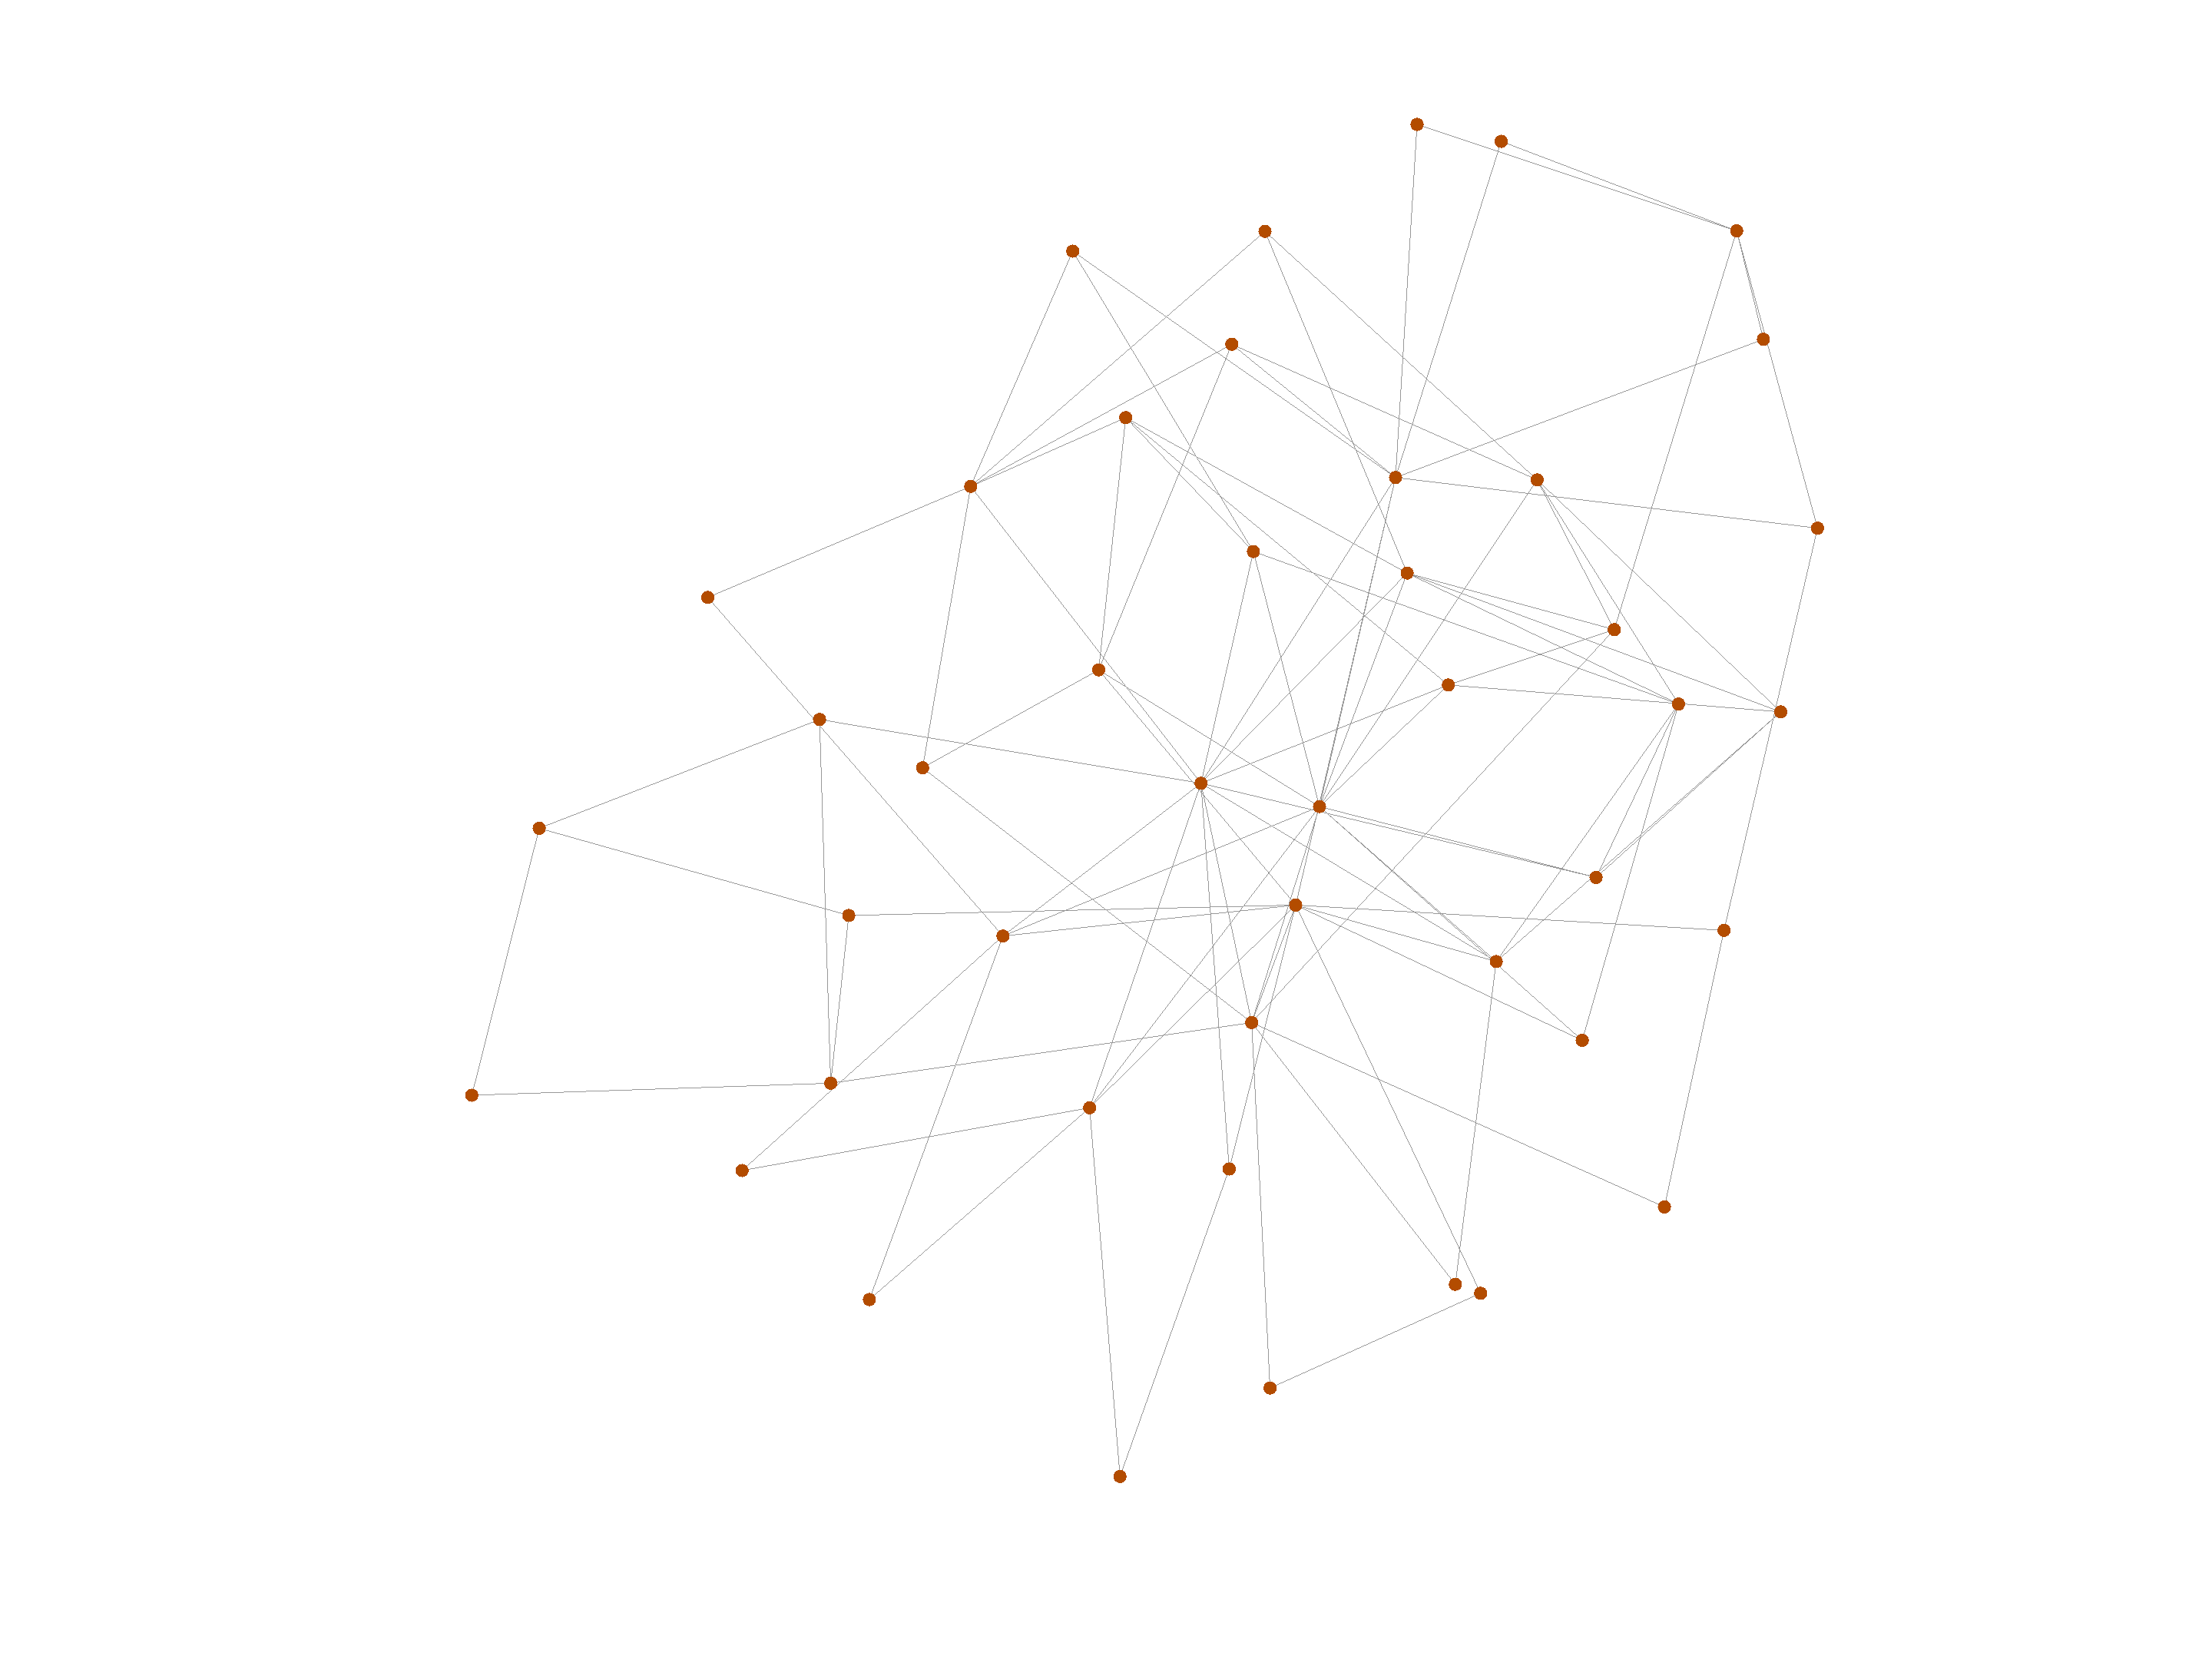
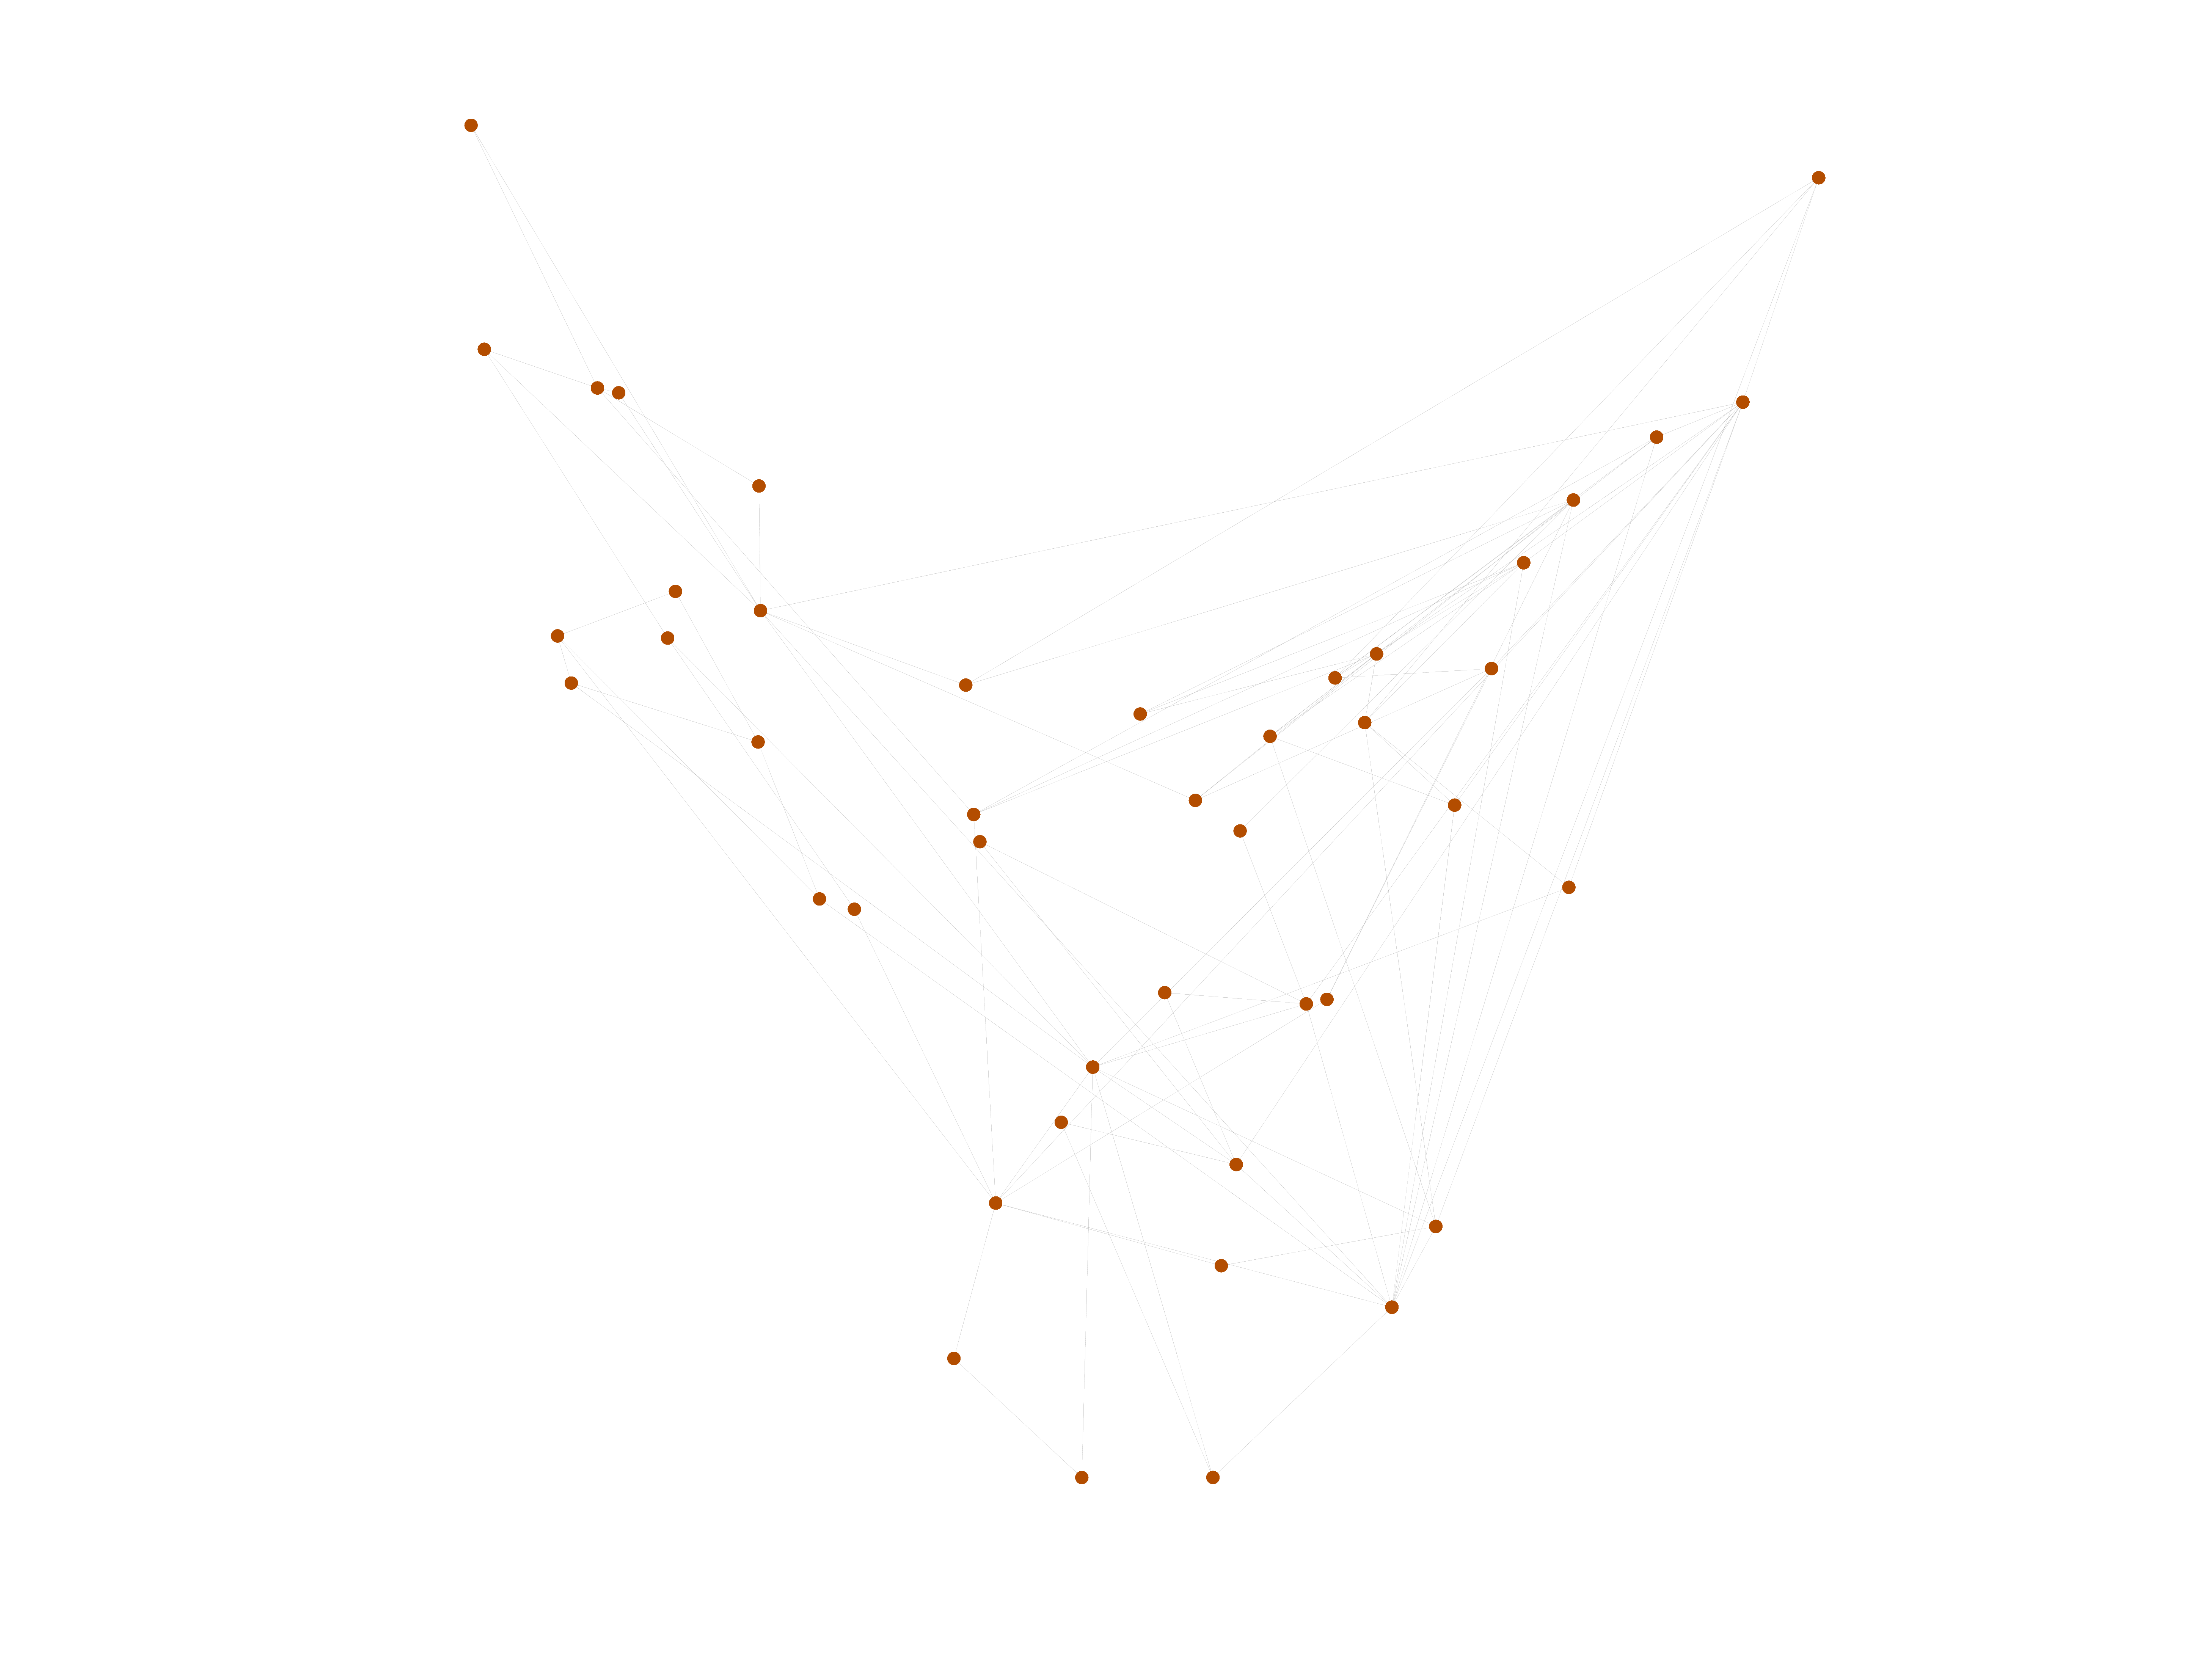
This bipartite network contains person–company leadership information between companies and 20 corporate directors. The data was collected in 1962. Left nodes represent persons and right nodes represent companies. An edge between a person and a company shows that the person had a leadership position in that company.

Metadata

CodeBC
Internal namebrunson_corporate-leadership
NameCorporate leaderships
Data sourcehttps://github.com/corybrunson/triadic
AvailabilityDataset is available for download
Consistency checkDataset passed all tests
Category
Affiliation network
Node meaningPerson, company
Edge meaningLeadership
Network formatBipartite, undirected
Edge typeUnweighted, no multiple edges

Statistics

Size n =44
Left size n1 =20
Right size n2 =24
Volume m =99
Wedge count s =453
Claw count z =1,035
Cross count x =1,755
Square count q =195
4-Tour count T4 =3,782
Maximum degree dmax =12
Maximum left degree d1max =9
Maximum right degree d2max =12
Average degree d =4.500 00
Average left degree d1 =4.950 00
Average right degree d2 =4.125 00
Fill p =0.206 250
Size of LCC N =44
Diameter δ =6
50-Percentile effective diameter δ0.5 =2.404 88
90-Percentile effective diameter δ0.9 =3.812 70
Median distance δM =3
Mean distance δm =2.866 76
Gini coefficient G =0.250 000
Balanced inequality ratio P =0.414 141
Left balanced inequality ratio P1 =0.383 838
Right balanced inequality ratio P2 =0.353 535
Relative edge distribution entropy Her =0.958 209
Power law exponent γ =2.525 49
Tail power law exponent γt =3.691 00
Tail power law exponent with p γ3 =3.691 00
p-value p =0.557 000
Left tail power law exponent with p γ3,1 =5.691 00
Left p-value p1 =0.297 000
Right tail power law exponent with p γ3,2 =2.331 00
Right p-value p2 =0.717 000
Degree assortativity ρ =−0.086 044 3
Degree assortativity p-value pρ =0.397 090
Spectral norm α =6.182 50
Algebraic connectivity a =0.485 210
Spectral separation 1[A] / λ2[A]| =1.755 08
Controllability C =4
Relative controllability Cr =0.090 909 1

Plots

Fruchterman–Reingold graph drawing

Degree distribution

Cumulative degree distribution

Lorenz curve

Spectral distribution of the adjacency matrix

Spectral distribution of the normalized adjacency matrix

Spectral distribution of the Laplacian

Spectral graph drawing based on the adjacency matrix

Spectral graph drawing based on the Laplacian

Spectral graph drawing based on the normalized adjacency matrix

Degree assortativity

Zipf plot

Hop distribution

Double Laplacian graph drawing

Delaunay graph drawing

Matrix decompositions plots

Downloads

References

[1] Jérôme Kunegis. KONECT – The Koblenz Network Collection. In Proc. Int. Conf. on World Wide Web Companion, pages 1343–1350, 2013. [ http ]
[2] Roy Barnes and Tracy Burkett. Structural redundancy and multiplicity in corporate networks. Int. Netw. for Soc. Netw. Anal., 30(2), 2010.