American Revolution

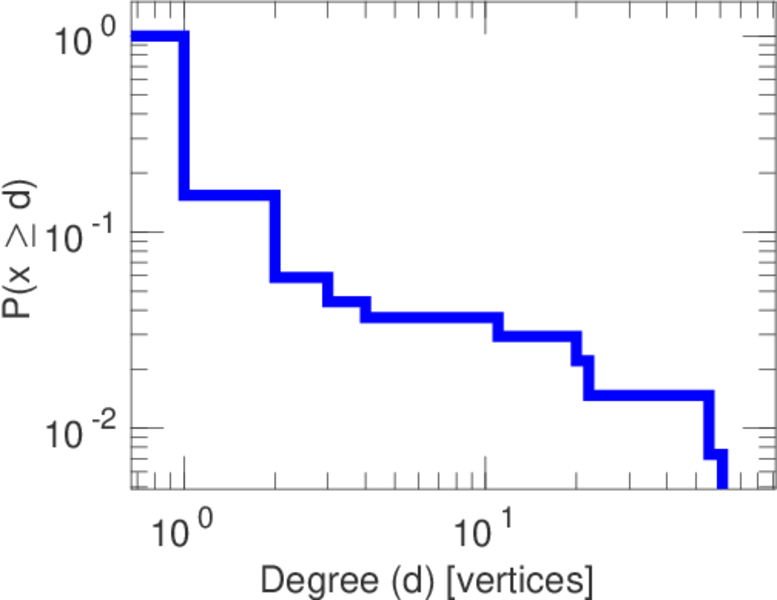
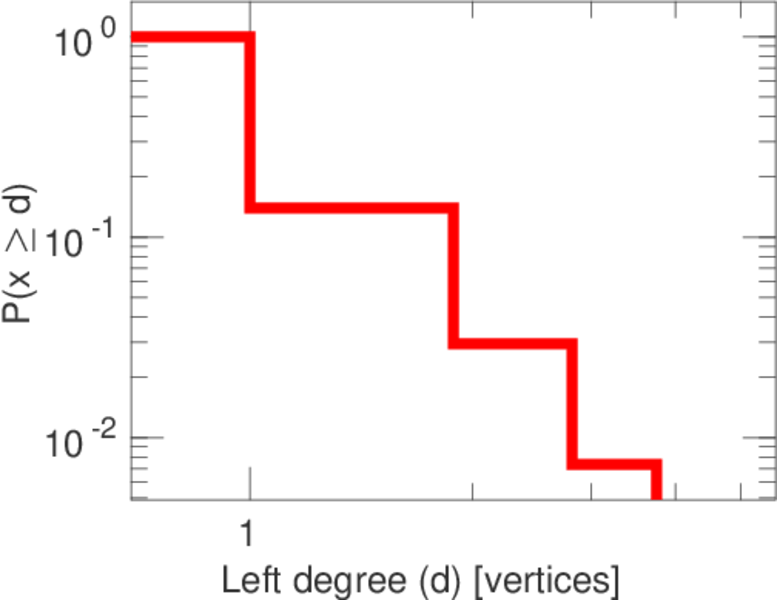
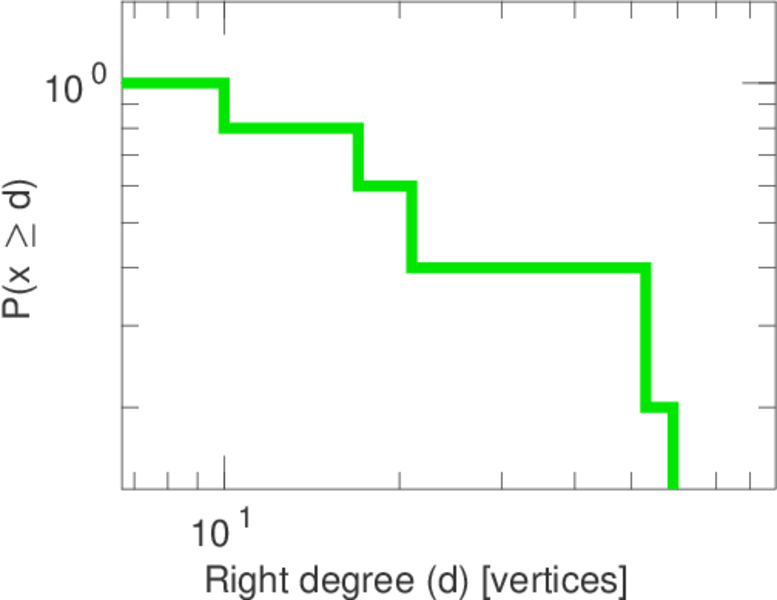
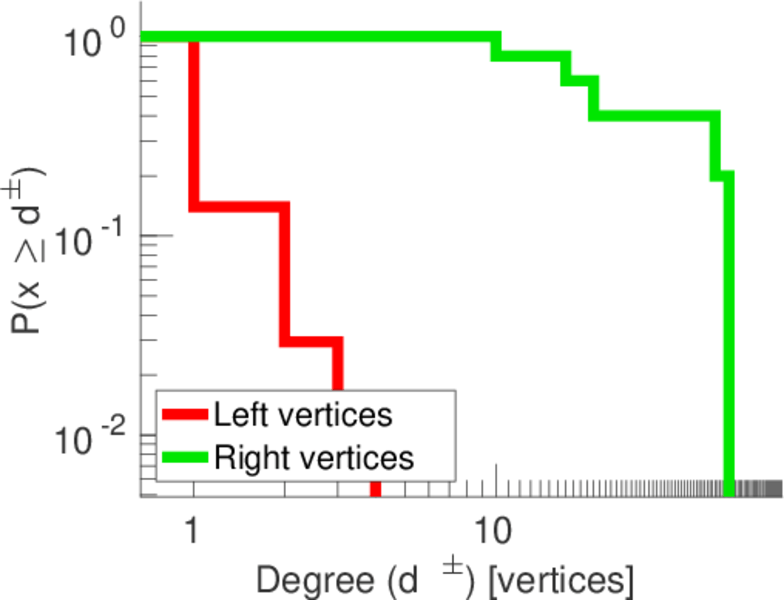
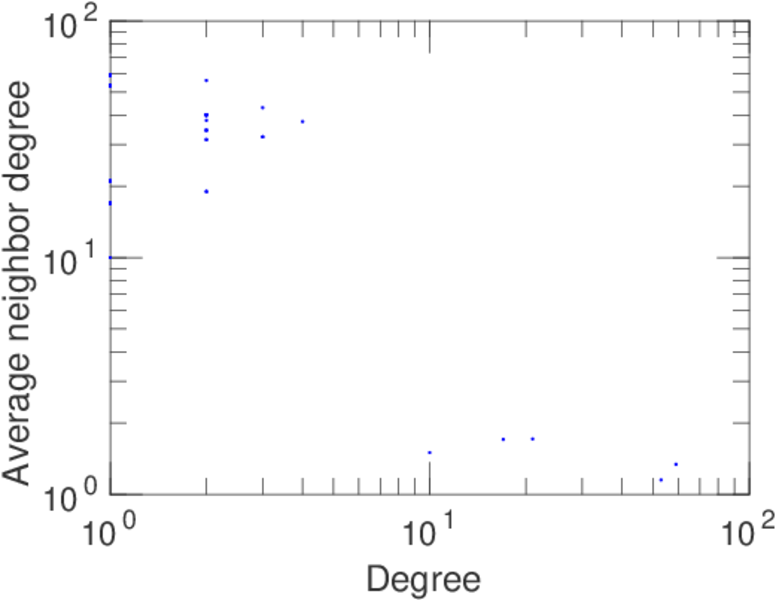
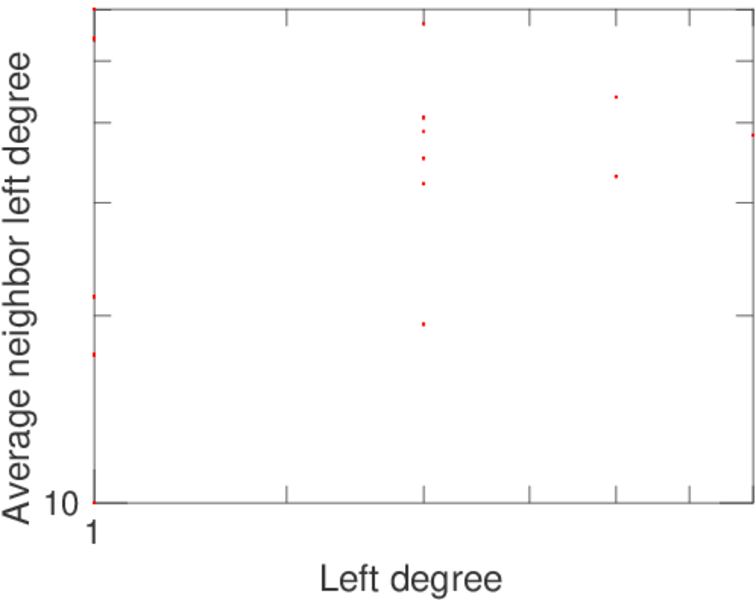
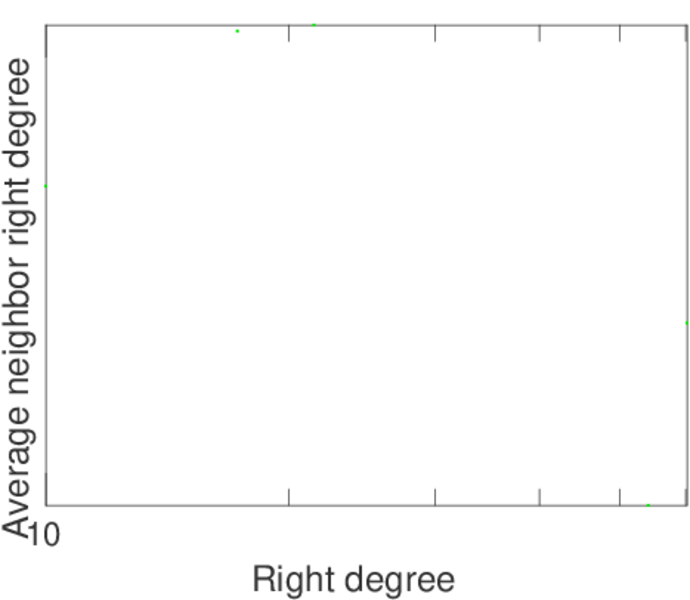
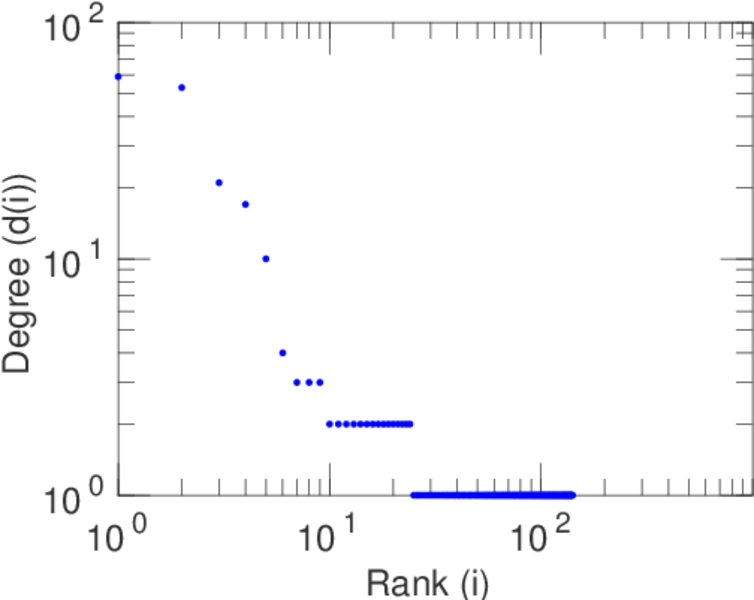
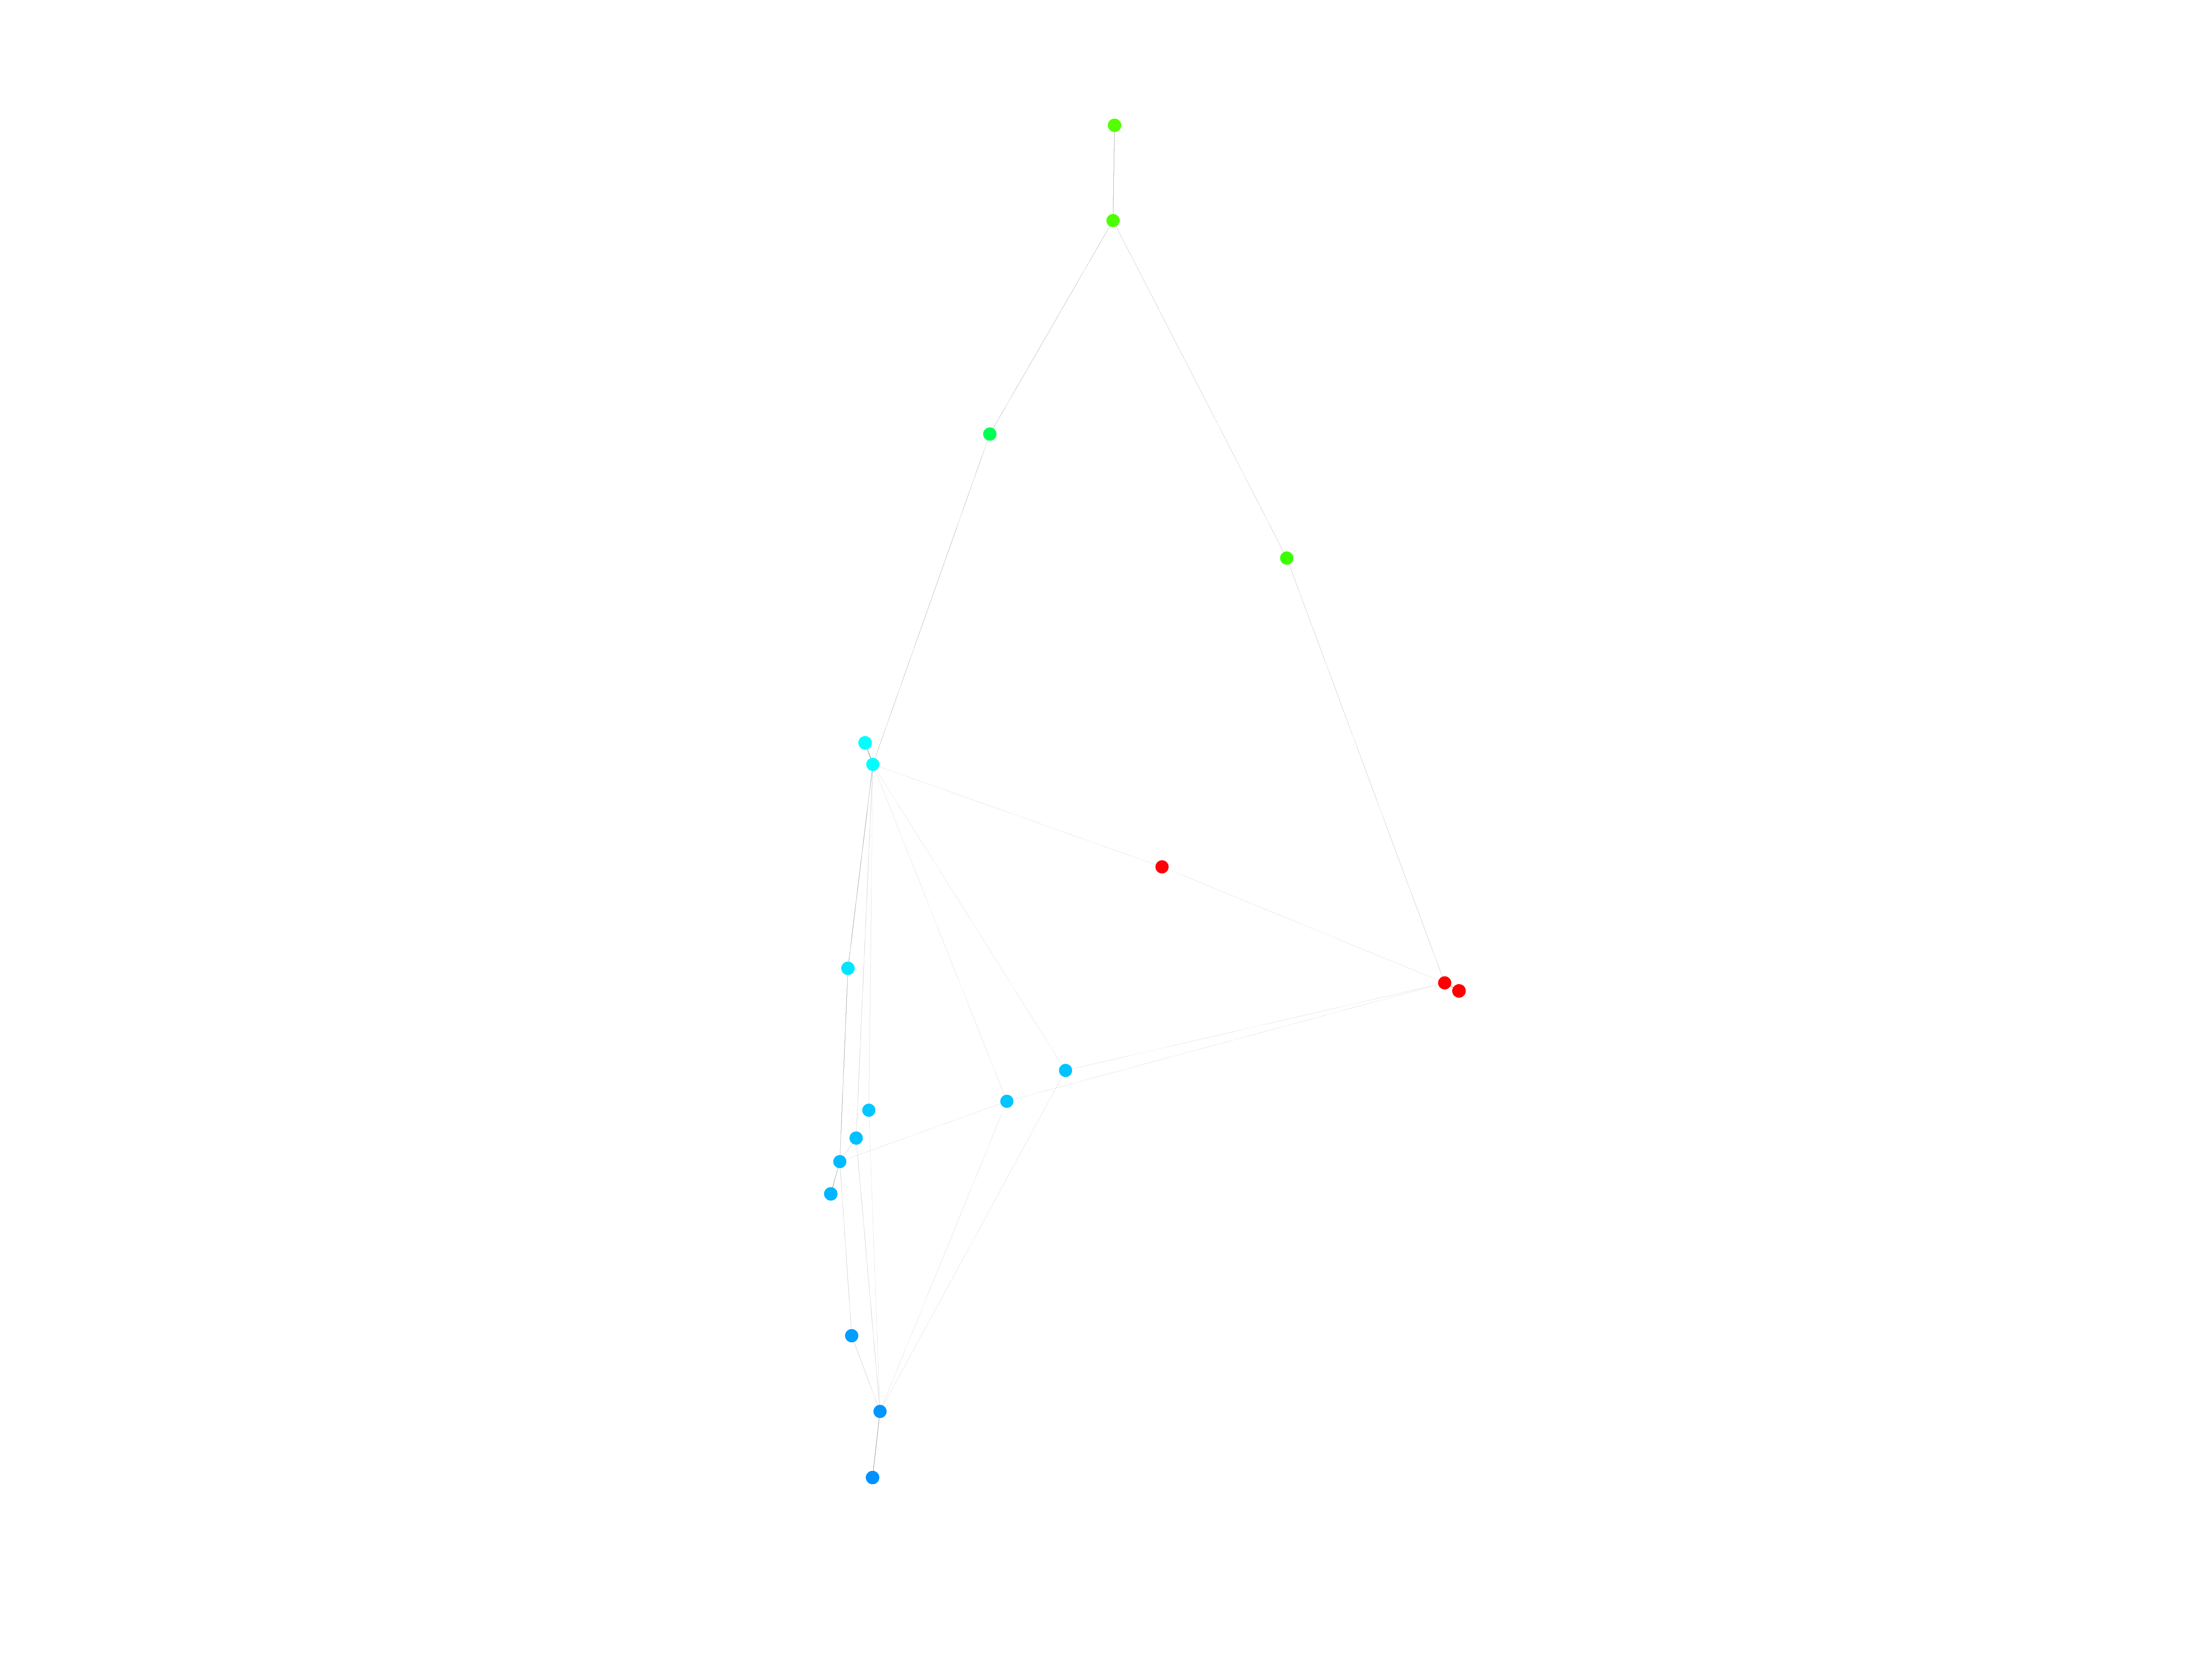
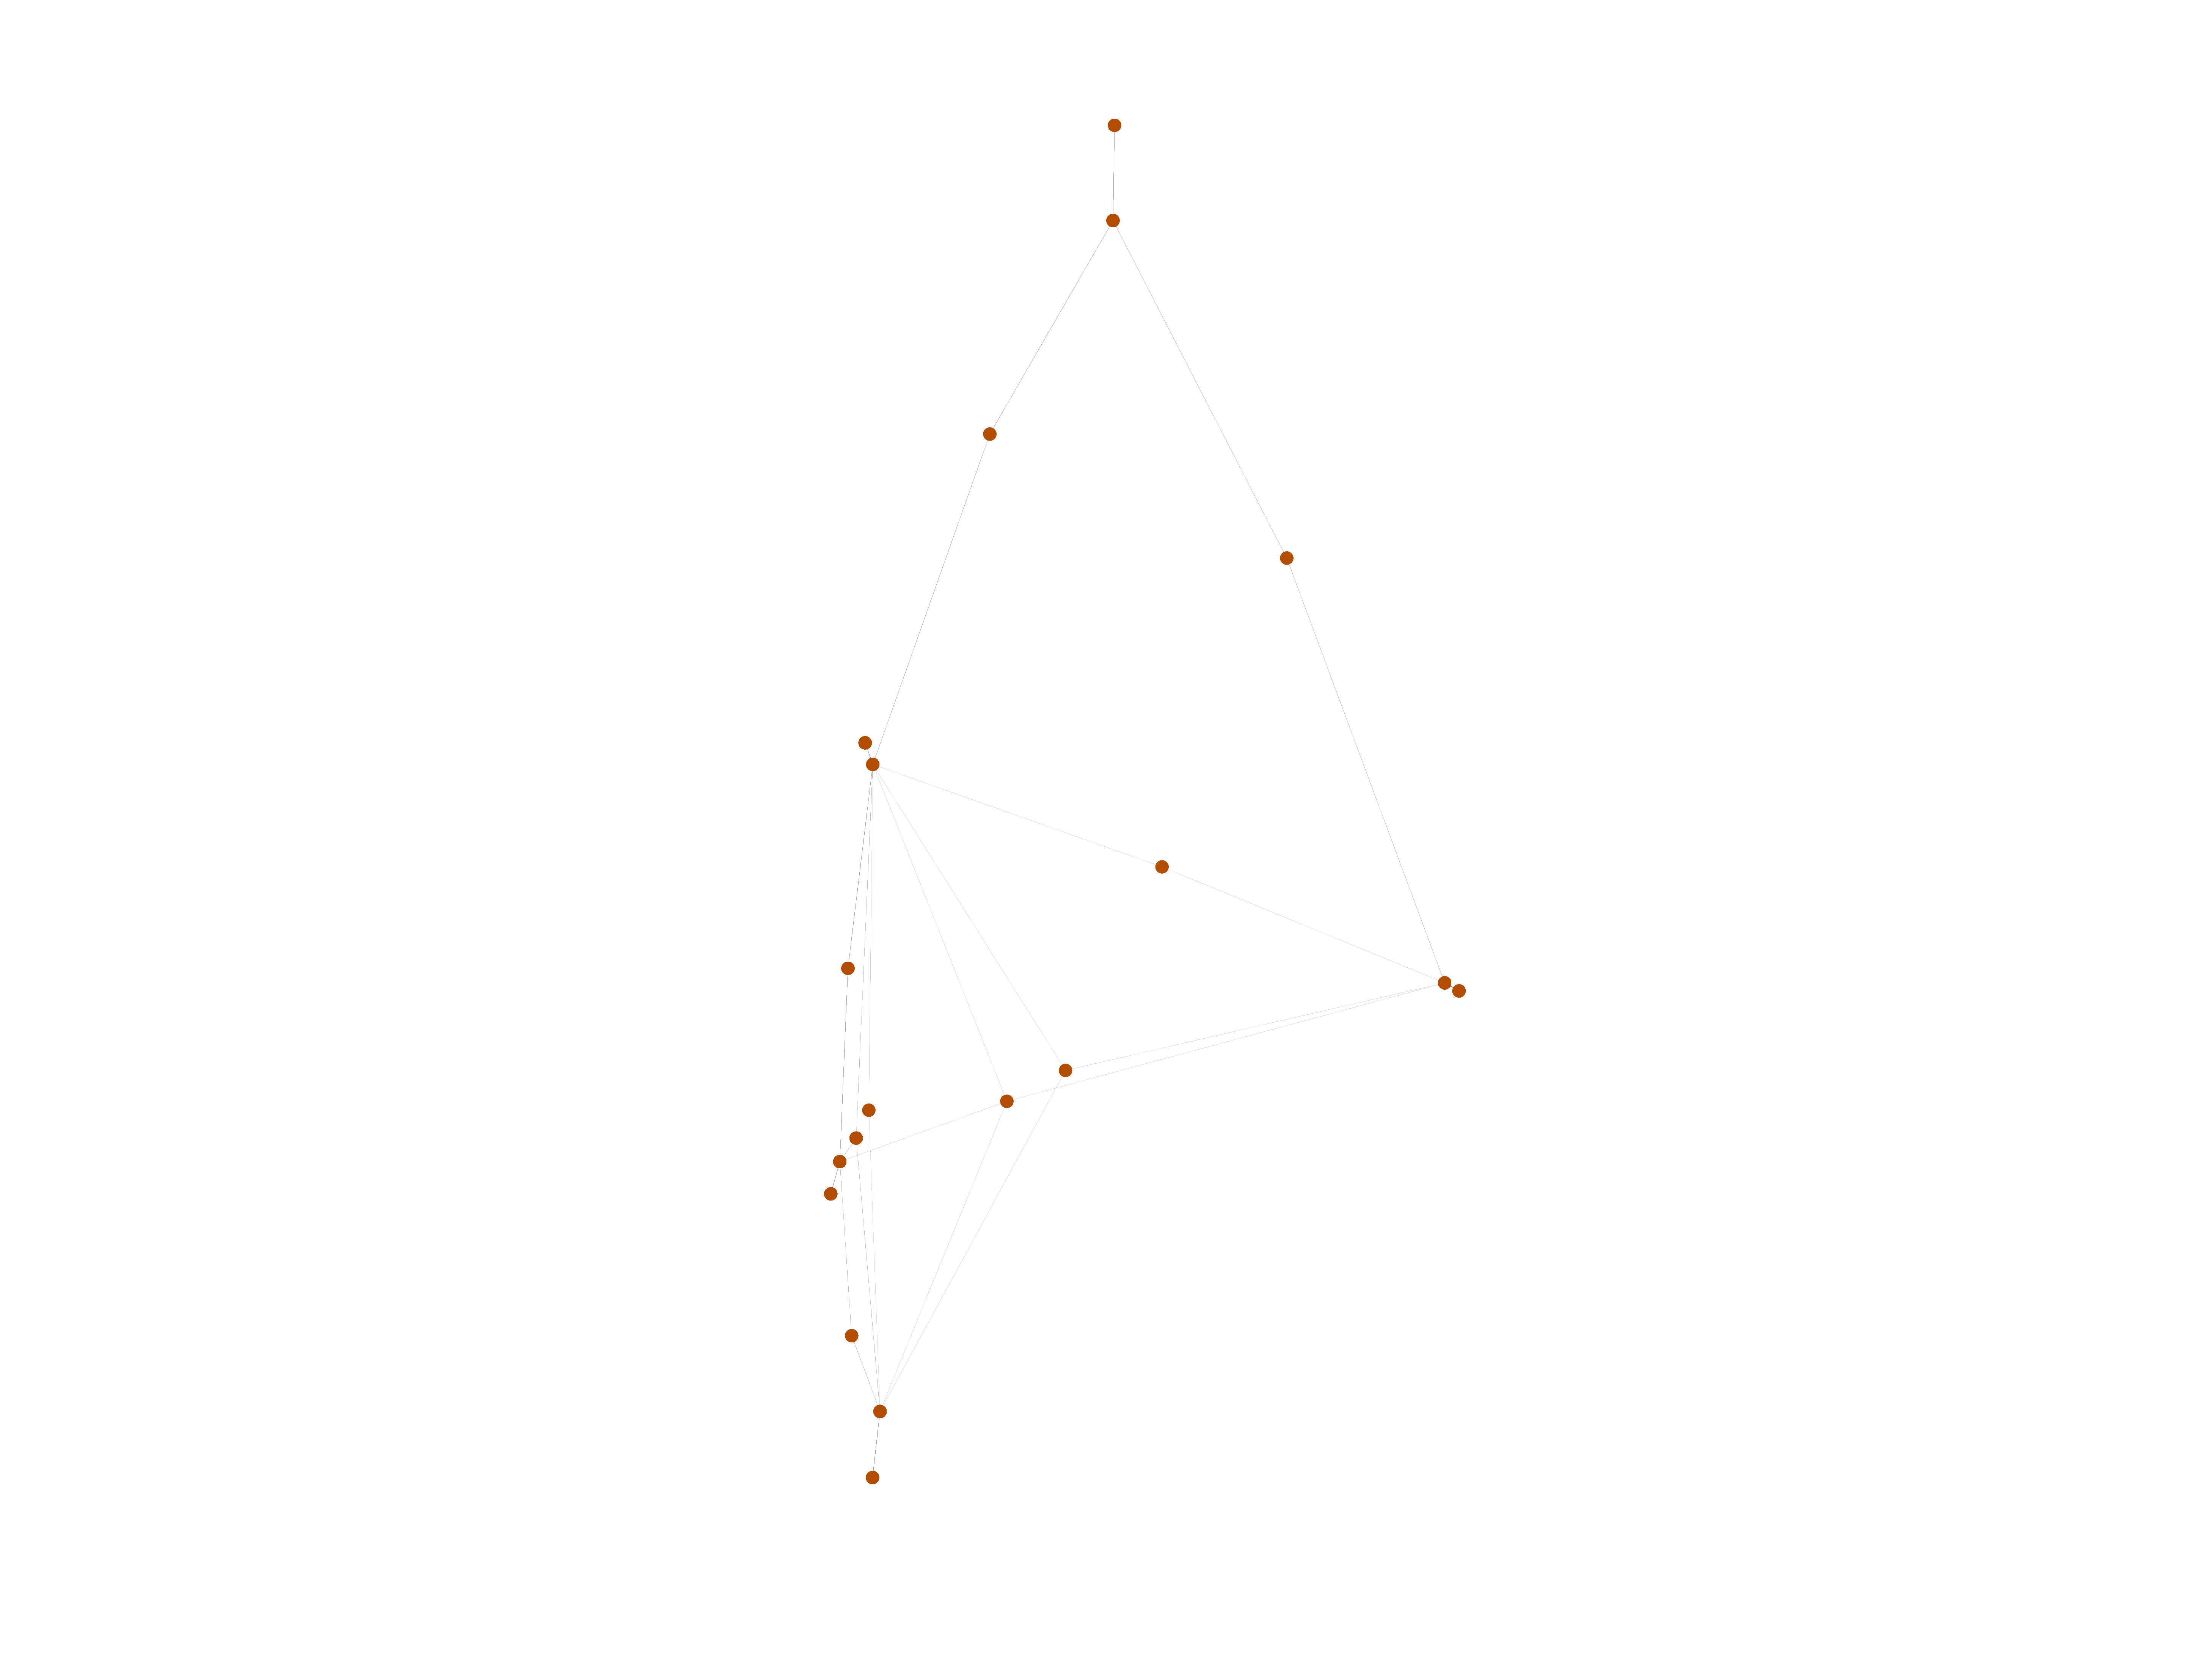
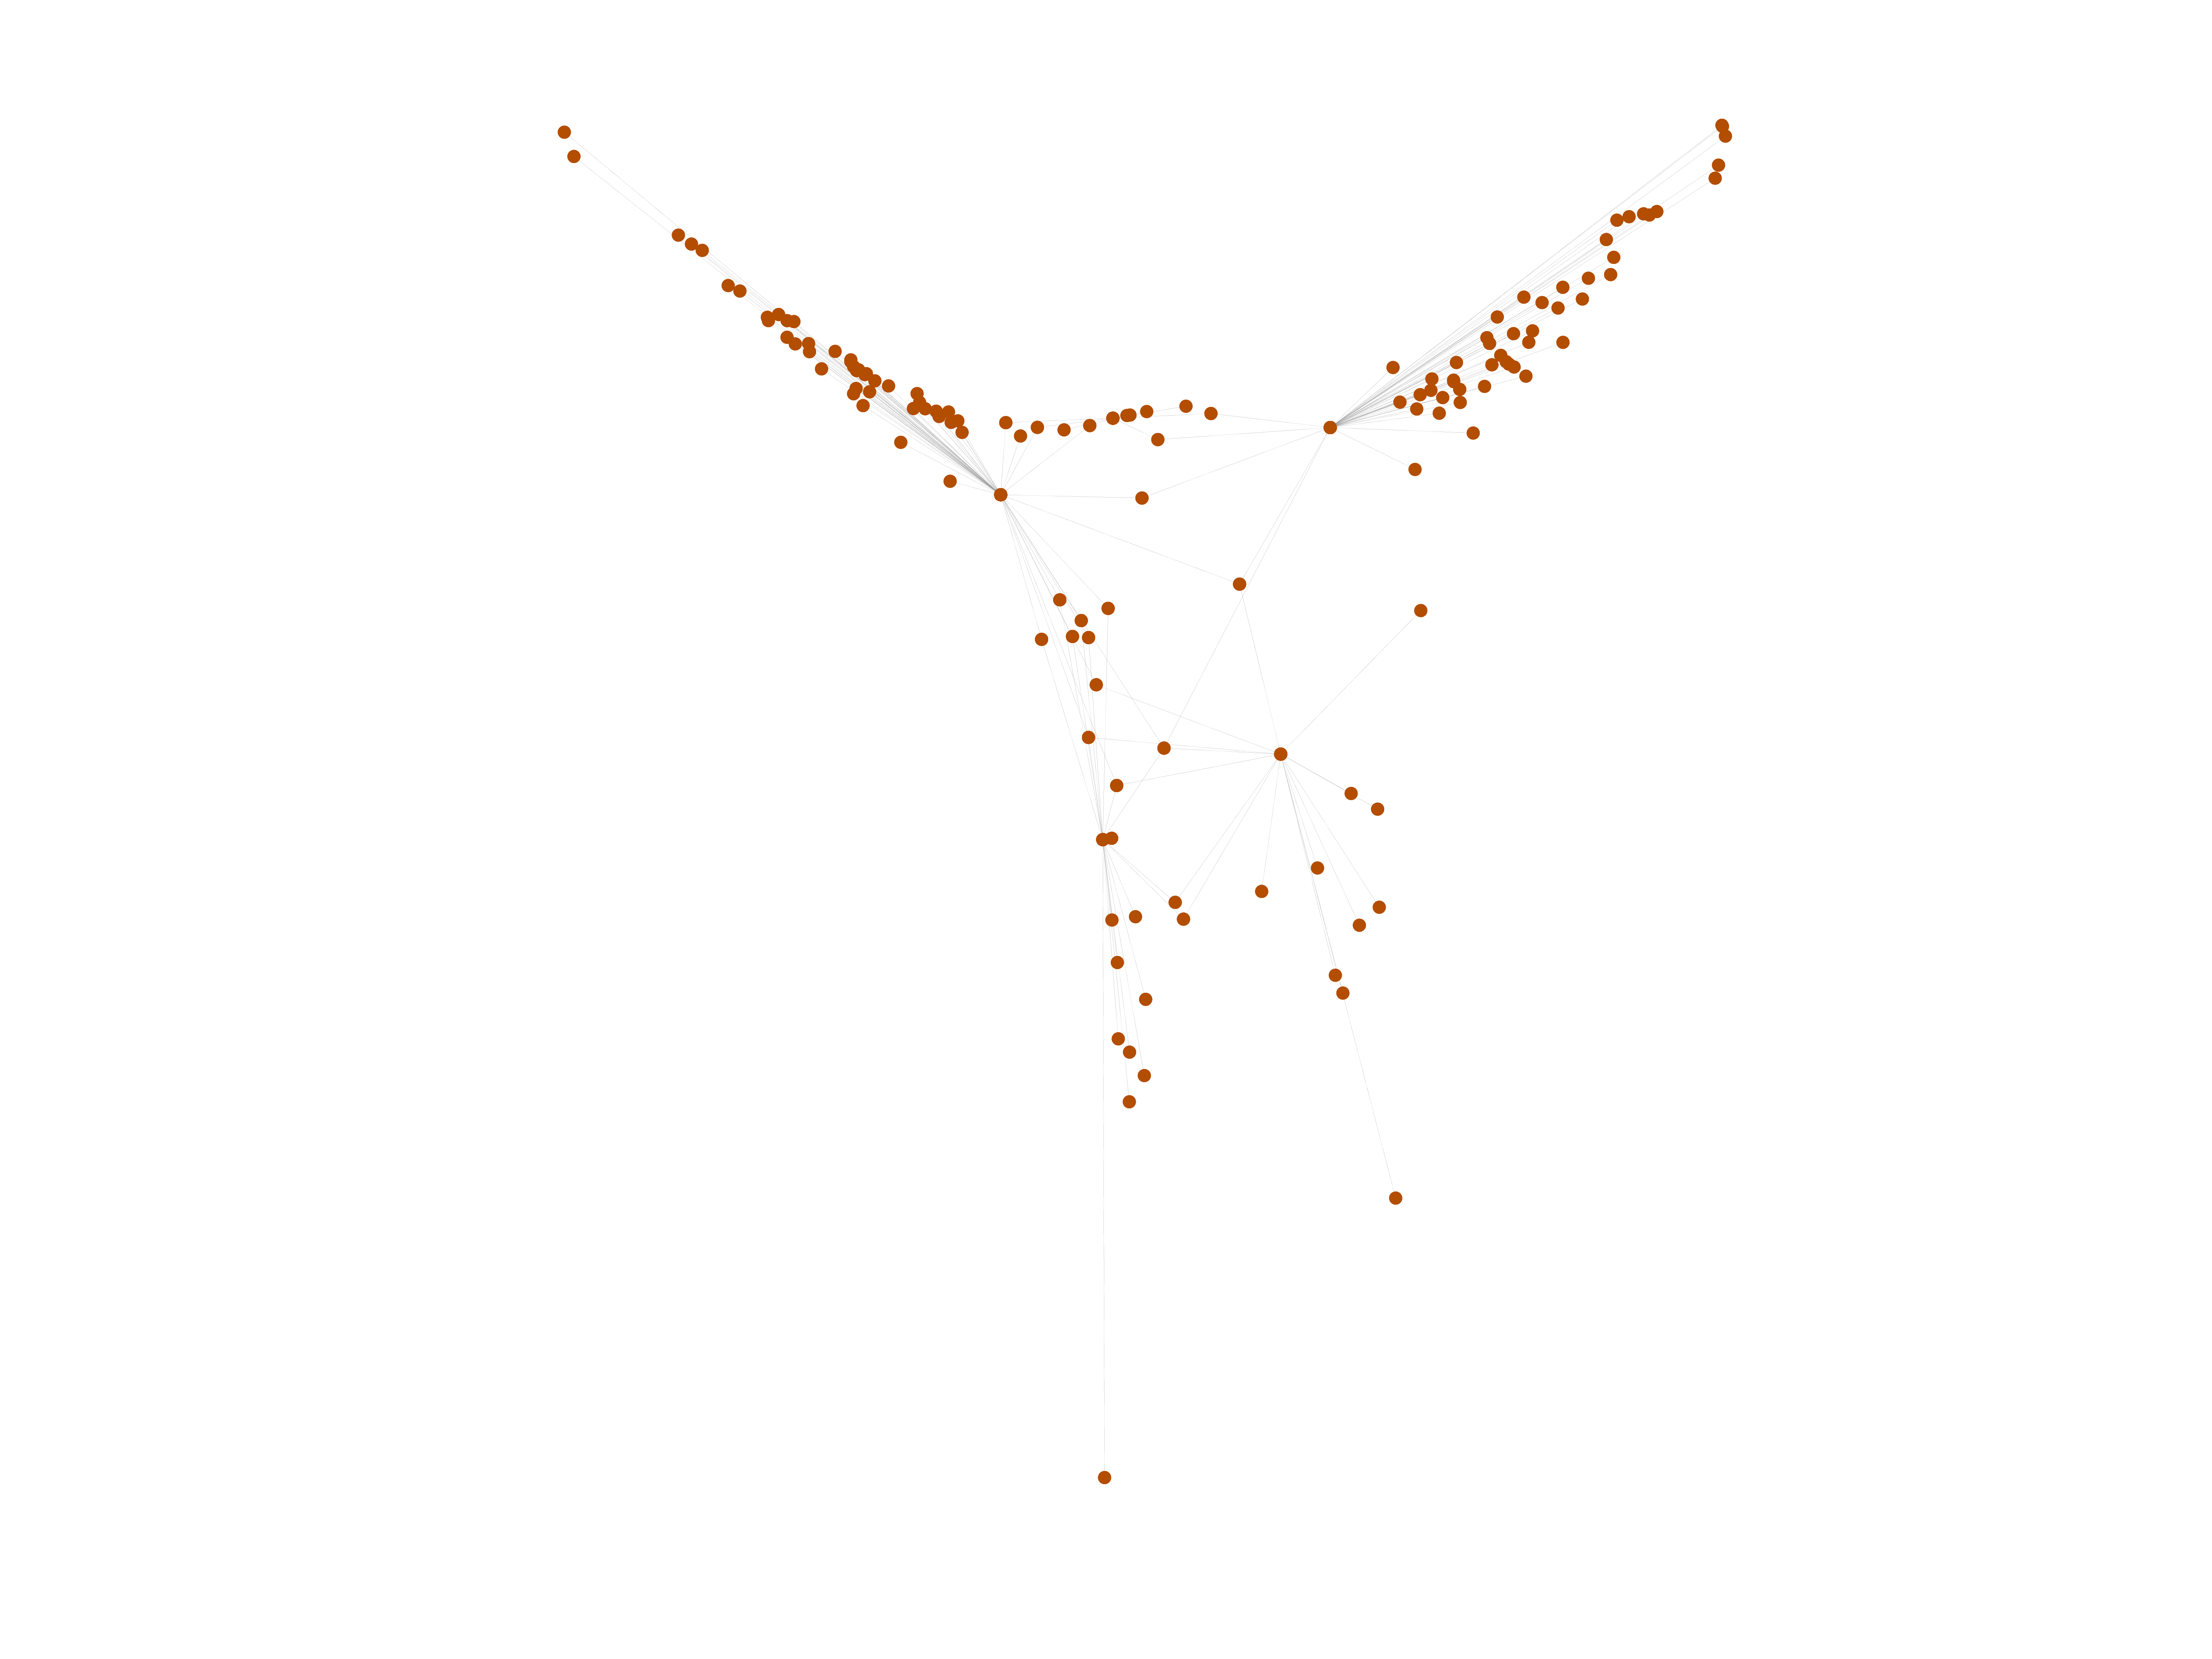
This bipartite network contains membership information of 136 people in 5 organisations dating back to the time before the American Revolution. The list includes well-known people such as the American activist Paul Revere. Left nodes represent persons and right nodes represent organisations. An edge between a person and an organization shows that the person was a member of the organisation.

Metadata

CodeAr
Internal namebrunson_revolution
NameAmerican Revolution
Data sourcehttps://github.com/corybrunson/triadic
AvailabilityDataset is available for download
Consistency checkDataset passed all tests
Category
Affiliation network
Node meaningPerson, organization
Edge meaningMembership
Network formatBipartite, undirected
Edge typeUnweighted, no multiple edges

Statistics

Size n =141
Left size n1 =136
Right size n2 =5
Volume m =160
Wedge count s =3,433
Claw count z =58,072
Cross count x =756,527
Square count q =64
4-Tour count T4 =14,872
Maximum degree dmax =59
Maximum left degree d1max =4
Maximum right degree d2max =59
Average degree d =2.269 50
Average left degree d1 =1.176 47
Average right degree d2 =32.000 0
Fill p =0.235 294
Size of LCC N =141
Diameter δ =6
50-Percentile effective diameter δ0.5 =3.079 98
90-Percentile effective diameter δ0.9 =3.825 69
Median distance δM =4
Mean distance δm =3.107 33
Gini coefficient G =0.551 654
Balanced inequality ratio P =0.296 875
Left balanced inequality ratio P1 =0.456 250
Right balanced inequality ratio P2 =0.300 000
Relative edge distribution entropy Her =0.772 611
Power law exponent γ =5.503 71
Tail power law exponent γt =2.721 00
Tail power law exponent with p γ3 =2.721 00
p-value p =0.014 000 0
Left tail power law exponent with p γ3,1 =3.391 00
Left p-value p1 =0.196 000
Right tail power law exponent with p γ3,2 =2.011 00
Right p-value p2 =0.554 000
Degree assortativity ρ =−0.243 064
Degree assortativity p-value pρ =0.001 954 75
Spectral norm α =7.949 68
Algebraic connectivity a =0.076 333 5
Spectral separation 1[A] / λ2[A]| =1.103 10
Controllability C =131
Relative controllability Cr =0.929 078

Plots

Fruchterman–Reingold graph drawing

Degree distribution

Cumulative degree distribution

Lorenz curve

Spectral distribution of the adjacency matrix

Spectral distribution of the normalized adjacency matrix

Spectral distribution of the Laplacian

Spectral graph drawing based on the adjacency matrix

Spectral graph drawing based on the Laplacian

Spectral graph drawing based on the normalized adjacency matrix

Degree assortativity

Zipf plot

Hop distribution

Double Laplacian graph drawing

Delaunay graph drawing

Matrix decompositions plots

Downloads

References

[1] Jérôme Kunegis. KONECT – The Koblenz Network Collection. In Proc. Int. Conf. on World Wide Web Companion, pages 1343–1350, 2013. [ http ]
[2] David Hackett Fischer. Paul Revere's Ride. Oxford paperbacks. Oxford Univ. Press, 1995.