arXiv astro-ph
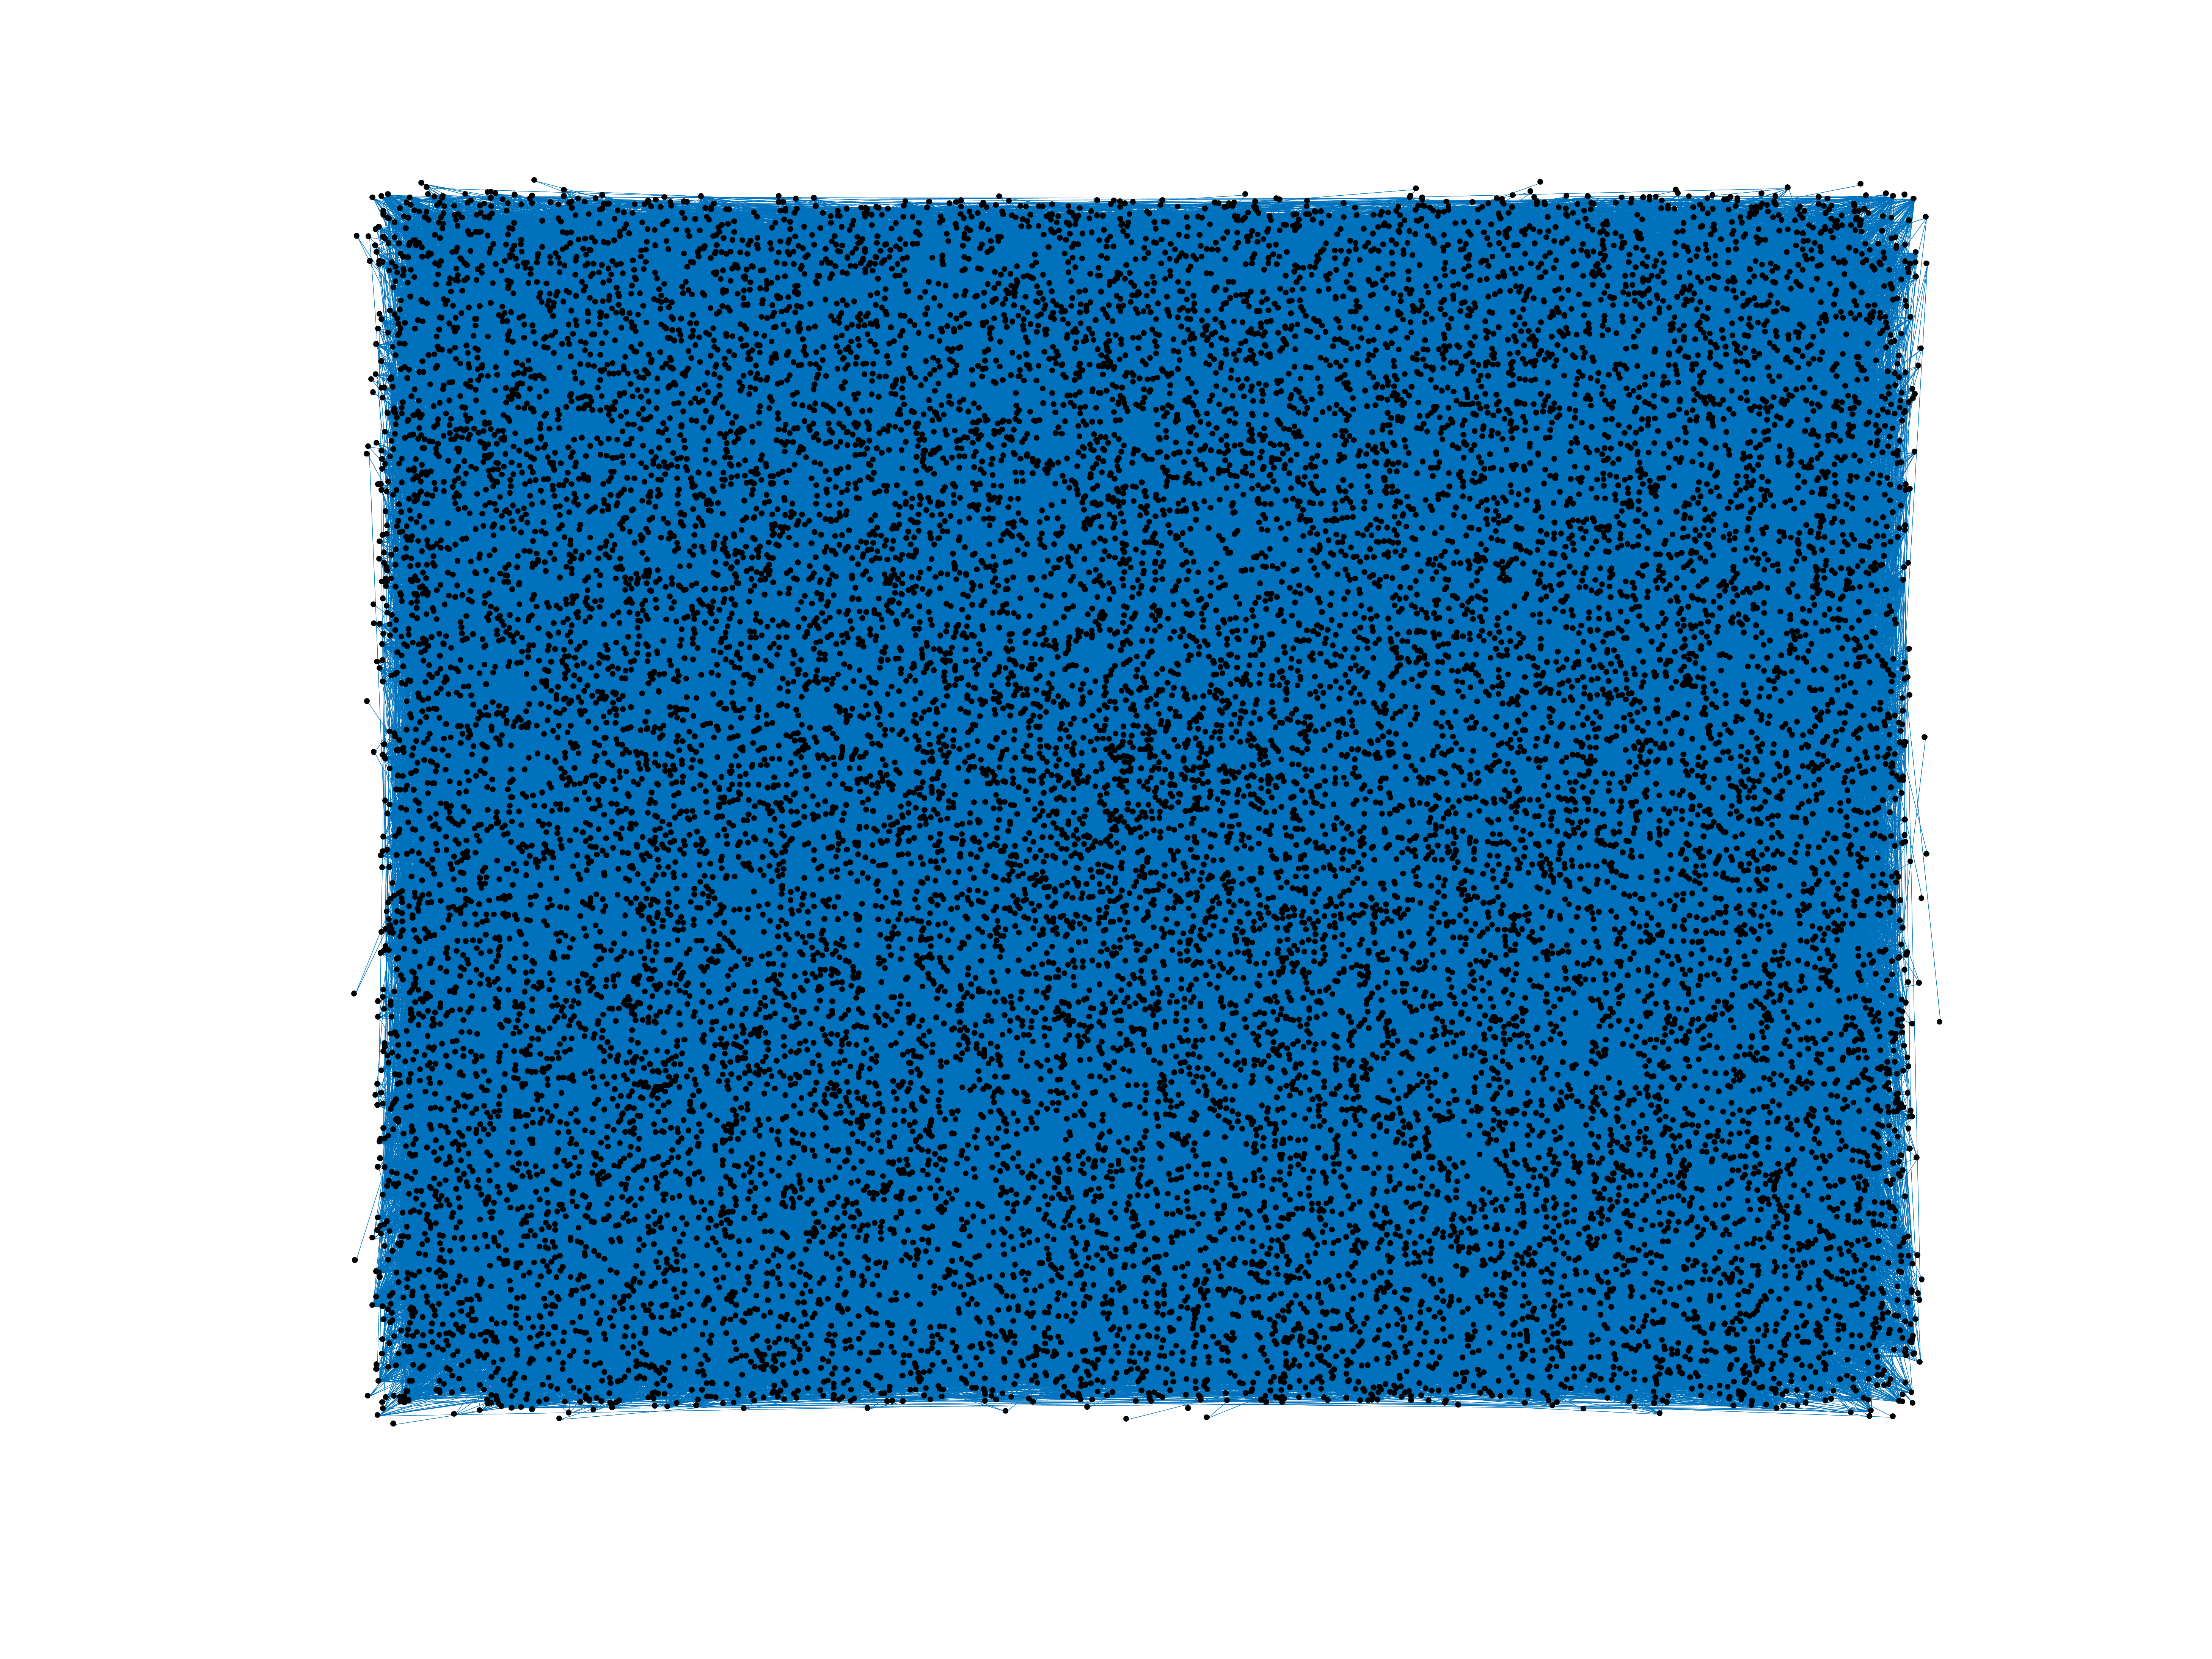
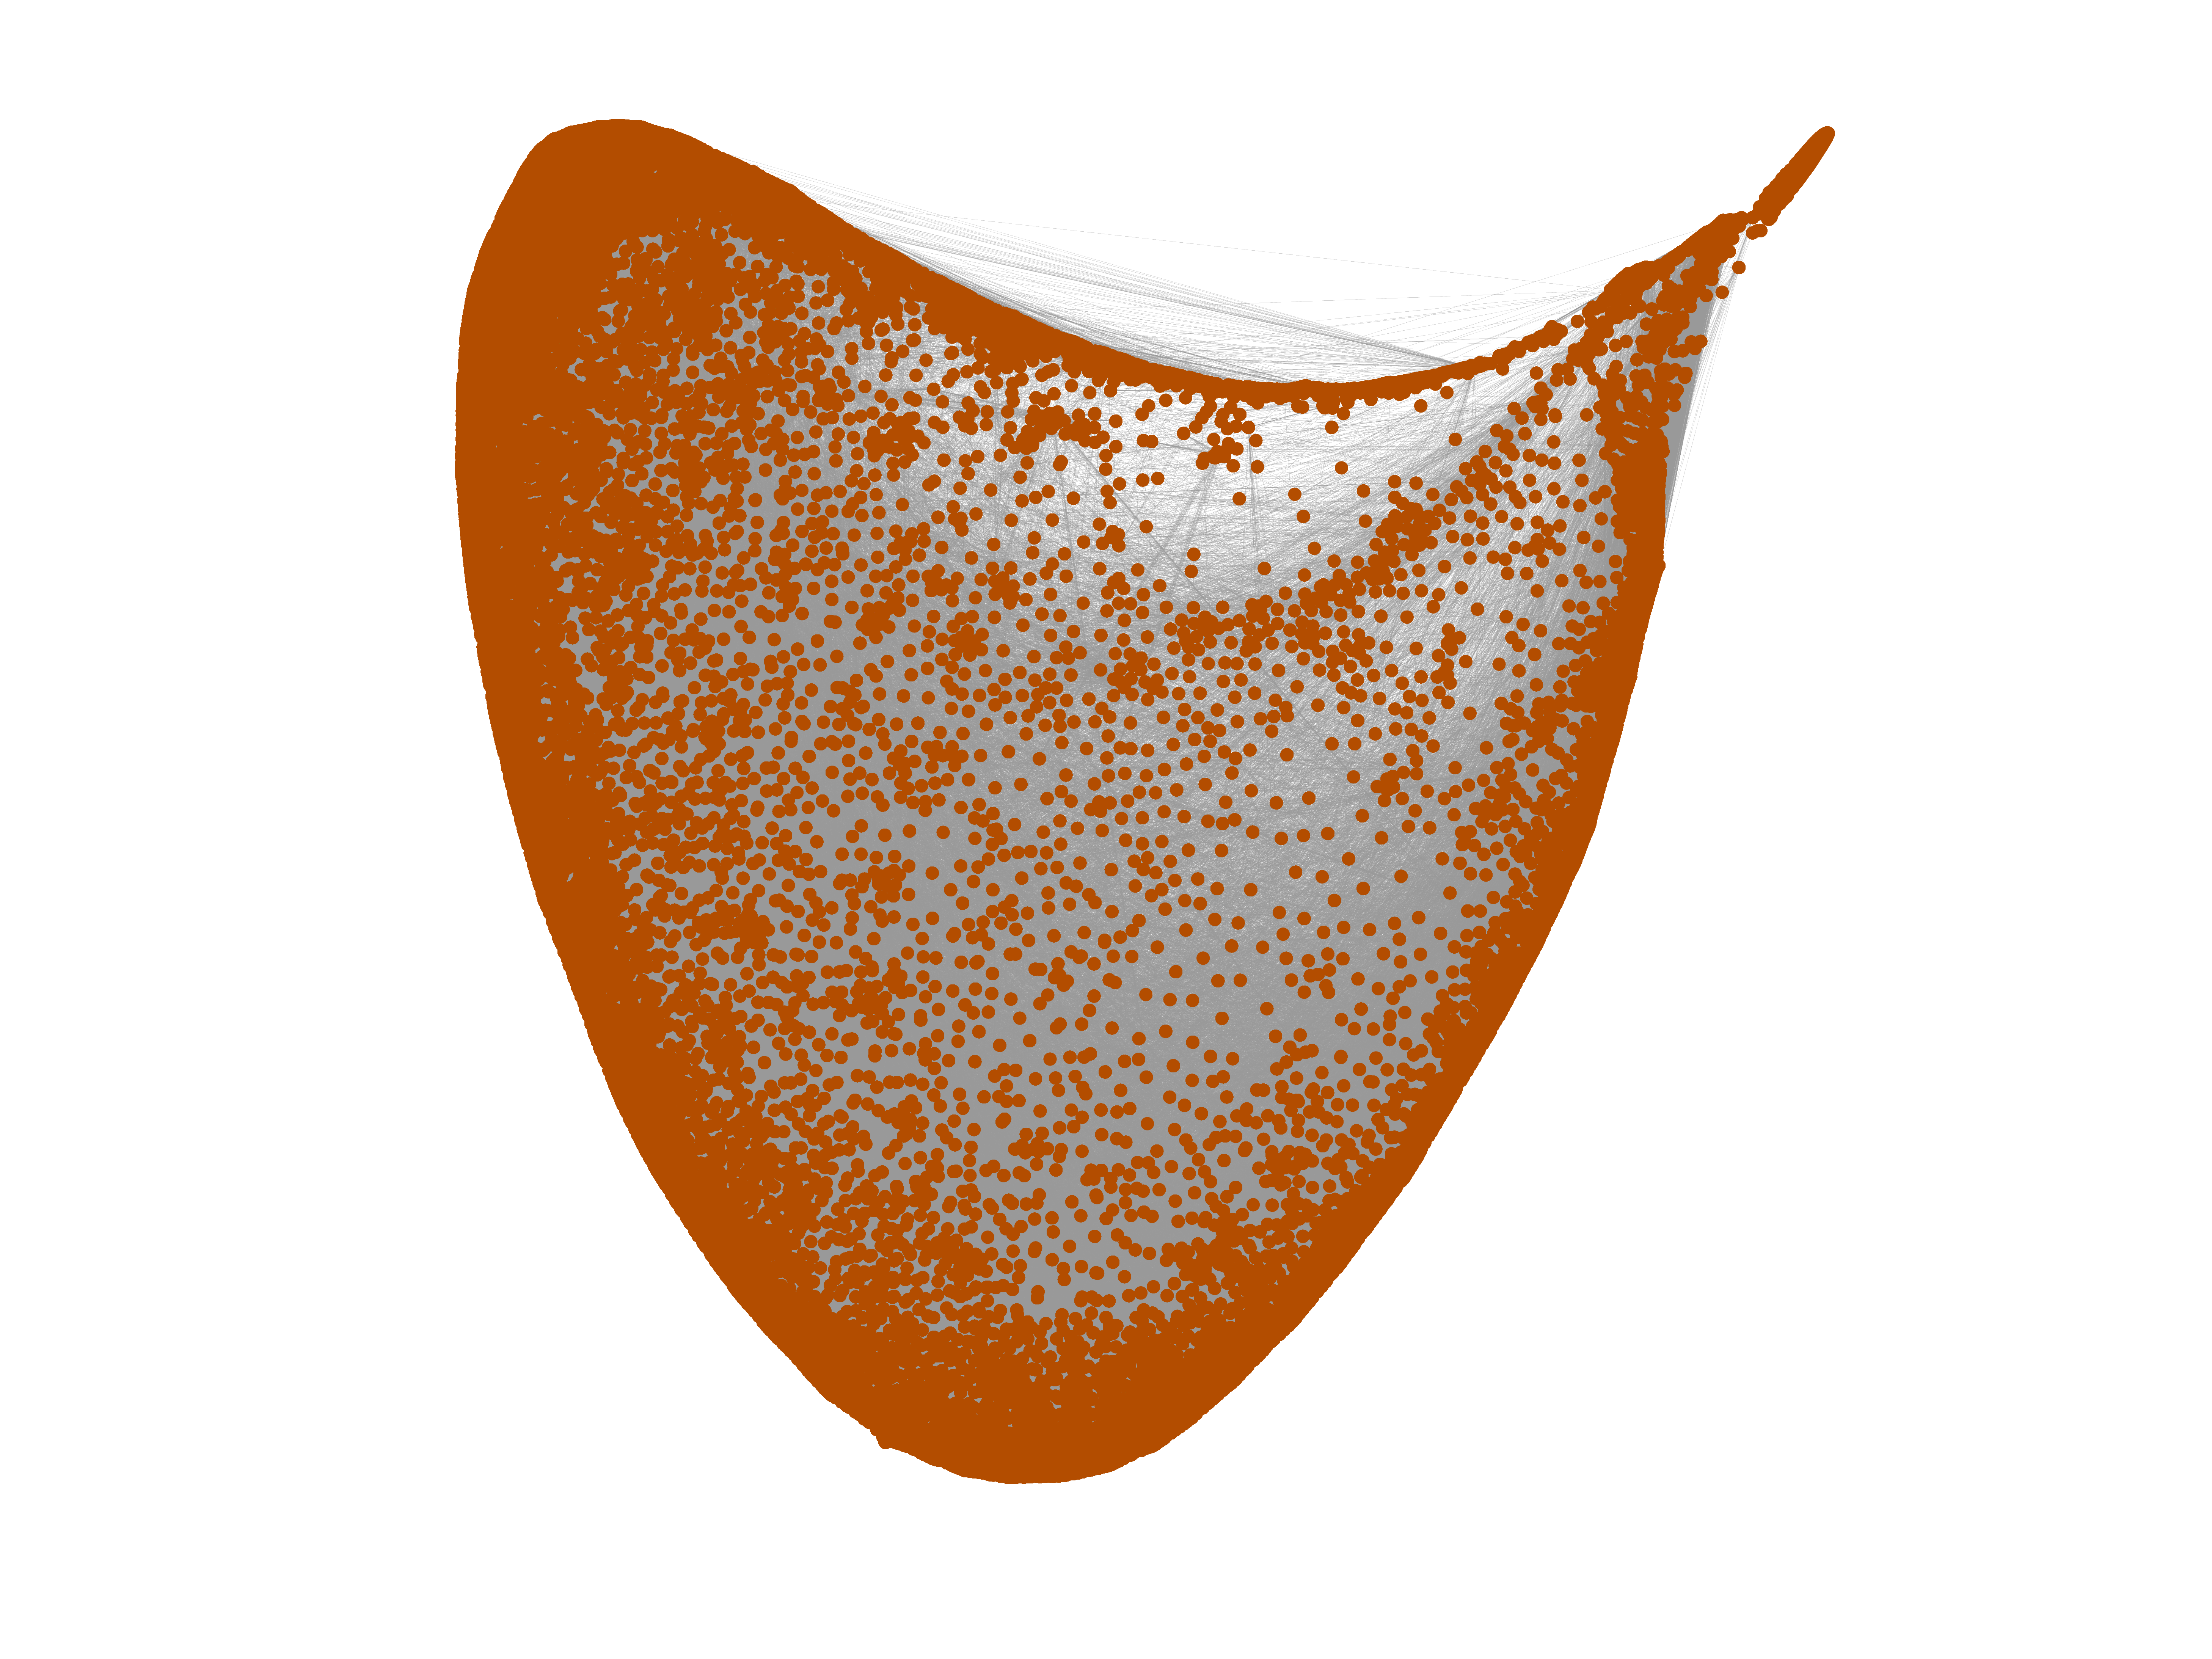
This is the collaboration graph of authors of scientific papers from the
arXiv's Astrophysics (astro-ph) section. An edge between two authors represents
a common publication.
Metadata
Statistics
| Size | n = | 18,771
|
| Volume | m = | 198,050
|
| Loop count | l = | 0
|
| Wedge count | s = | 12,749,380
|
| Claw count | z = | 545,677,552
|
| Cross count | x = | 28,436,651,241
|
| Triangle count | t = | 1,351,441
|
| Square count | q = | 44,916,549
|
| 4-Tour count | T4 = | 410,726,012
|
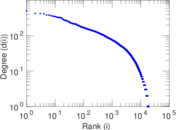
| Maximum degree | dmax = | 504
|
| Average degree | d = | 21.101 7
|
| Fill | p = | 0.001 124 22
|
| Size of LCC | N = | 17,903
|
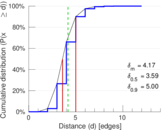
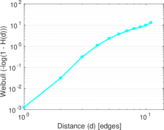
| Diameter | δ = | 14
|
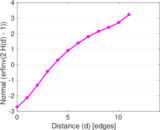
| 50-Percentile effective diameter | δ0.5 = | 3.593 59
|
| 90-Percentile effective diameter | δ0.9 = | 5.002 79
|
| Median distance | δM = | 4
|
| Mean distance | δm = | 4.174 33
|
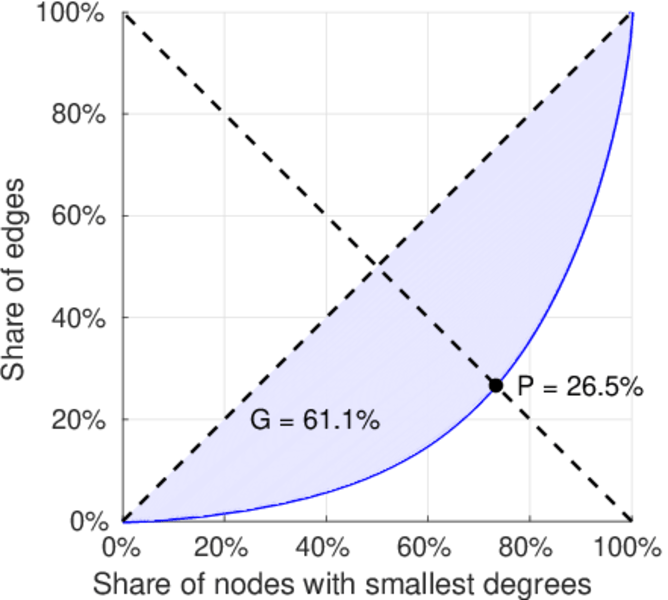
| Gini coefficient | G = | 0.610 511
|
| Balanced inequality ratio | P = | 0.265 125
|
| Relative edge distribution entropy | Her = | 0.931 468
|
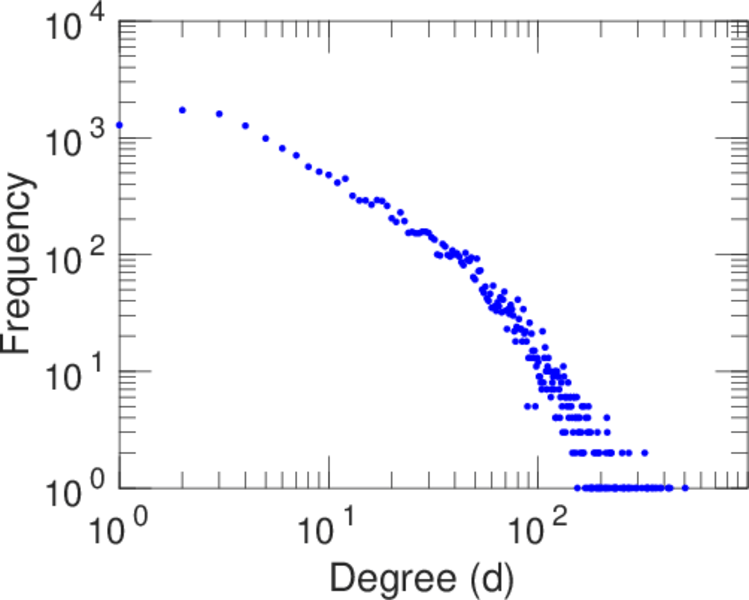
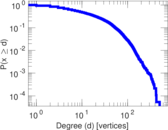
| Power law exponent | γ = | 1.439 22
|
| Tail power law exponent | γt = | 2.861 00
|
| Tail power law exponent with p | γ3 = | 2.861 00
|
| p-value | p = | 0.000 00
|
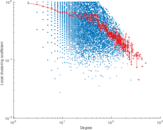
| Degree assortativity | ρ = | +0.205 129
|
| Degree assortativity p-value | pρ = | 0.000 00
|
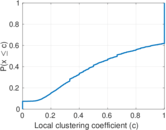
| Clustering coefficient | c = | 0.318 002
|
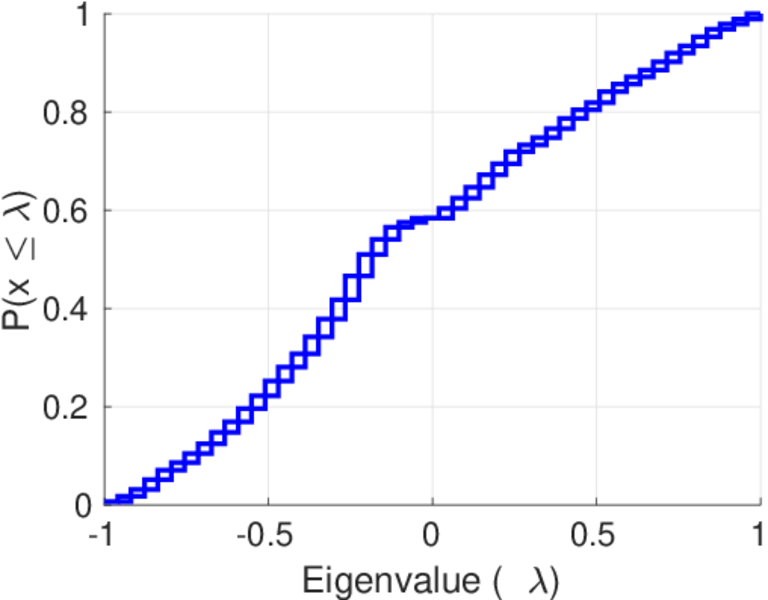
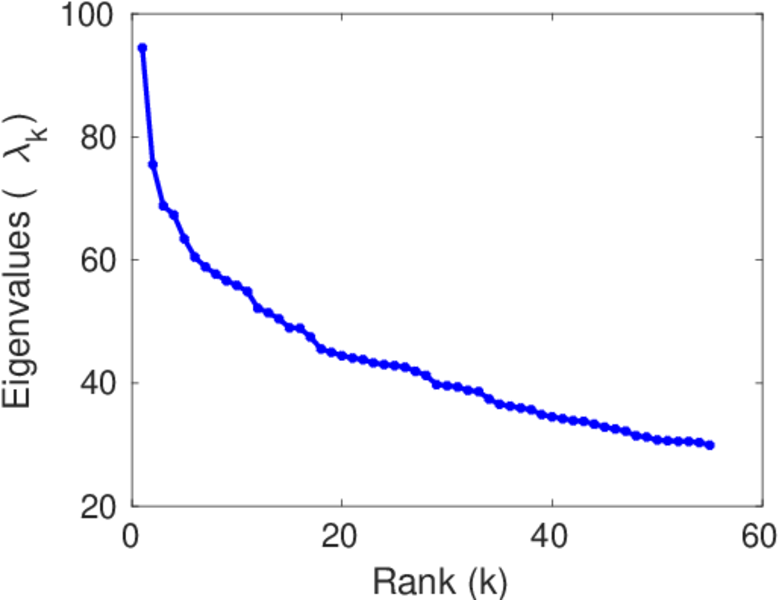
| Spectral norm | α = | 94.429 6
|
| Algebraic connectivity | a = | 0.027 215 7
|
| Spectral separation | |λ1[A] / λ2[A]| = | 1.251 04
|
| Non-bipartivity | bA = | 0.700 817
|
| Normalized non-bipartivity | bN = | 0.084 055 4
|
| Algebraic non-bipartivity | χ = | 0.135 163
|
| Spectral bipartite frustration | bK = | 0.001 535 64
|
| Controllability | C = | 538
|
| Relative controllability | Cr = | 0.028 661 2
|
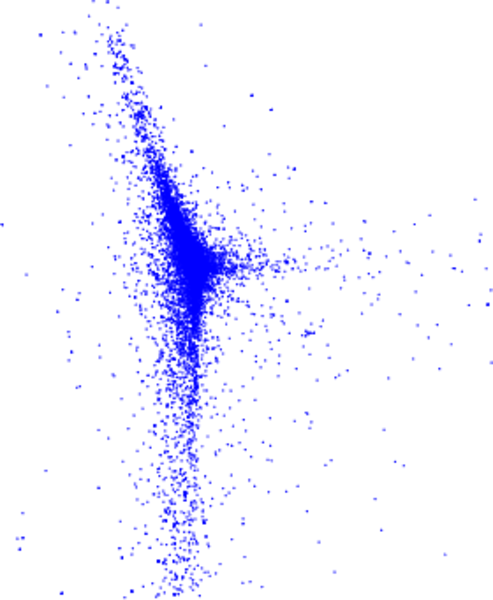
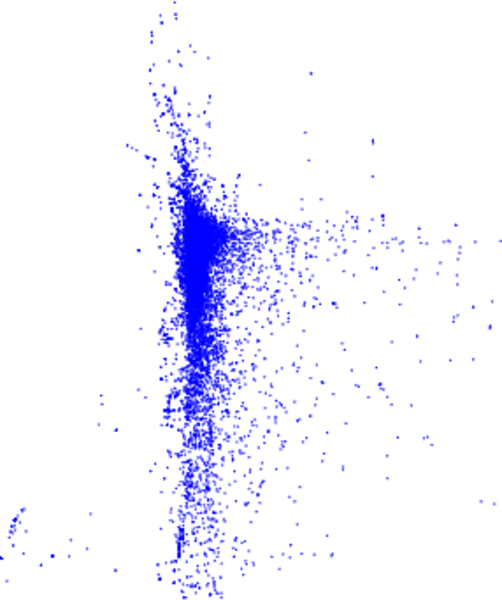
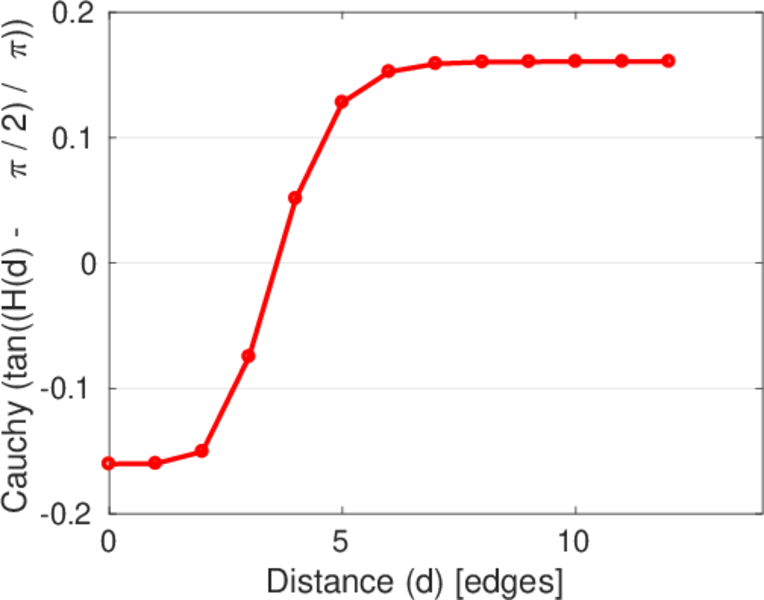
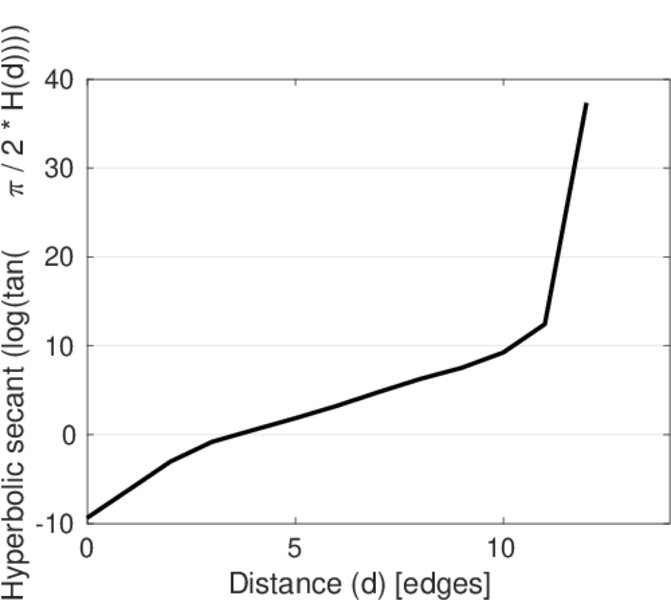
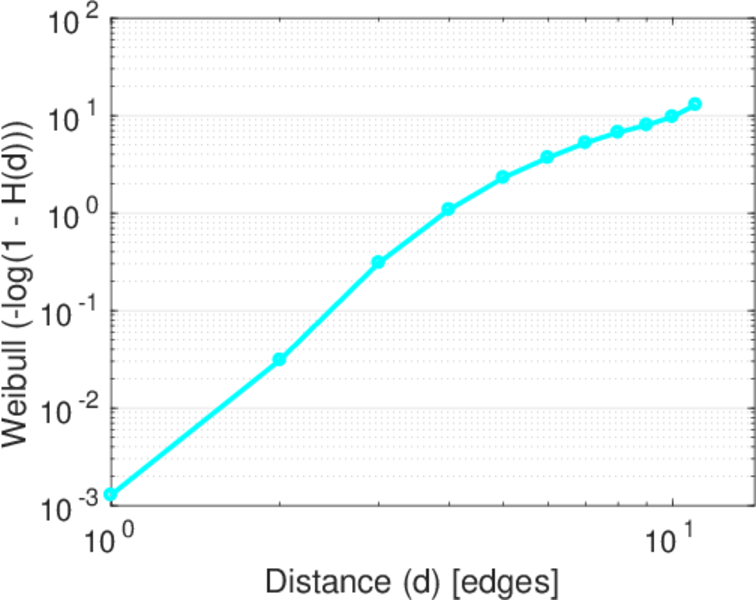
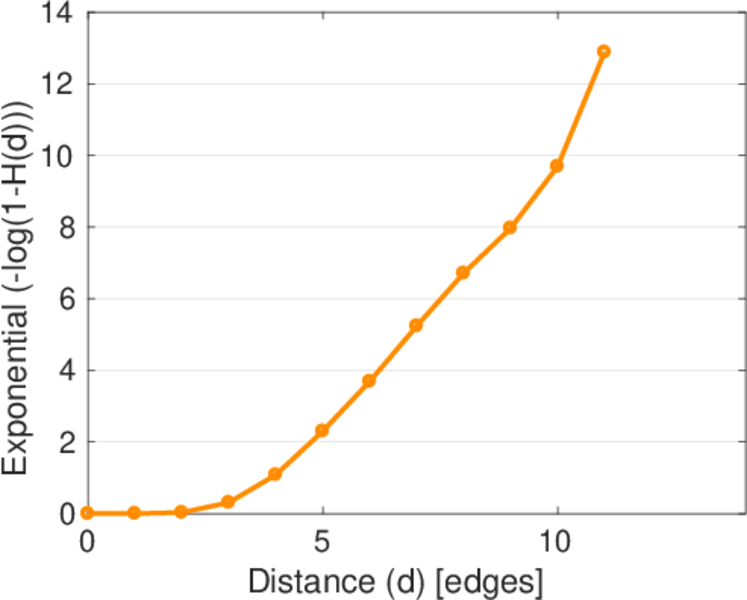
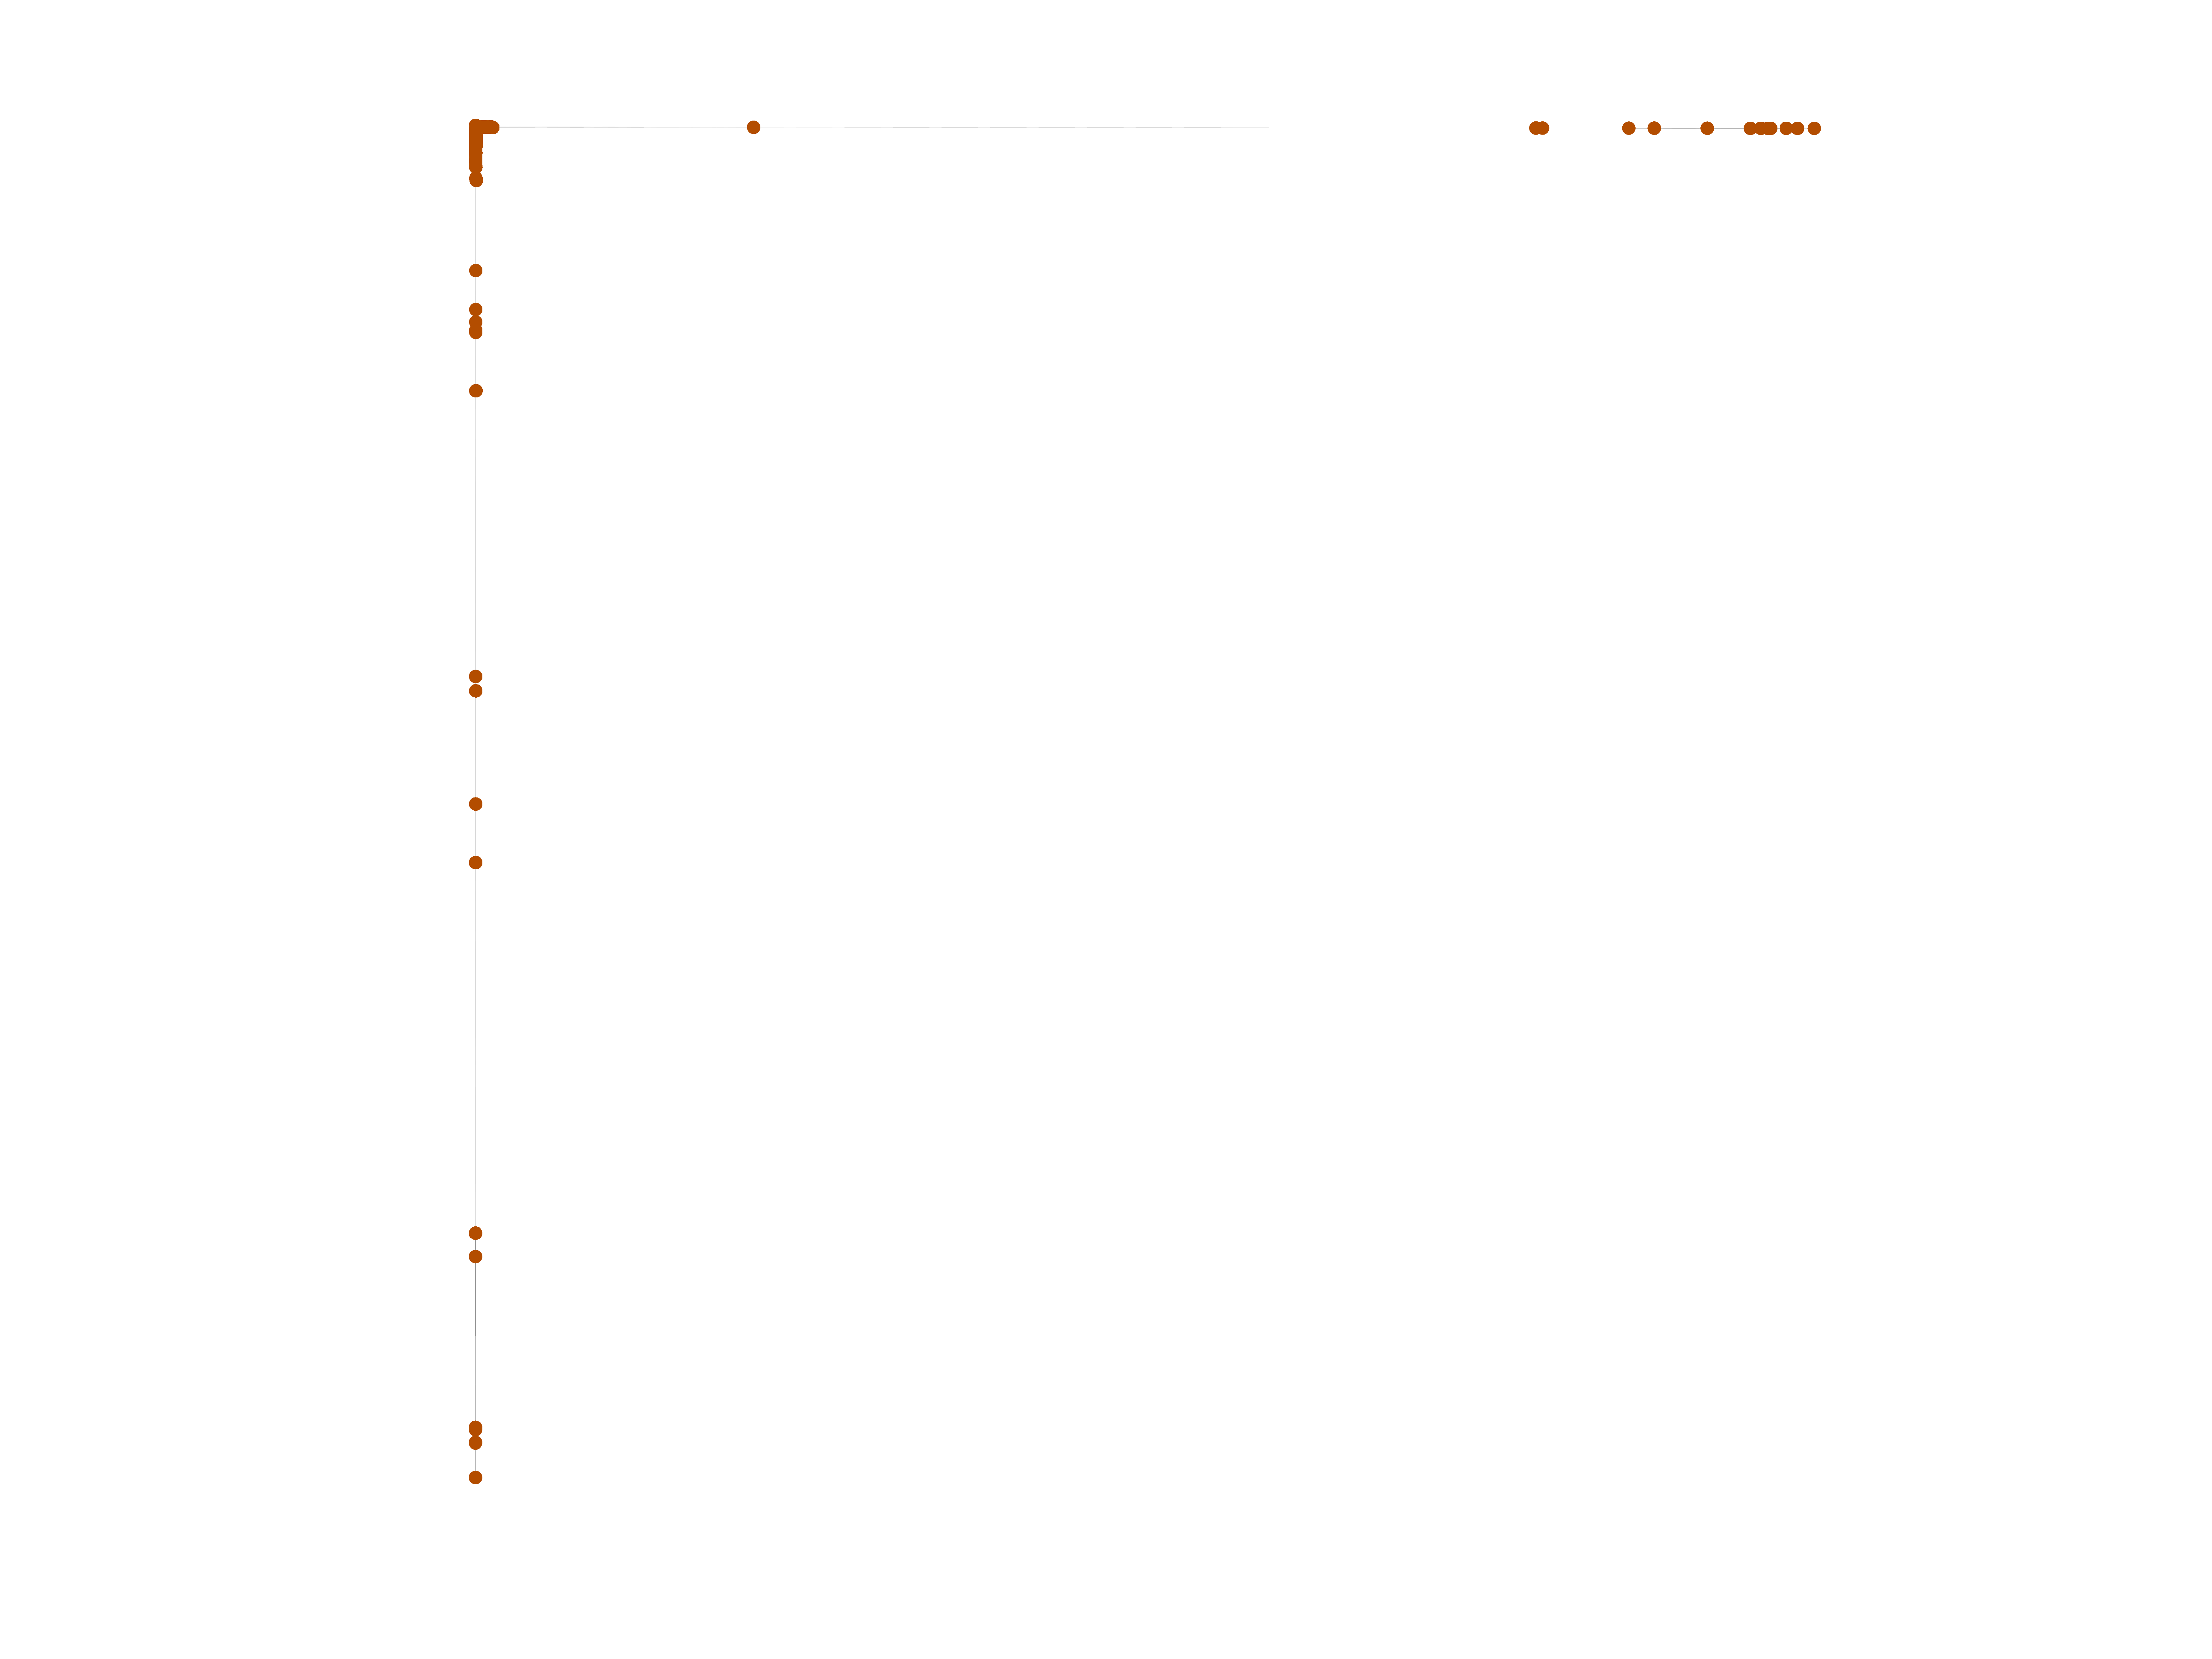
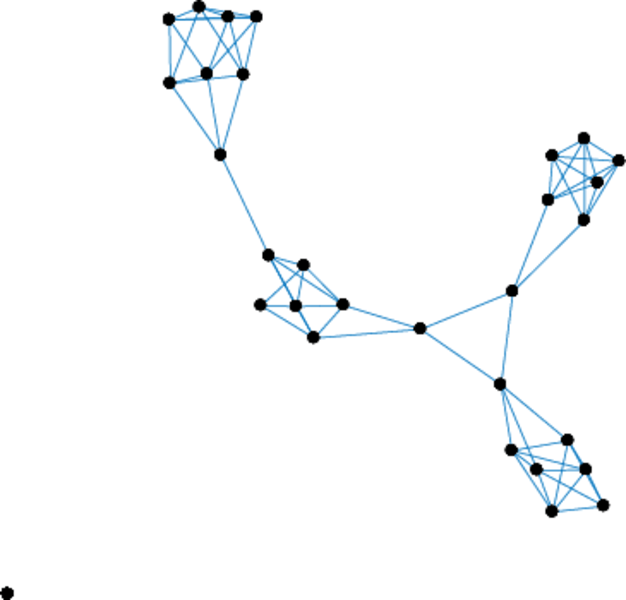
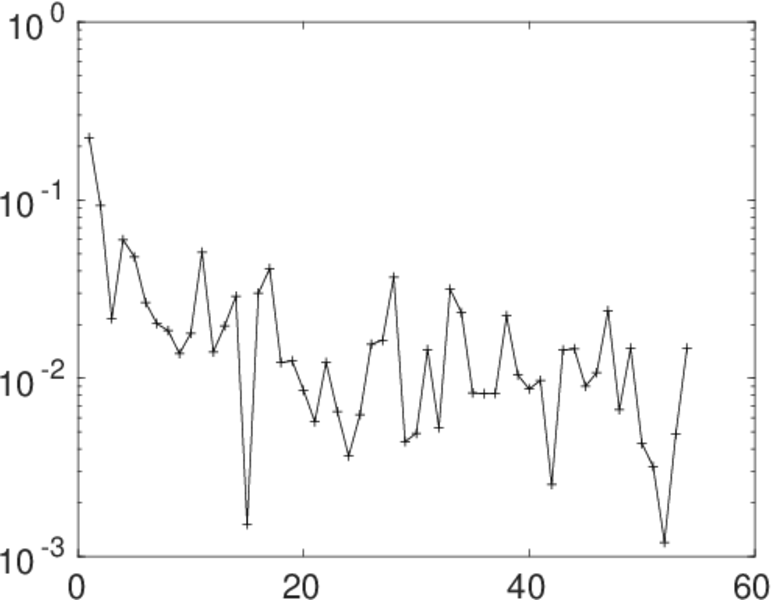
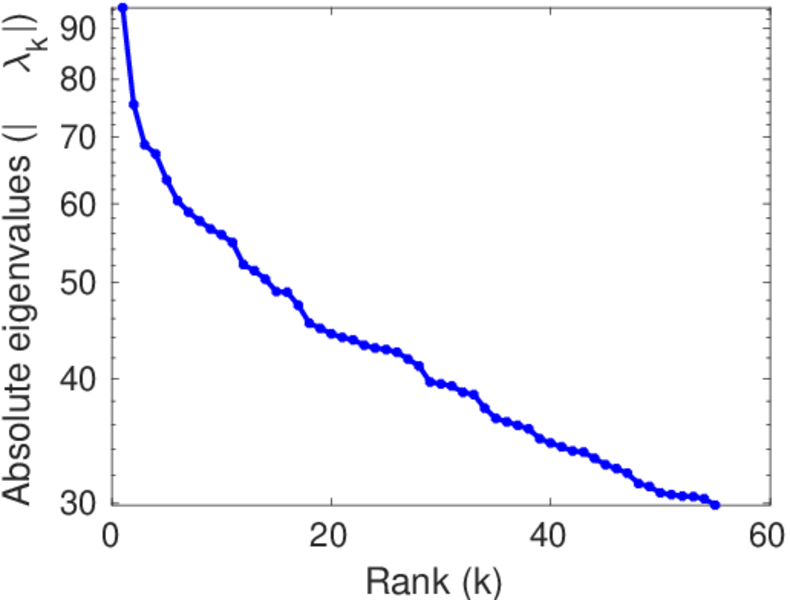
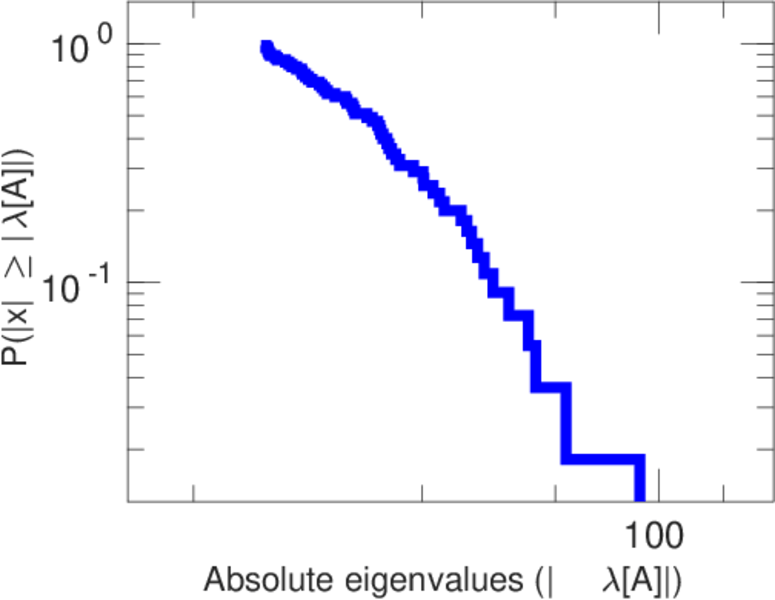
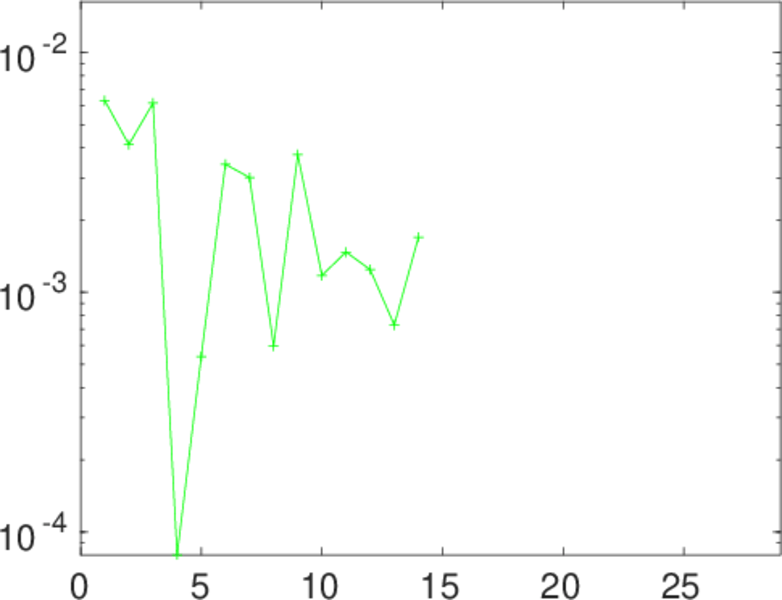
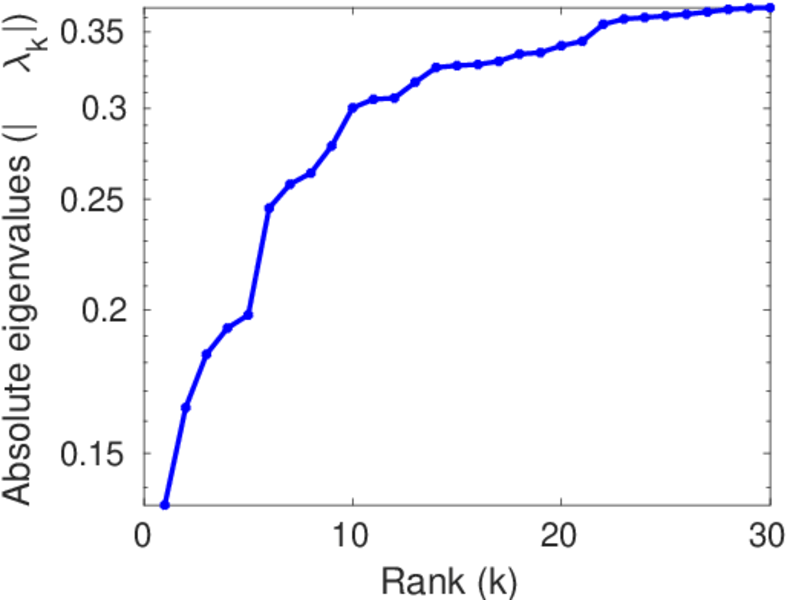
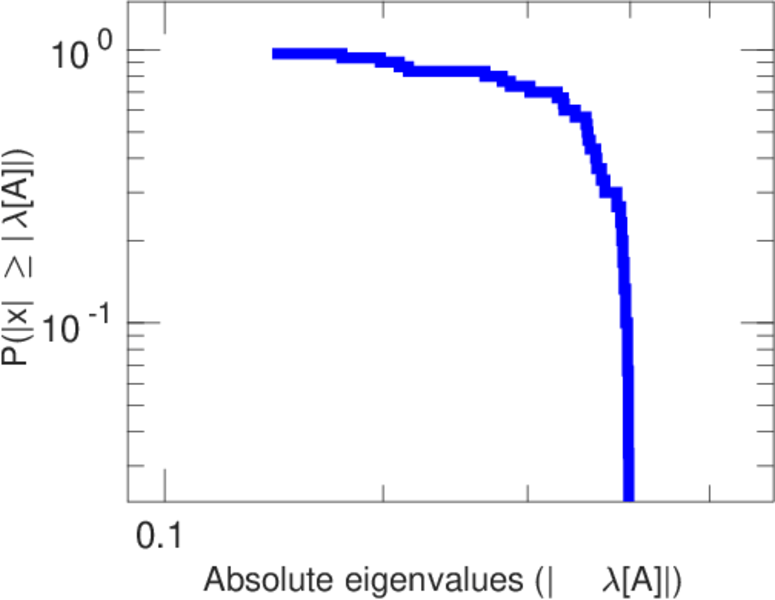
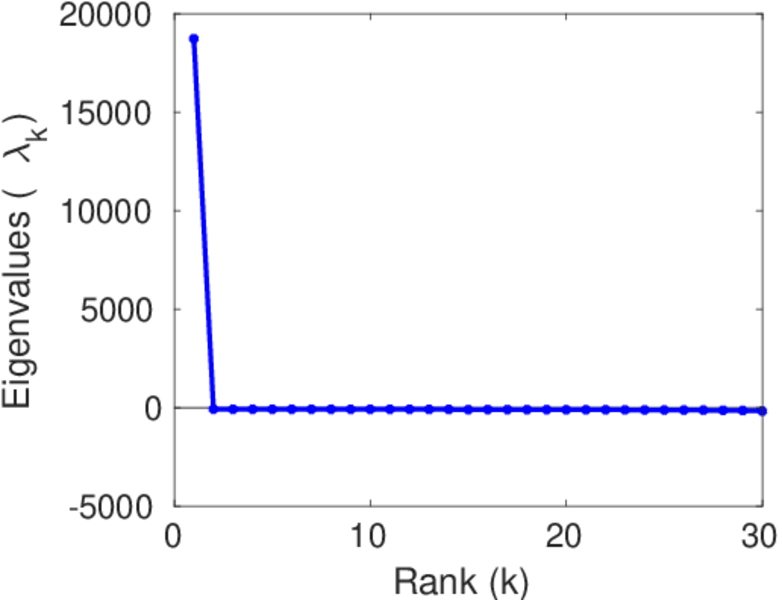
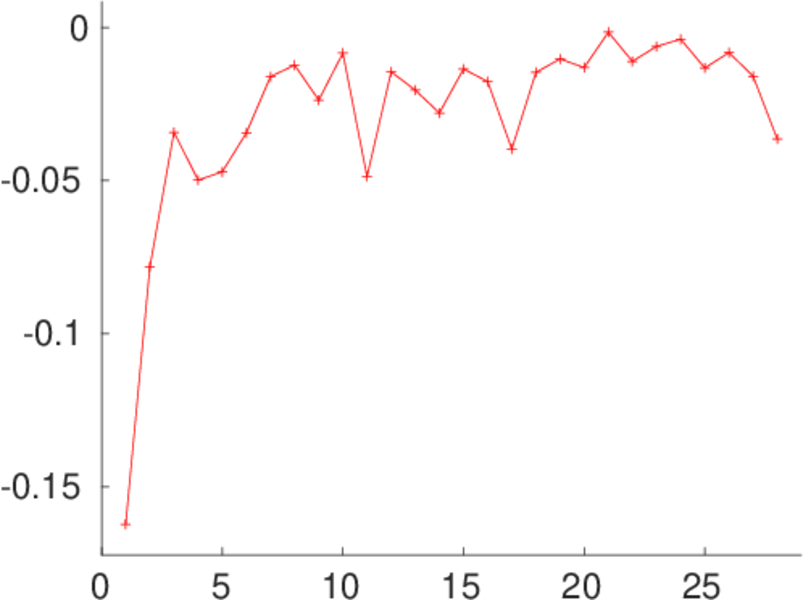
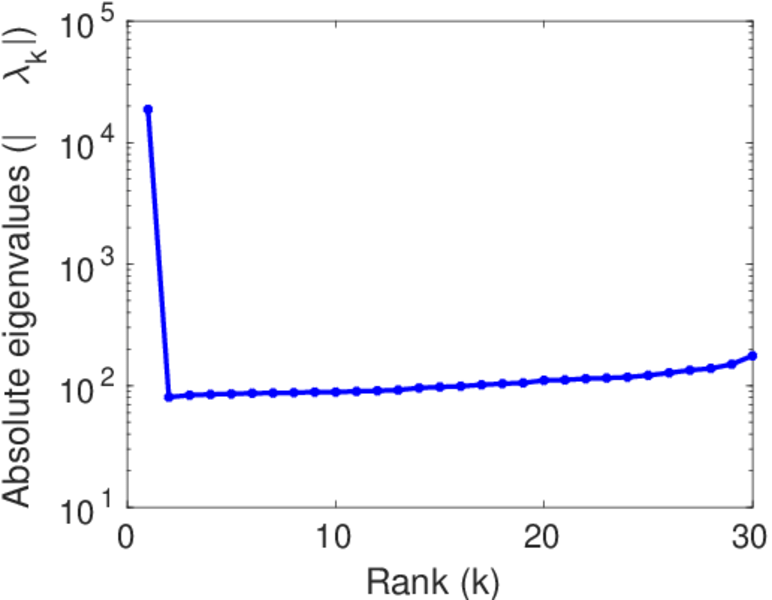
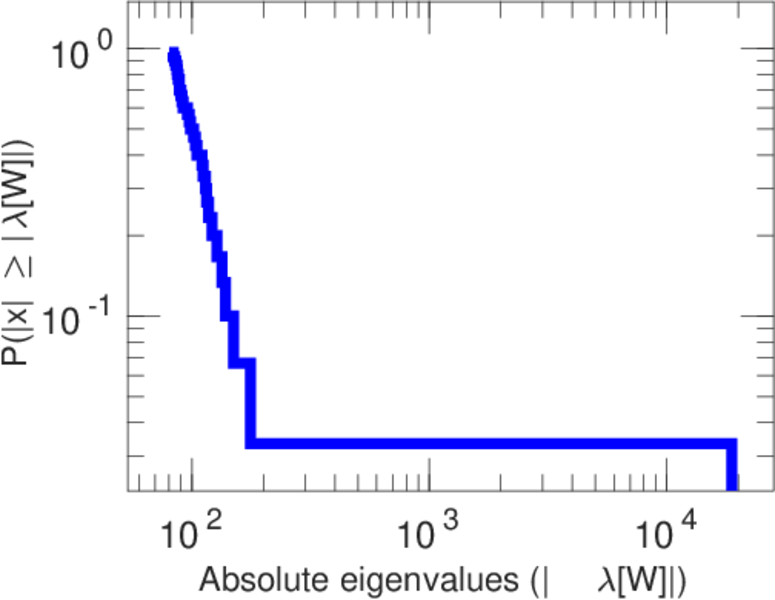
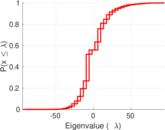
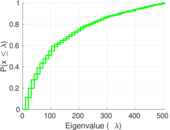
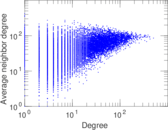
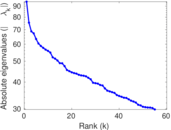
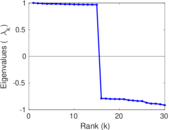
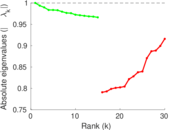
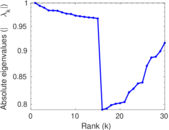
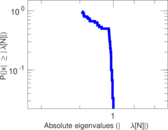
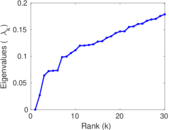
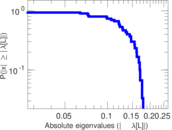
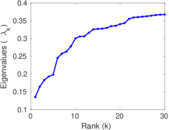
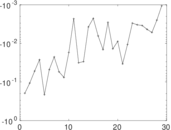
Plots


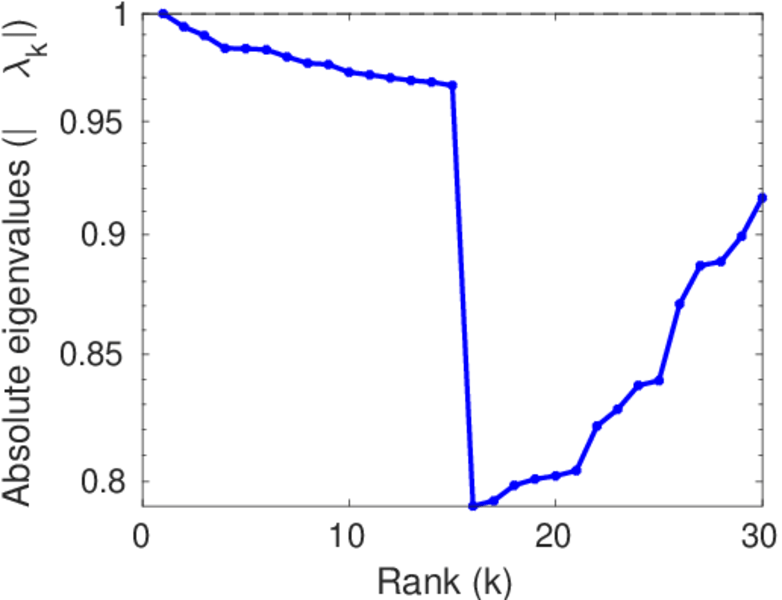
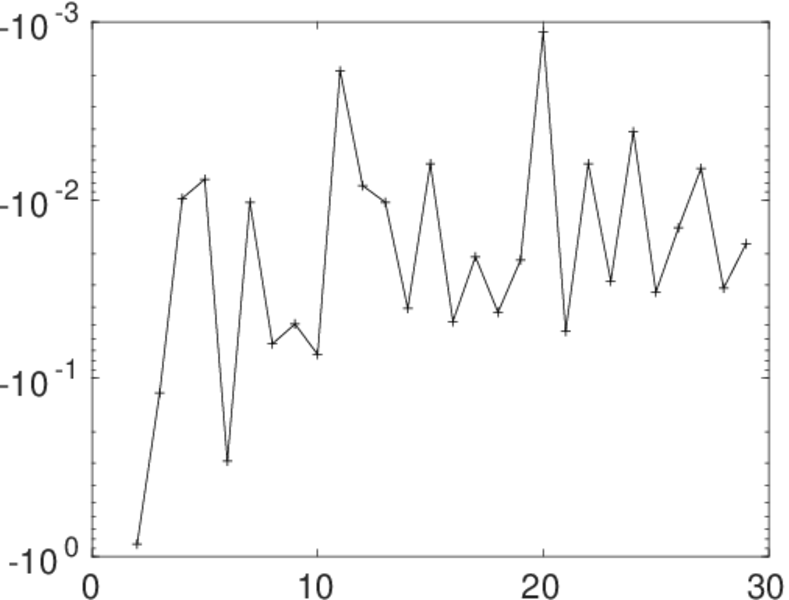
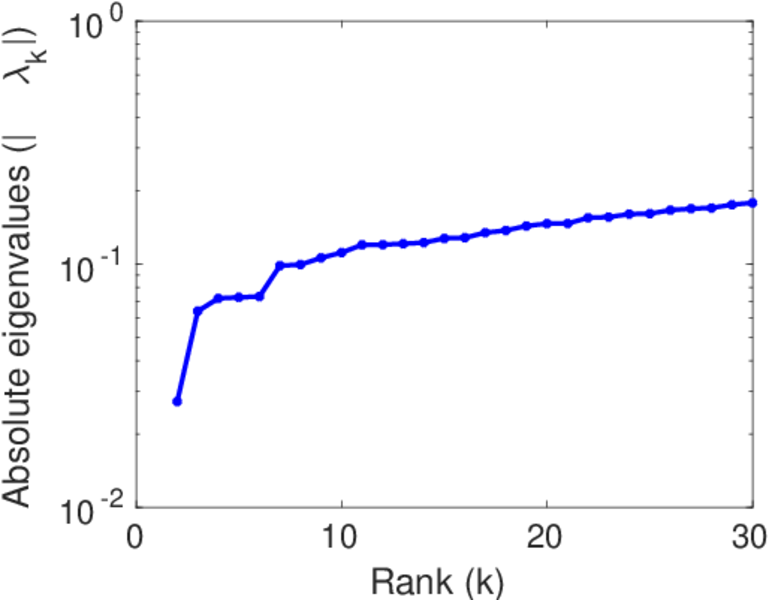
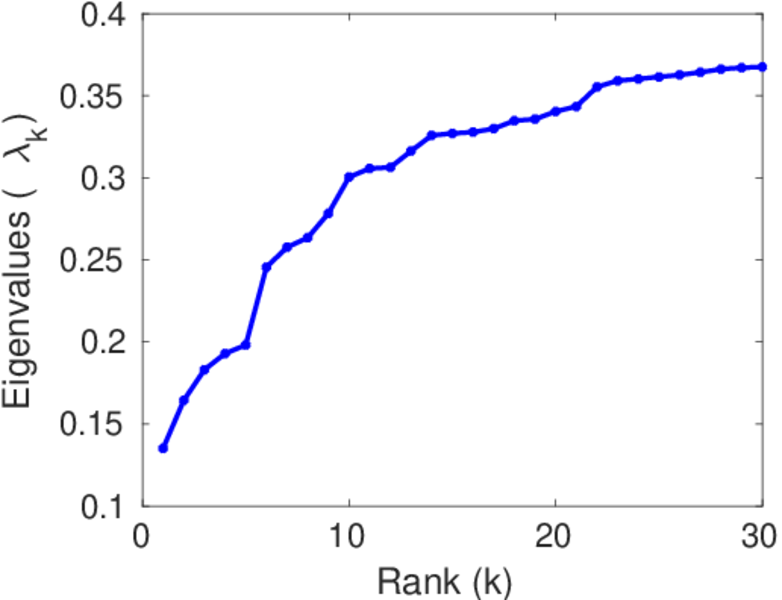
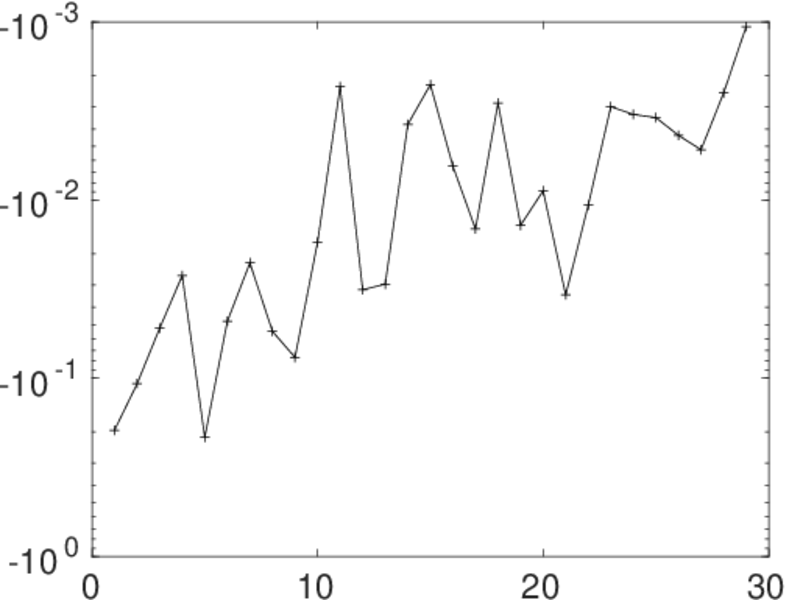
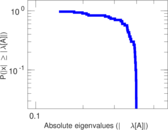
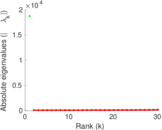
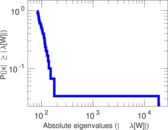
Matrix decompositions plots


Downloads
References
|
[1]
|
Jérôme Kunegis.
KONECT – The Koblenz Network Collection.
In Proc. Int. Conf. on World Wide Web Companion, pages
1343–1350, 2013.
[ http ]
|
|
[2]
|
Jure Leskovec, Jon Kleinberg, and Christos Faloutsos.
Graph evolution: Densification and shrinking diameters.
ACM Trans. Knowl. Discov. from Data, 1(1):1–40, 2007.
|
 KONECT ‣ Networks ‣
Buy Me a Coffee
KONECT ‣ Networks ‣
Buy Me a Coffee