Amazon (MDS)
This is the co-purchase network of Amazon based on the "customers who bought
this also bought" feature. Nodes are products and an undirected edge between
two nodes shows that the corresponding products have been frequently bought
together.
Metadata
Statistics
| Size | n = | 334,863
|
| Volume | m = | 925,872
|
| Loop count | l = | 0
|
| Wedge count | s = | 9,752,186
|
| Claw count | z = | 142,823,893
|
| Cross count | x = | 6,722,504,872
|
| Triangle count | t = | 667,129
|
| Square count | q = | 3,125,323
|
| 4-Tour count | T4 = | 65,863,072
|
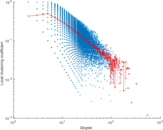
| Maximum degree | dmax = | 549
|
| Average degree | d = | 5.529 86
|
| Fill | p = | 1.651 38 × 10−5
|
| Size of LCC | N = | 334,863
|
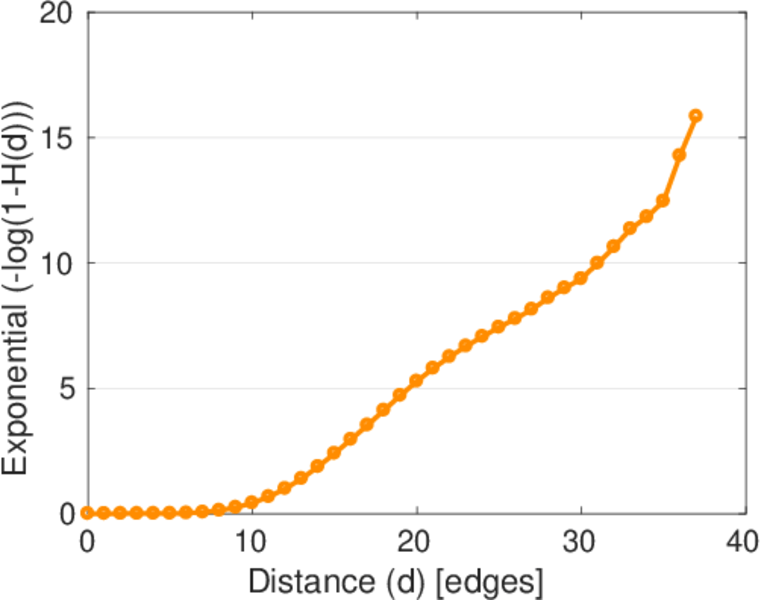
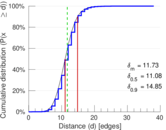
| Diameter | δ = | 47
|
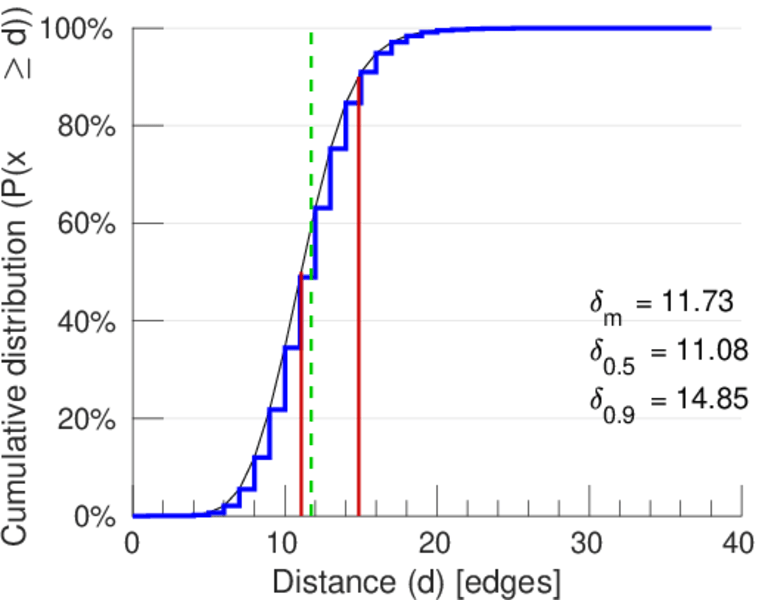
| 50-Percentile effective diameter | δ0.5 = | 11.076 0
|
| 90-Percentile effective diameter | δ0.9 = | 14.851 4
|
| Median distance | δM = | 12
|
| Mean distance | δm = | 11.725 3
|
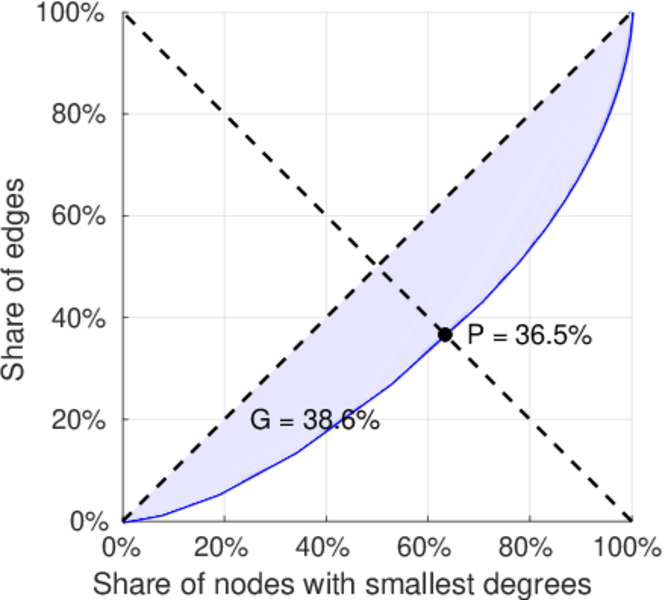
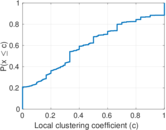
| Gini coefficient | G = | 0.385 905
|
| Balanced inequality ratio | P = | 0.364 978
|
| Relative edge distribution entropy | Her = | 0.976 681
|
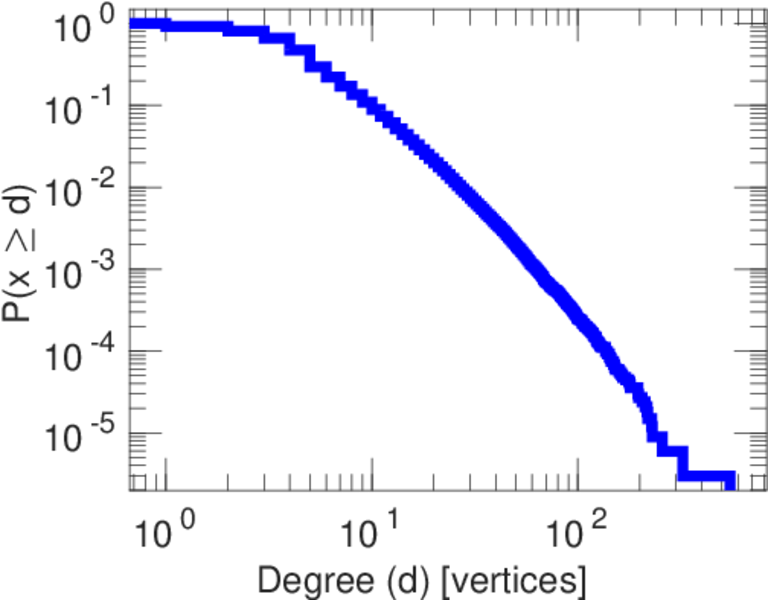
| Power law exponent | γ = | 1.691 22
|
| Tail power law exponent | γt = | 3.581 00
|
| Tail power law exponent with p | γ3 = | 3.581 00
|
| p-value | p = | 0.023 000 0
|
| Degree assortativity | ρ = | −0.058 819 6
|
| Degree assortativity p-value | pρ = | 0.000 00
|
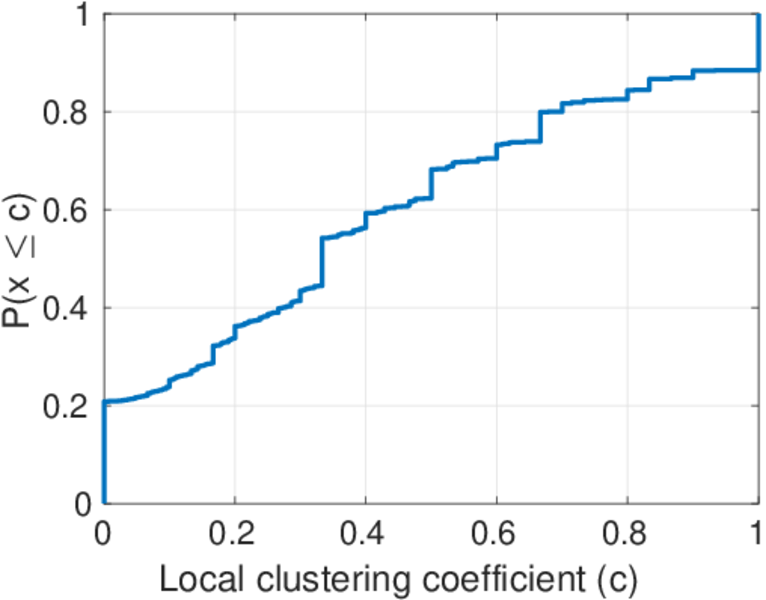
| Clustering coefficient | c = | 0.205 224
|
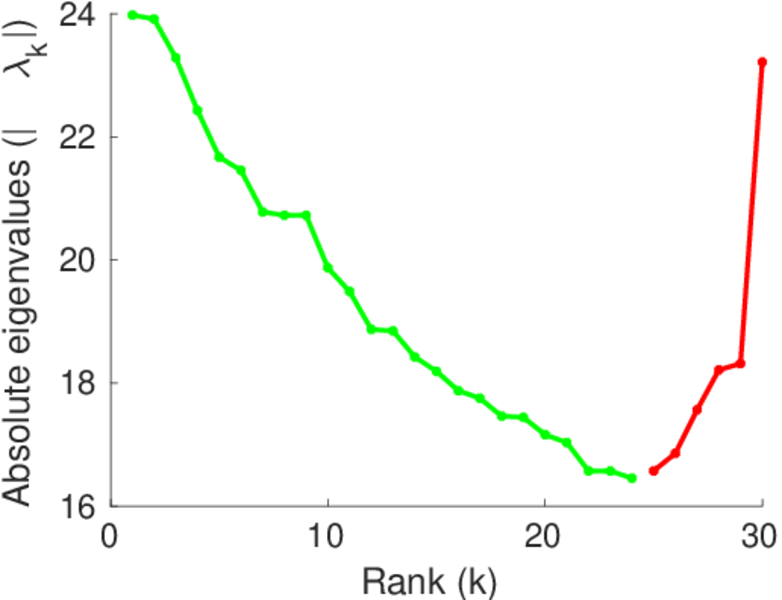
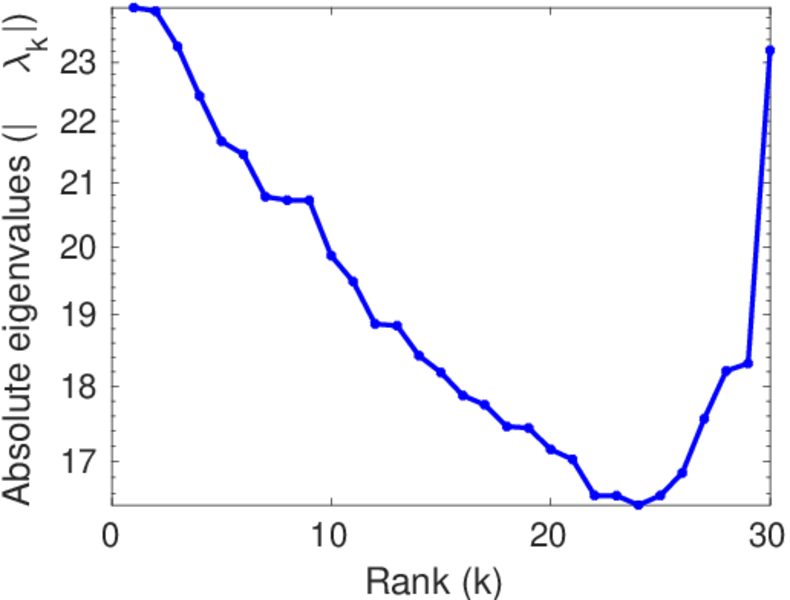
| Spectral norm | α = | 23.975 6
|
| Algebraic connectivity | a = | 0.000 586 130
|
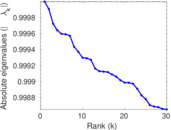
| Spectral separation | |λ1[A] / λ2[A]| = | 1.002 63
|
| Non-bipartivity | bA = | 0.031 835 0
|
| Normalized non-bipartivity | bN = | 0.012 895 0
|
| Algebraic non-bipartivity | χ = | 0.026 216 2
|
| Spectral bipartite frustration | bK = | 0.001 185 21
|
| Controllability | C = | 45,973
|
| Relative controllability | Cr = | 0.137 289
|
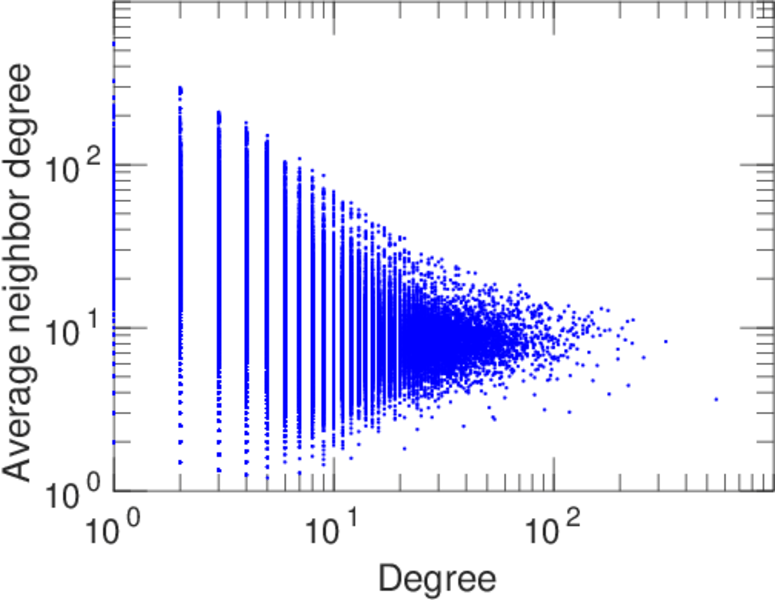
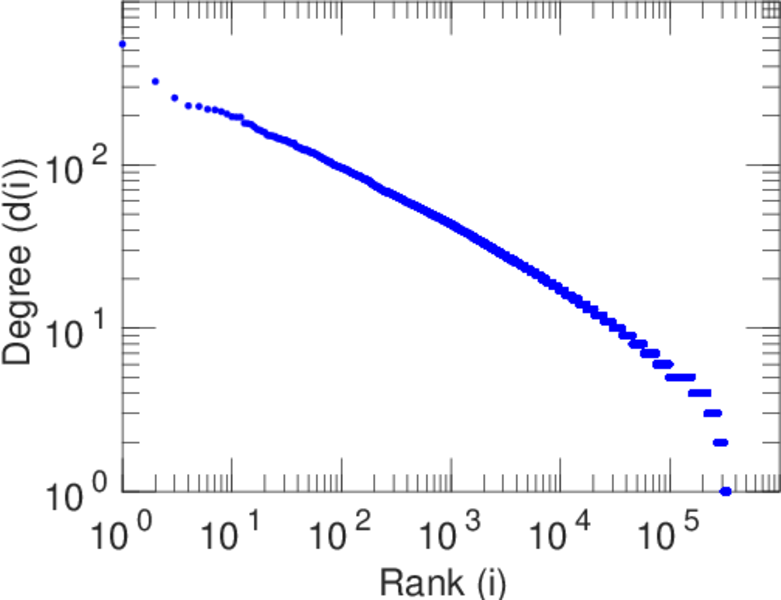
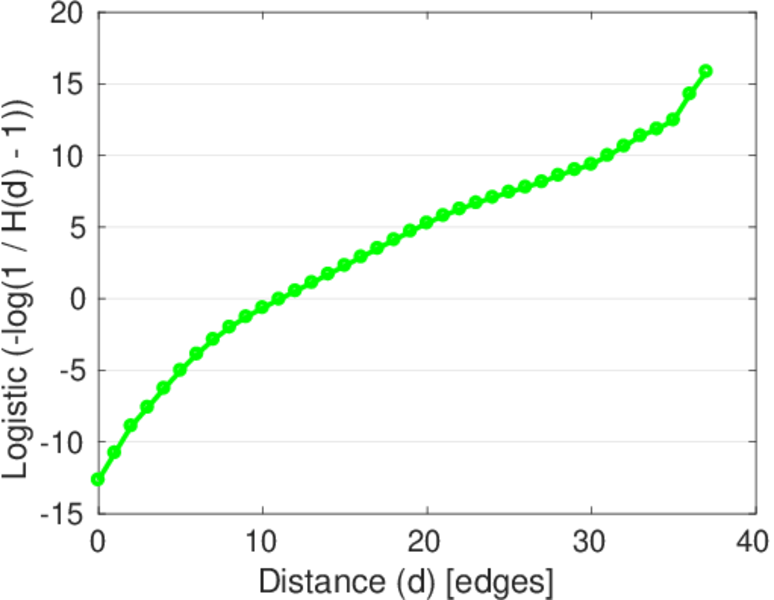
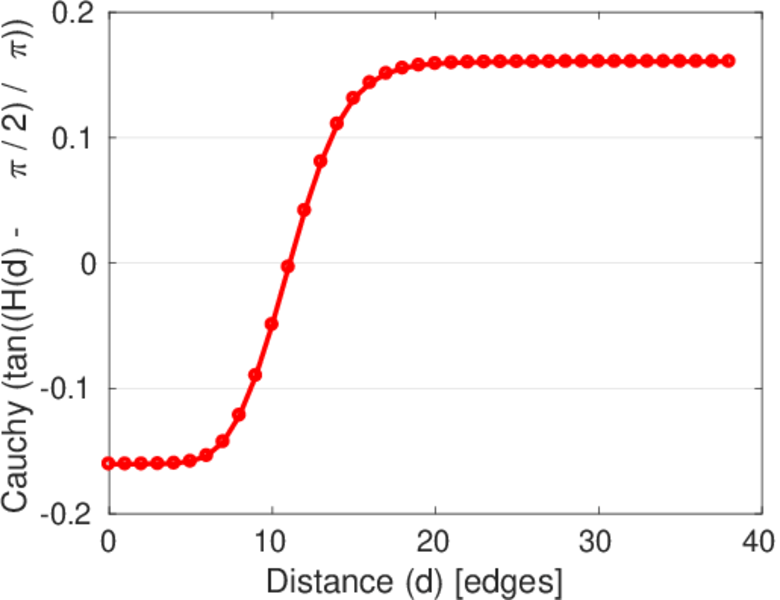
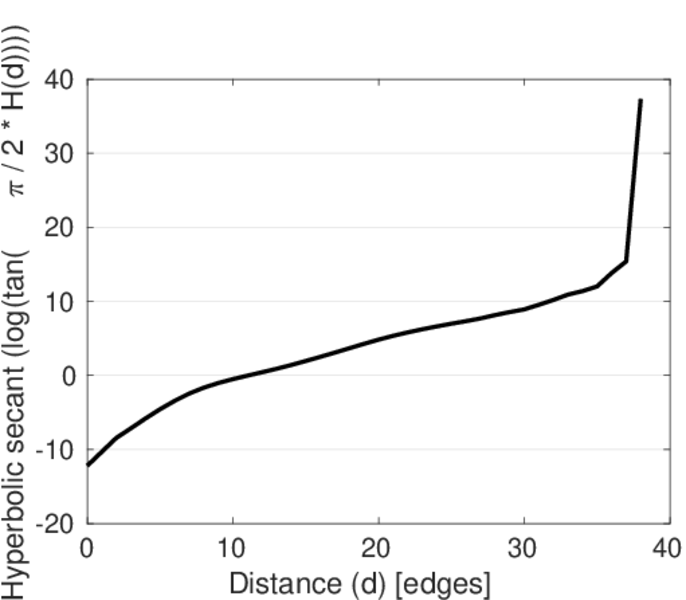
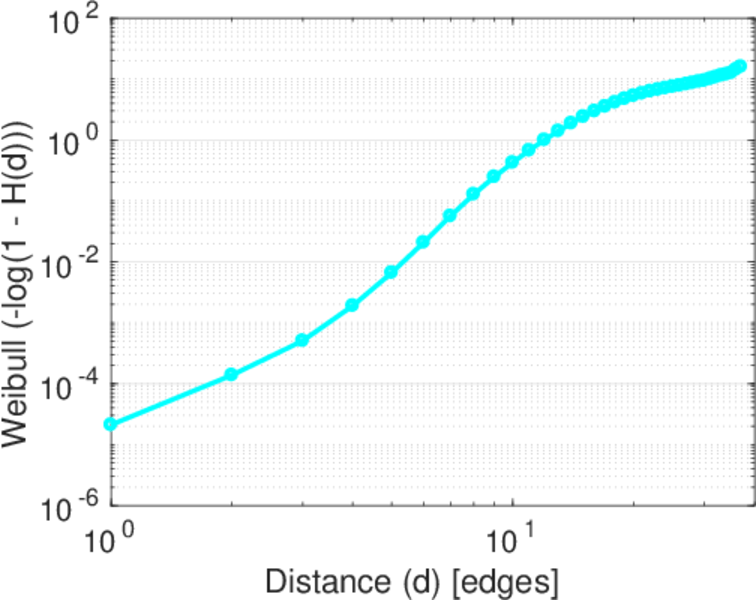
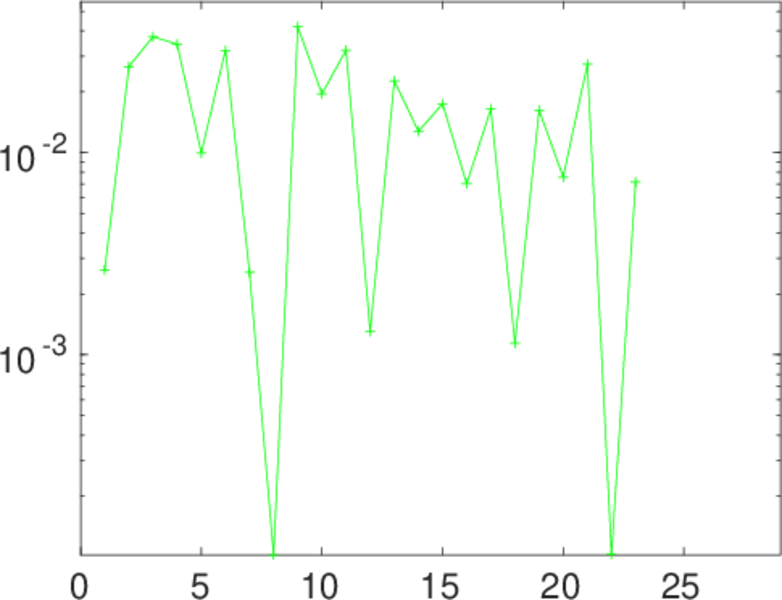
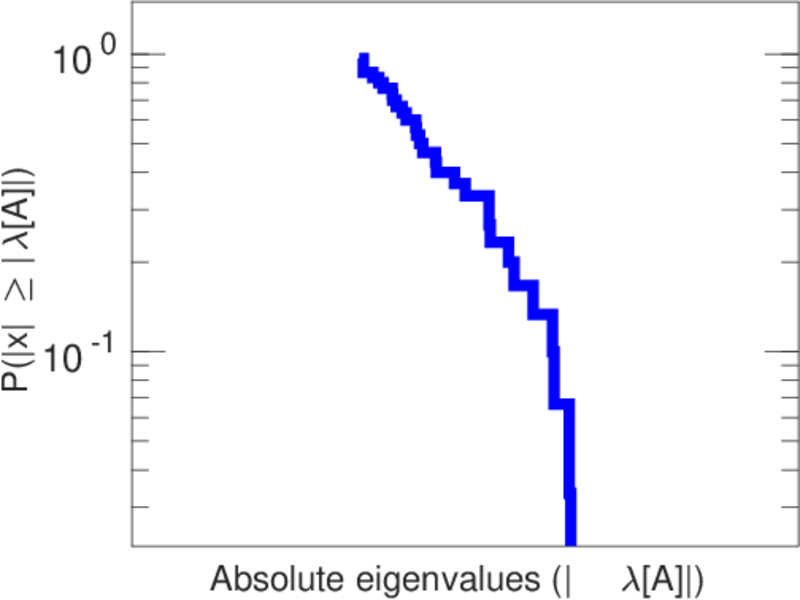
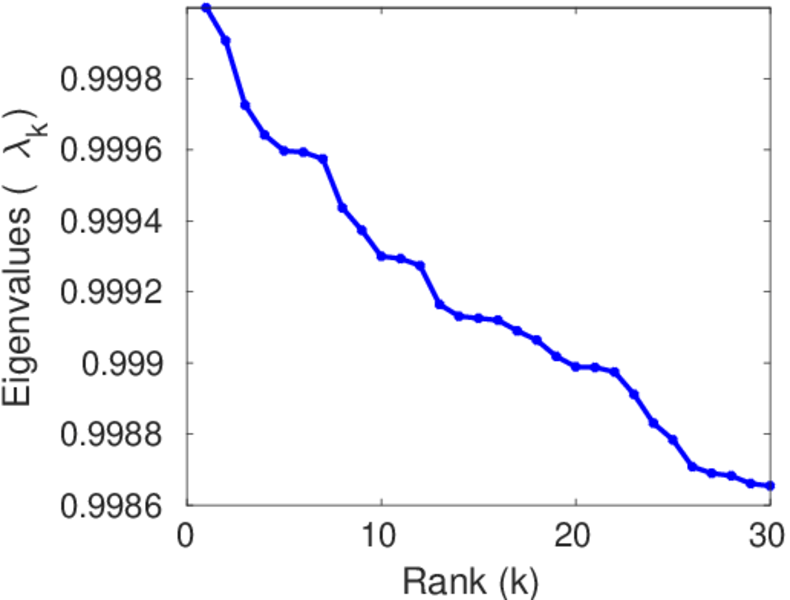
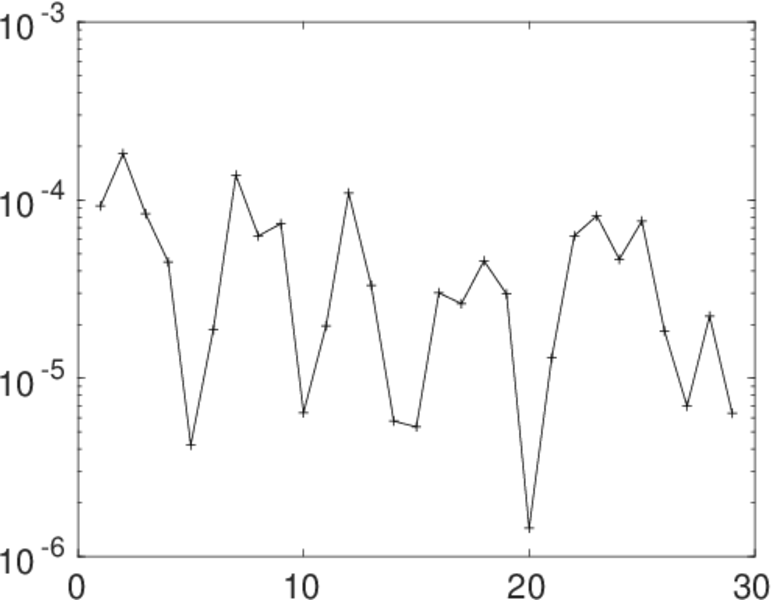
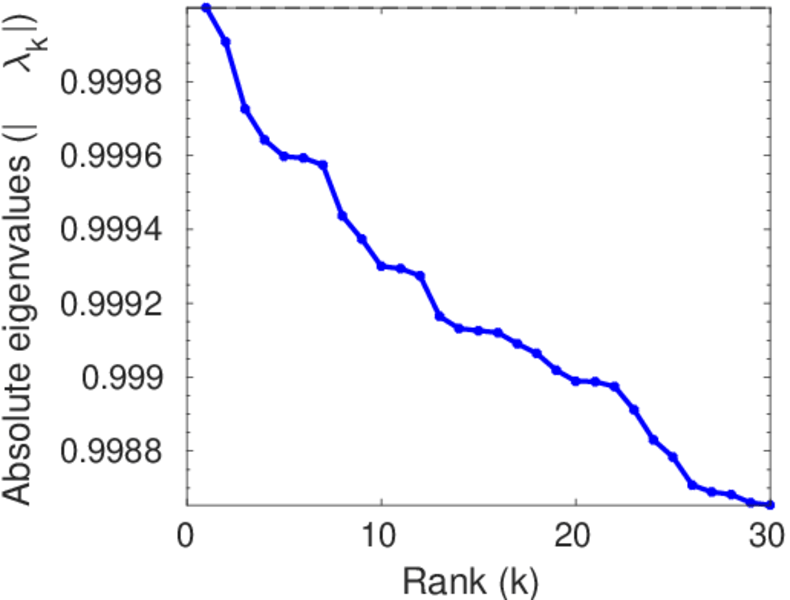
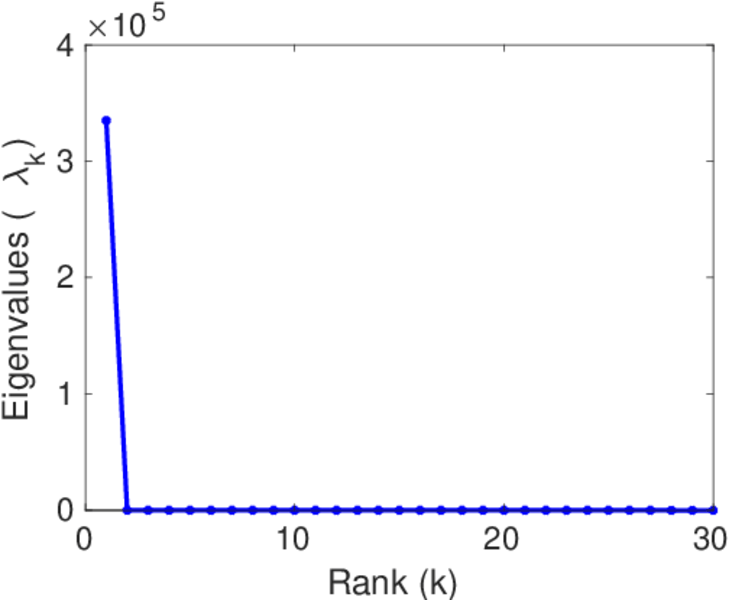
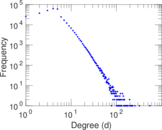
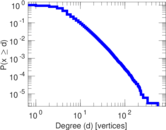
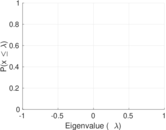
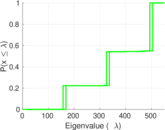
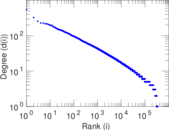
Plots


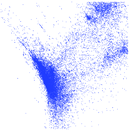


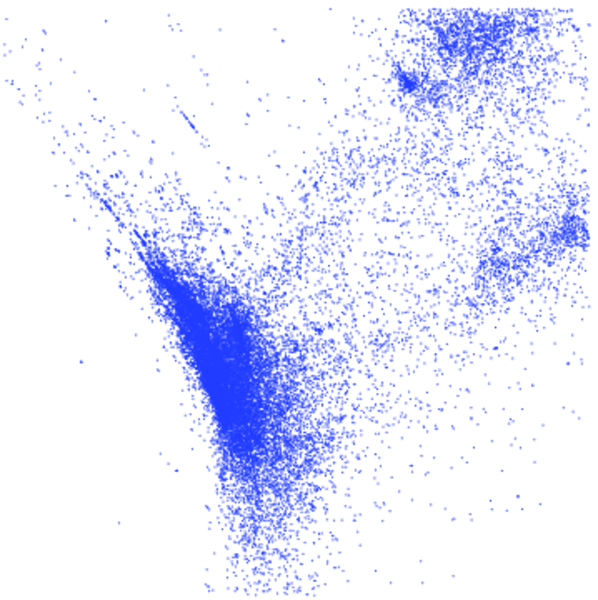
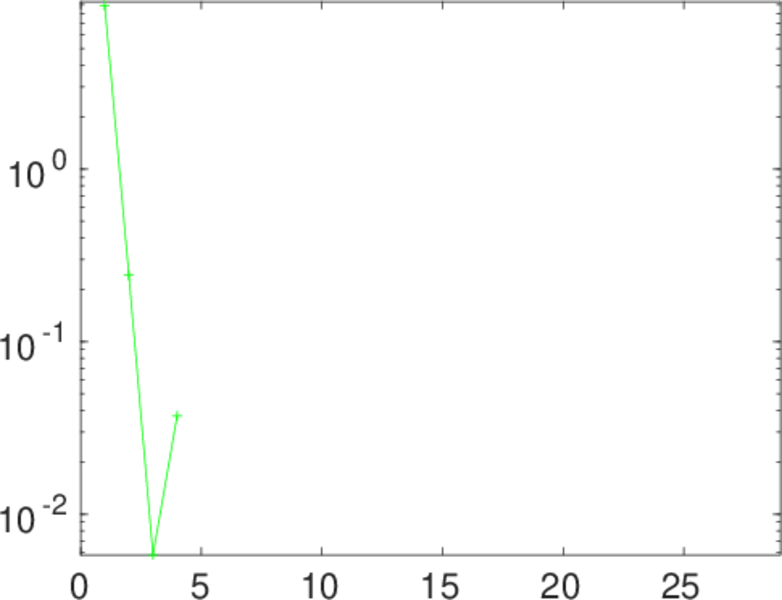
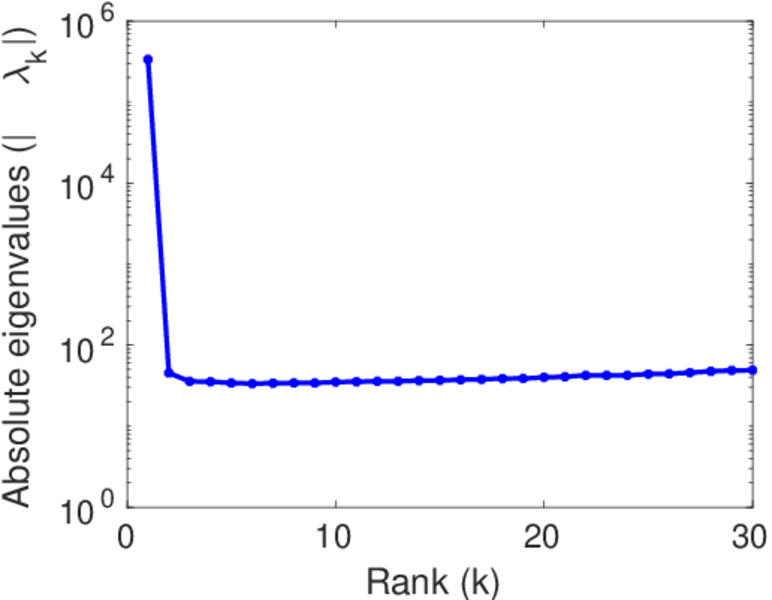
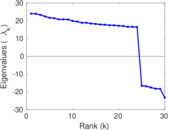
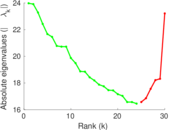
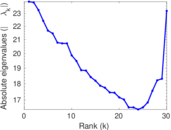
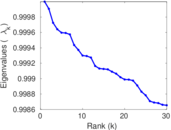
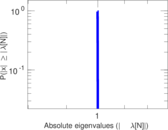
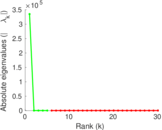
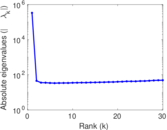
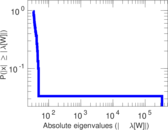
Matrix decompositions plots


Downloads
References
|
[1]
|
Jérôme Kunegis.
KONECT – The Koblenz Network Collection.
In Proc. Int. Conf. on World Wide Web Companion, pages
1343–1350, 2013.
[ http ]
|
|
[2]
|
Jaewon Yang and Jure Leskovec.
Defining and evaluating network communities based on ground-truth.
In Proc. ACM SIGKDD Workshop on Min. Data Semant., page 3,
2012.
|
 KONECT ‣ Networks ‣
Buy Me a Coffee
KONECT ‣ Networks ‣
Buy Me a Coffee