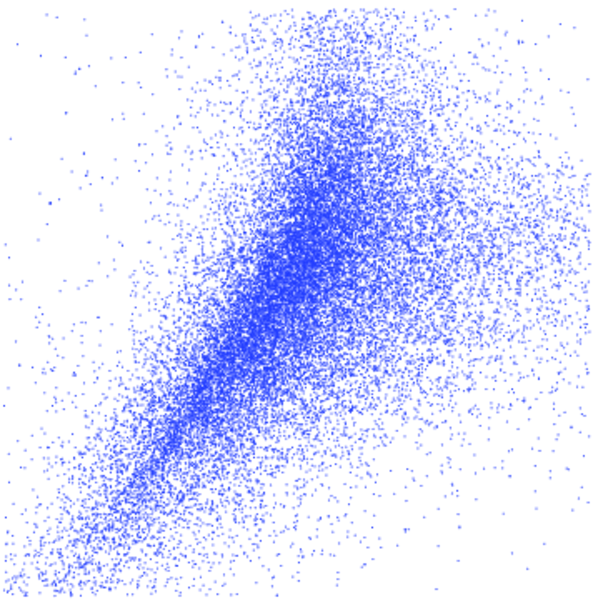
DBLP co-authorship
This is the co-authorship network of the DBLP computer science bibliography.
Nodes are authors and an undirected edge between two nodes exists if the
corresponding authors have published at least one paper together.
Metadata
Statistics
| Size | n = | 317,080
|
| Volume | m = | 1,049,866
|
| Loop count | l = | 0
|
| Wedge count | s = | 21,780,889
|
| Claw count | z = | 431,568,151
|
| Cross count | x = | 11,548,309,777
|
| Triangle count | t = | 2,224,385
|
| Square count | q = | 55,107,655
|
| 4-Tour count | T4 = | 530,084,528
|
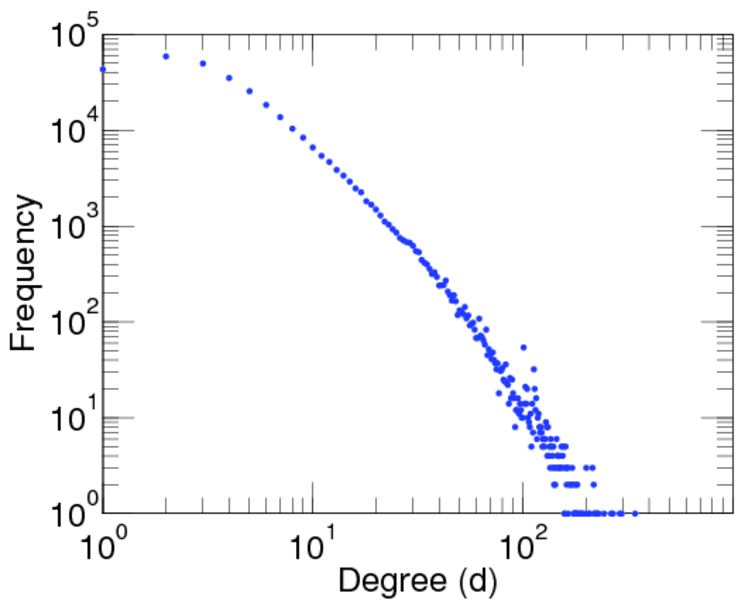
| Maximum degree | dmax = | 343
|
| Average degree | d = | 6.622 09
|
| Fill | p = | 2.088 47 × 10−5
|
| Size of LCC | N = | 317,080
|
| Diameter | δ = | 23
|
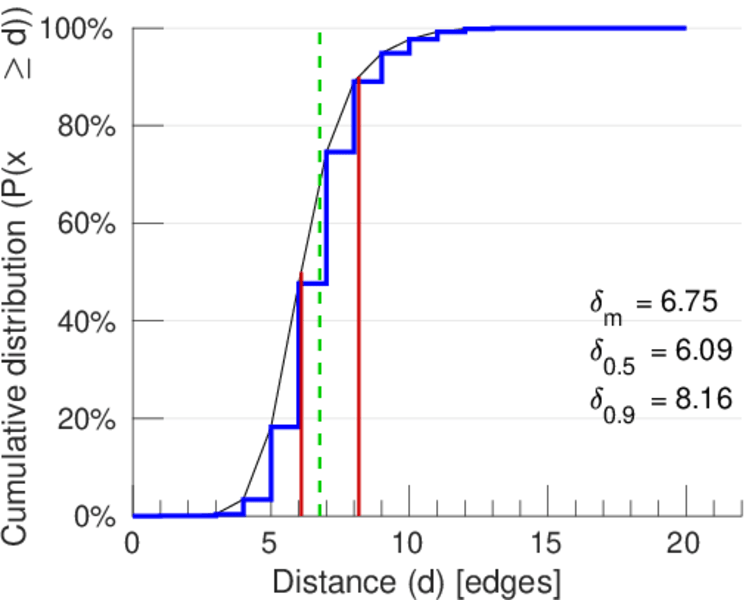
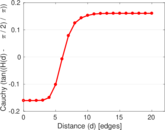
| 50-Percentile effective diameter | δ0.5 = | 6.087 33
|
| 90-Percentile effective diameter | δ0.9 = | 8.164 68
|
| Median distance | δM = | 7
|
| Mean distance | δm = | 6.752 76
|
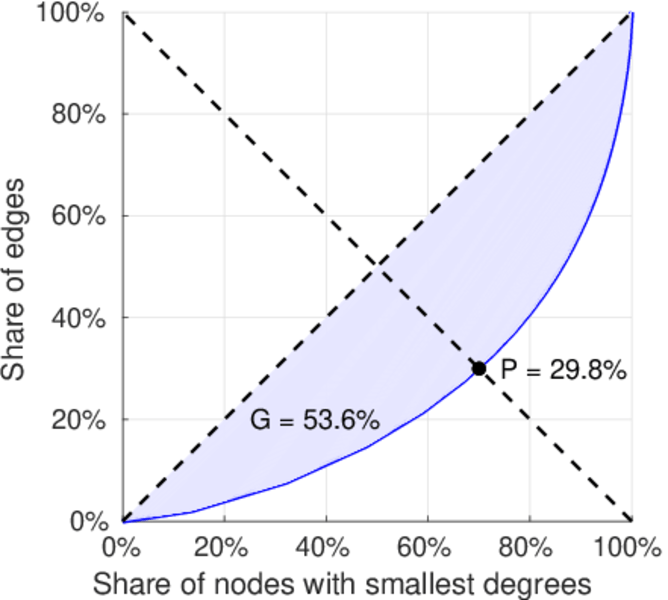
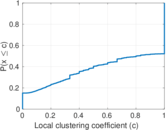
| Gini coefficient | G = | 0.535 780
|
| Balanced inequality ratio | P = | 0.298 185
|
| Relative edge distribution entropy | Her = | 0.955 003
|
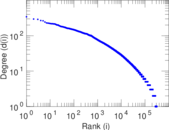
| Power law exponent | γ = | 1.720 01
|
| Tail power law exponent | γt = | 3.261 00
|
| Tail power law exponent with p | γ3 = | 3.261 00
|
| p-value | p = | 0.000 00
|
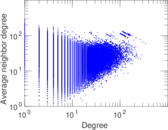
| Degree assortativity | ρ = | +0.266 521
|
| Degree assortativity p-value | pρ = | 0.000 00
|
| Clustering coefficient | c = | 0.306 377
|
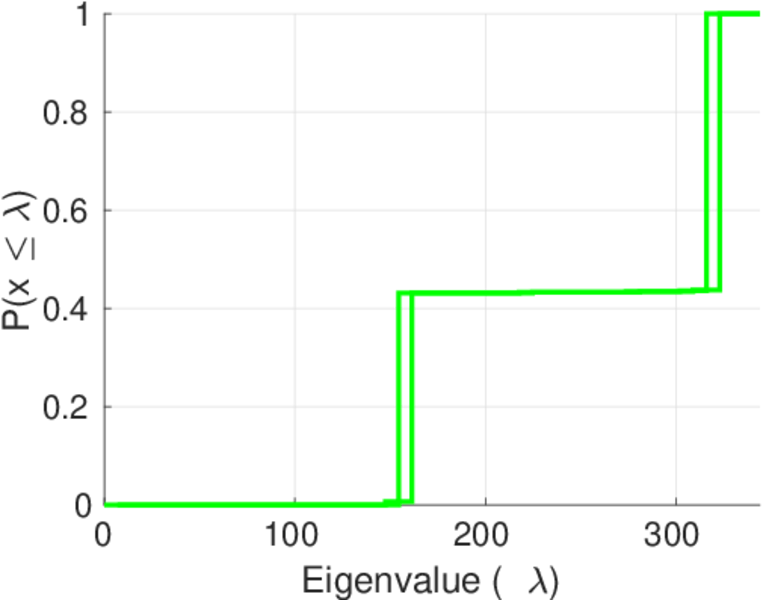
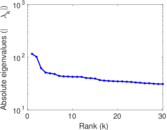
| Spectral norm | α = | 115.847
|
| Algebraic connectivity | a = | 0.012 818 8
|
| Spectral separation | |λ1[A] / λ2[A]| = | 1.138 12
|
| Non-bipartivity | bA = | 0.856 921
|
| Normalized non-bipartivity | bN = | 0.032 705 7
|
| Algebraic non-bipartivity | χ = | 0.057 626 3
|
| Spectral bipartite frustration | bK = | 0.002 175 53
|
| Controllability | C = | 42,882
|
| Relative controllability | Cr = | 0.135 240
|
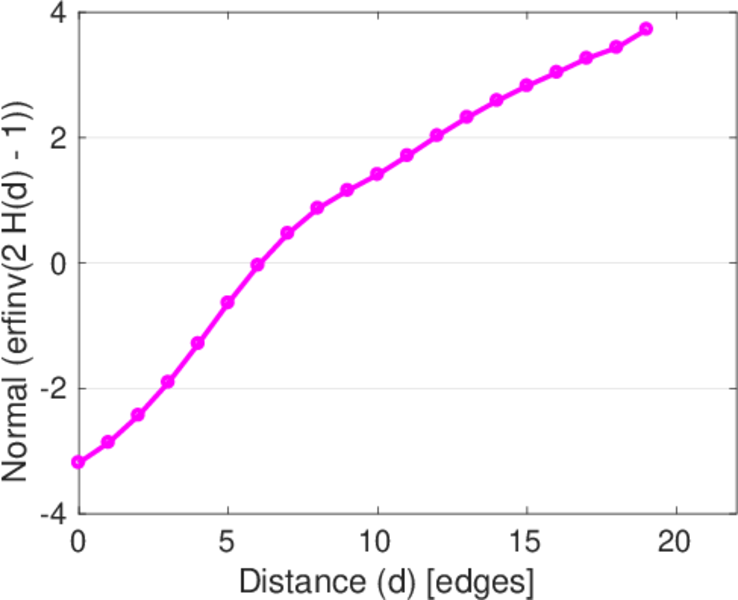
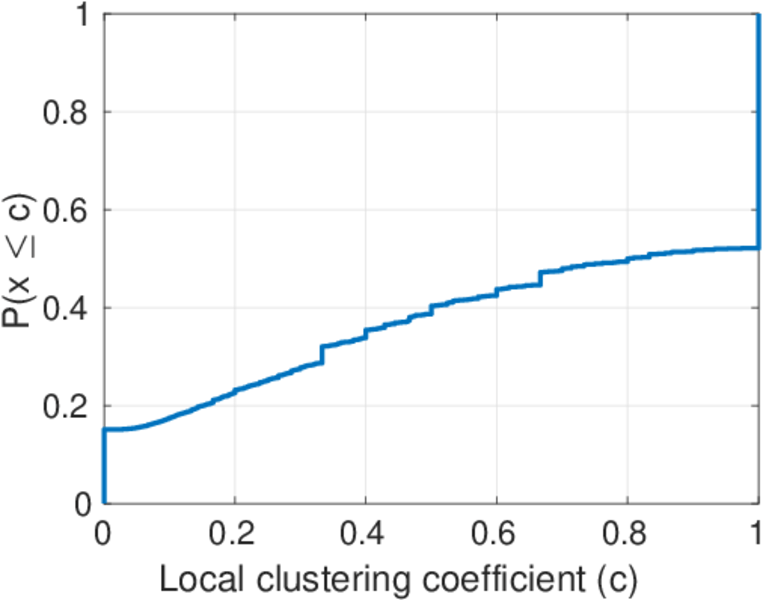
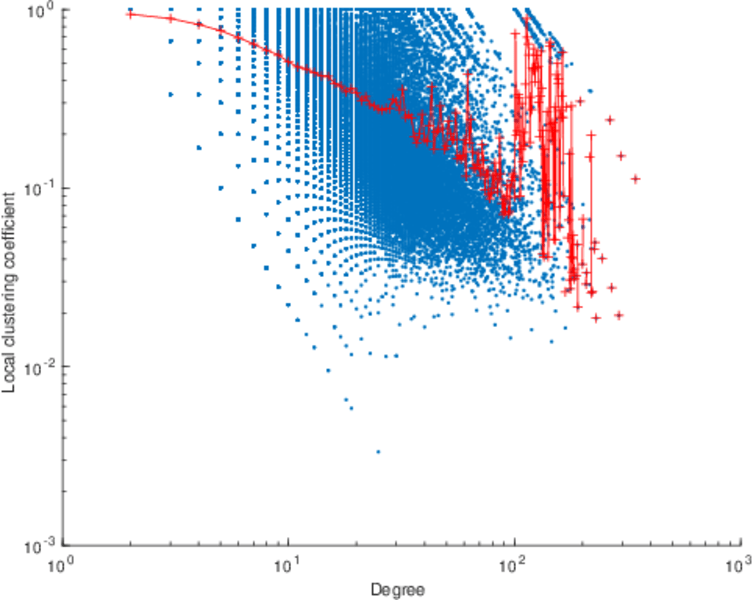
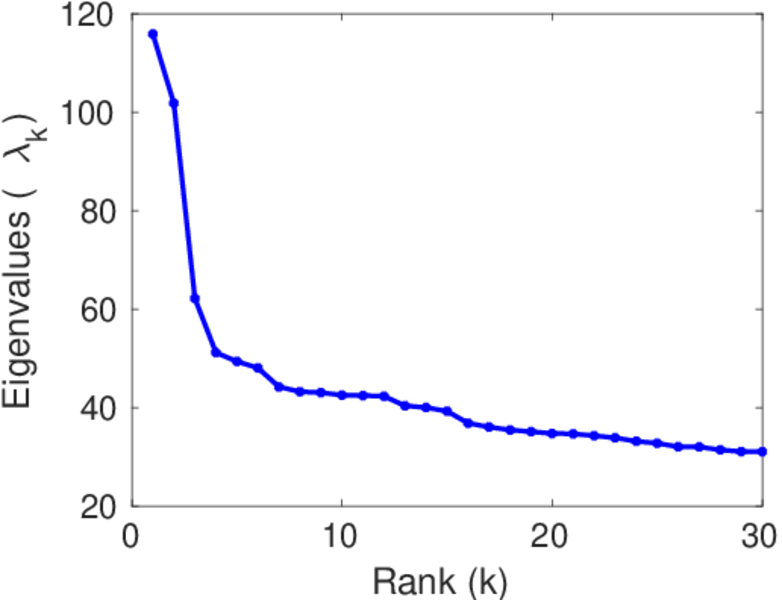
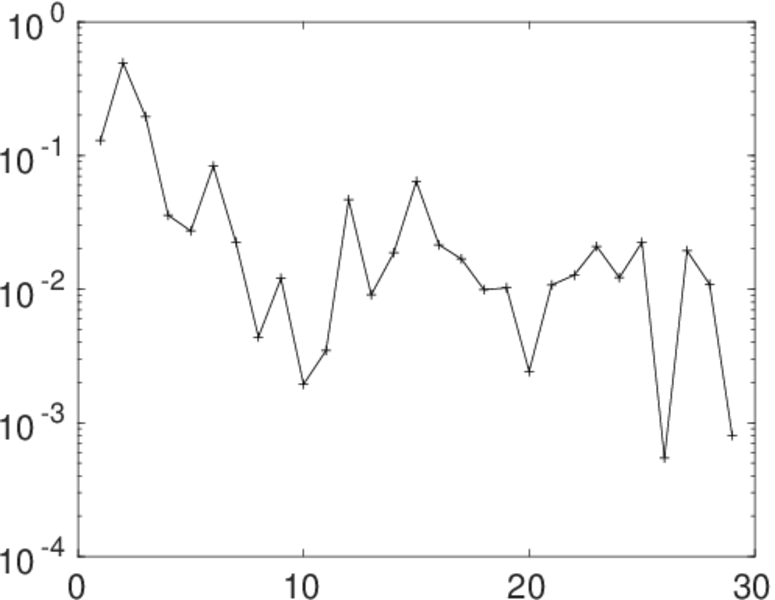
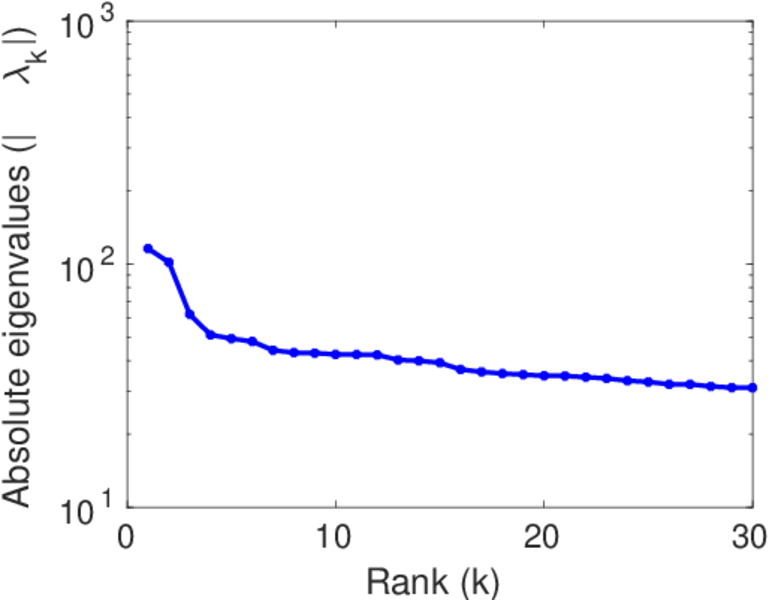
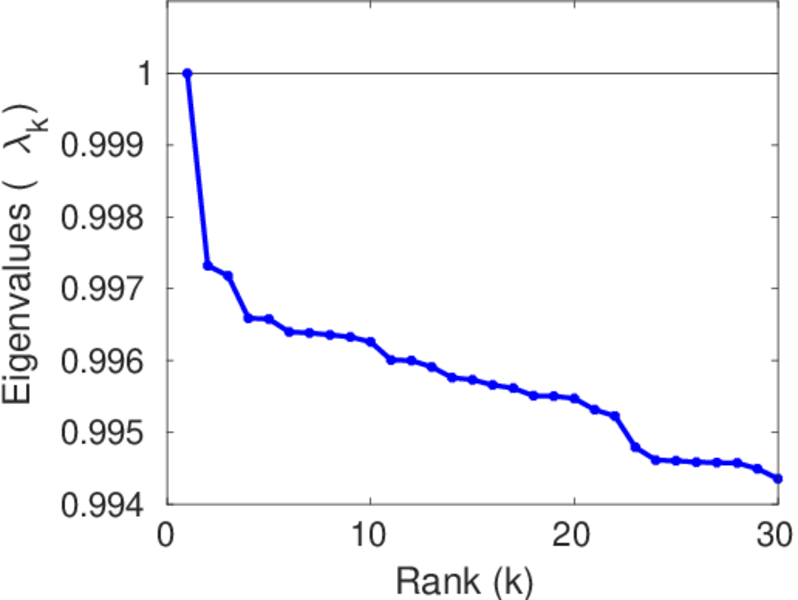
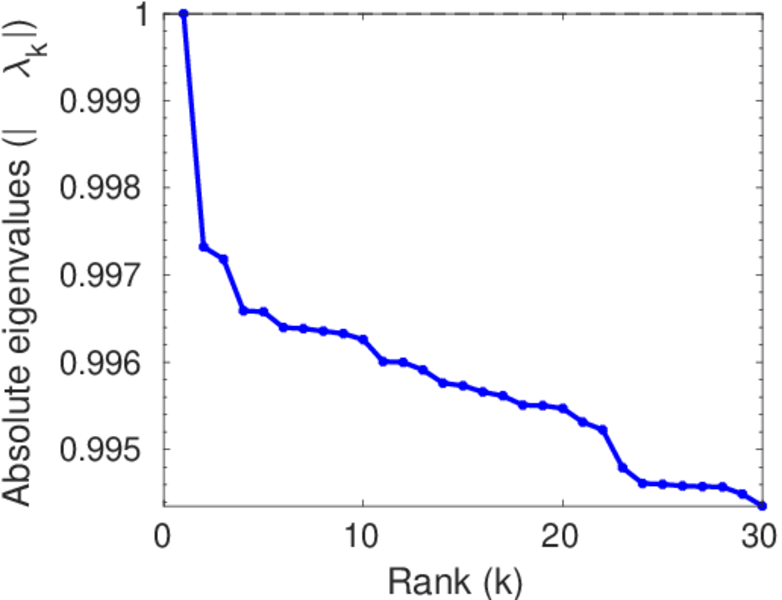
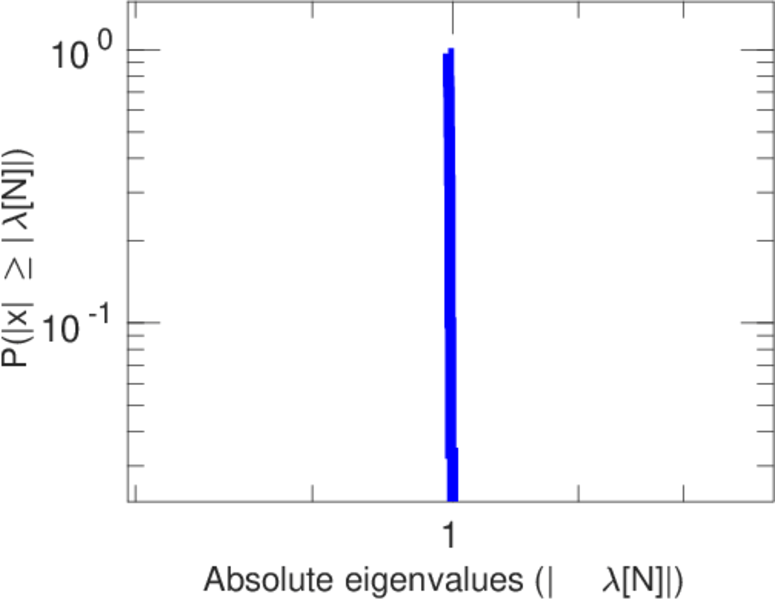
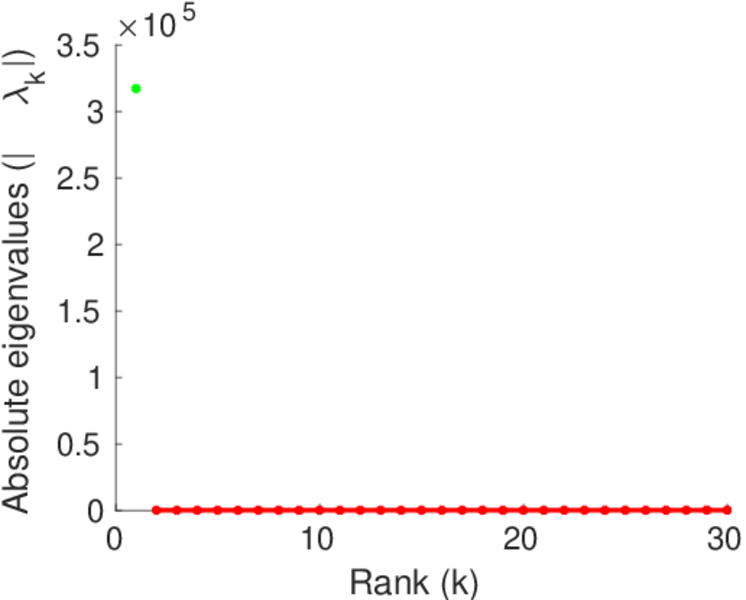
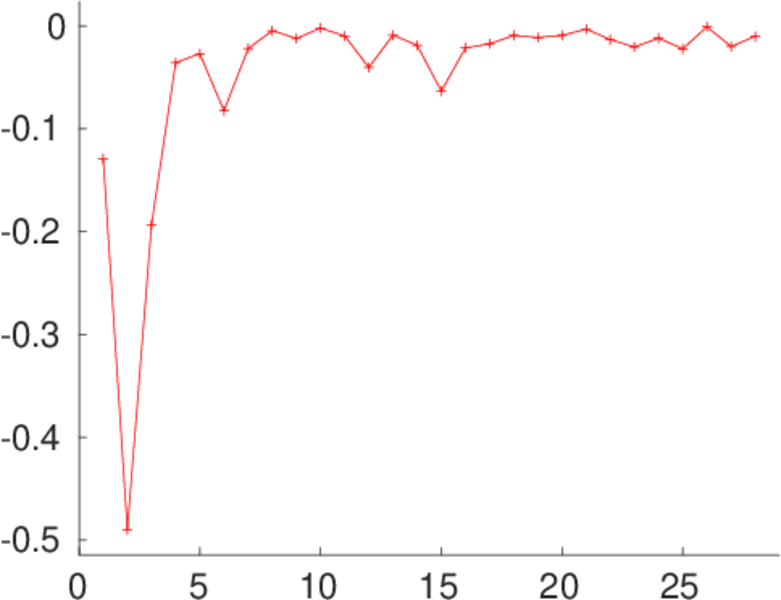
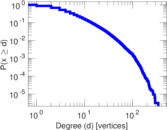
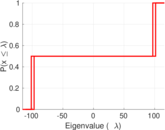
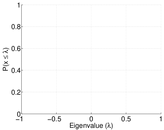
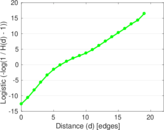
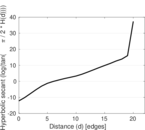
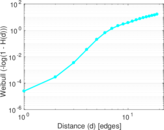
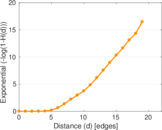
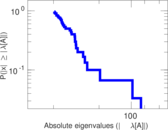
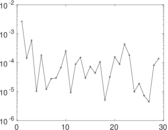
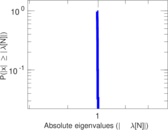
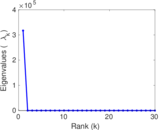
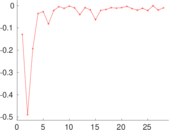
Plots


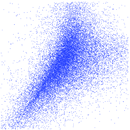


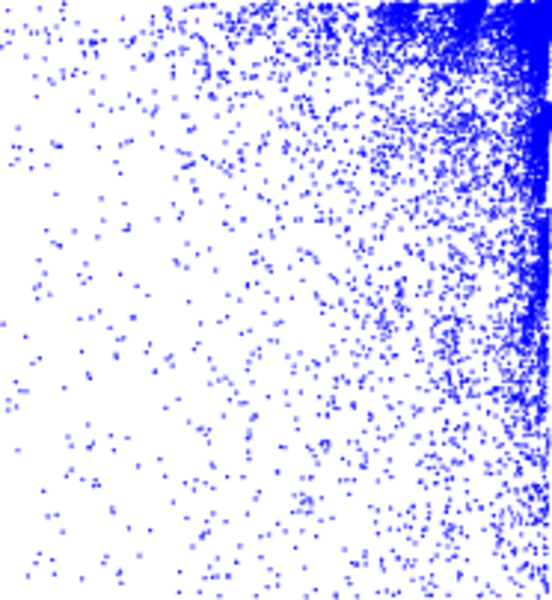
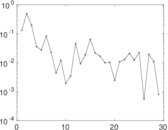
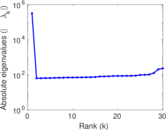
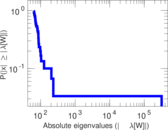
Matrix decompositions plots


Downloads
References
|
[1]
|
Jérôme Kunegis.
KONECT – The Koblenz Network Collection.
In Proc. Int. Conf. on World Wide Web Companion, pages
1343–1350, 2013.
[ http ]
|
|
[2]
|
Jaewon Yang and Jure Leskovec.
Defining and evaluating network communities based on ground-truth.
In Proc. ACM SIGKDD Workshop on Min. Data Semant., page 3,
2012.
|
 KONECT ‣ Networks ‣
Buy Me a Coffee
KONECT ‣ Networks ‣
Buy Me a Coffee