Occupations
This is the bipartite occupation network of DBpedia. It contains persons and
occupations as nodes, and an edge denotes that a person has an occupation. The
edges correspond to the <http://dbpedia.org/ontology/occupation>
relationships in DBpedia.
Metadata
Statistics
| Size | n = | 229,307
|
| Left size | n1 = | 127,577
|
| Right size | n2 = | 101,730
|
| Volume | m = | 250,945
|
| Wedge count | s = | 335,154,441
|
| Claw count | z = | 1,306,969,930,352
|
| Cross count | x = | 4,967,920,242,807,365
|
| Square count | q = | 24,509,245
|
| 4-Tour count | T4 = | 1,537,212,834
|
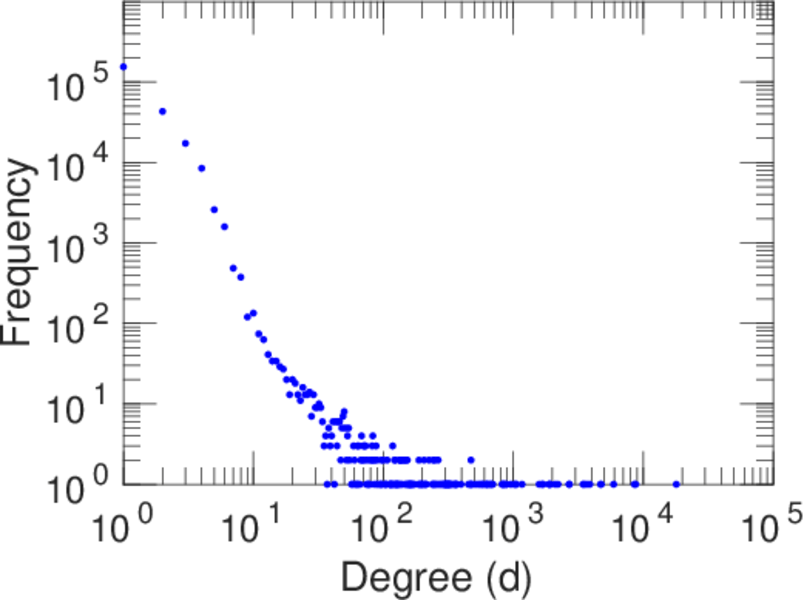
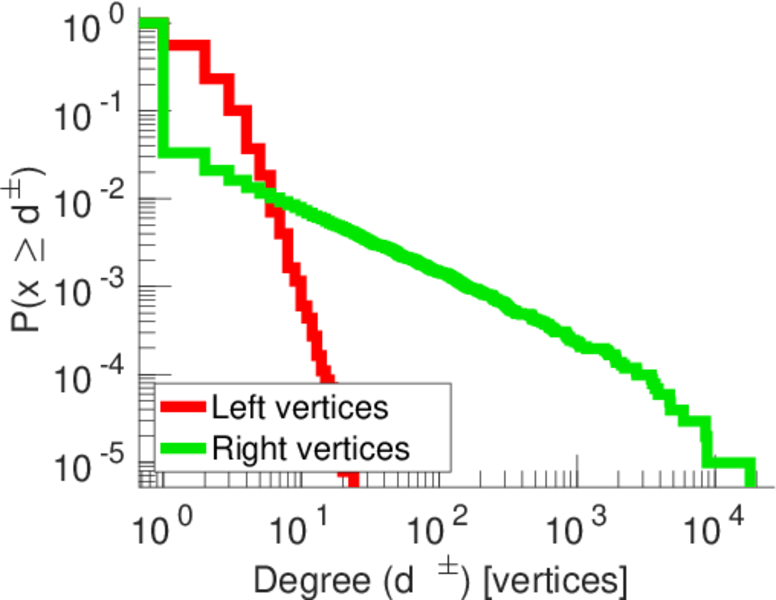
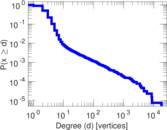
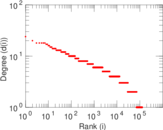
| Maximum degree | dmax = | 17,997
|
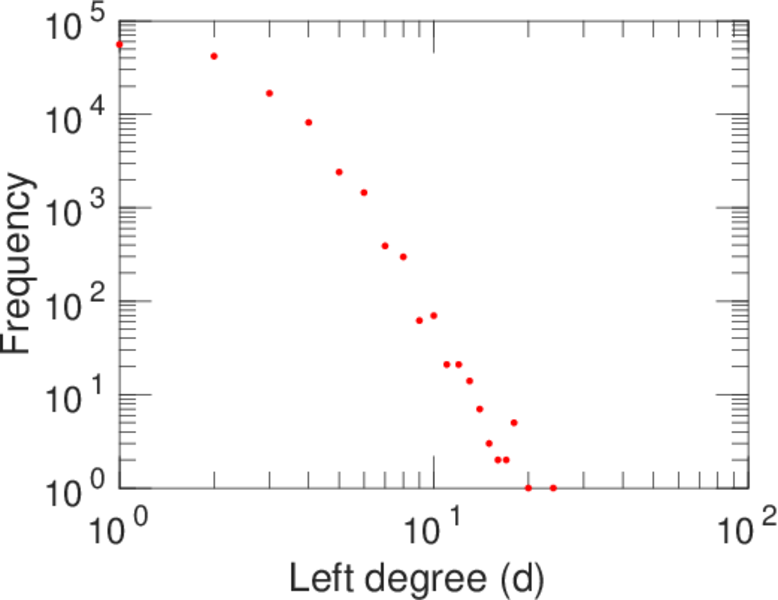
| Maximum left degree | d1max = | 24
|
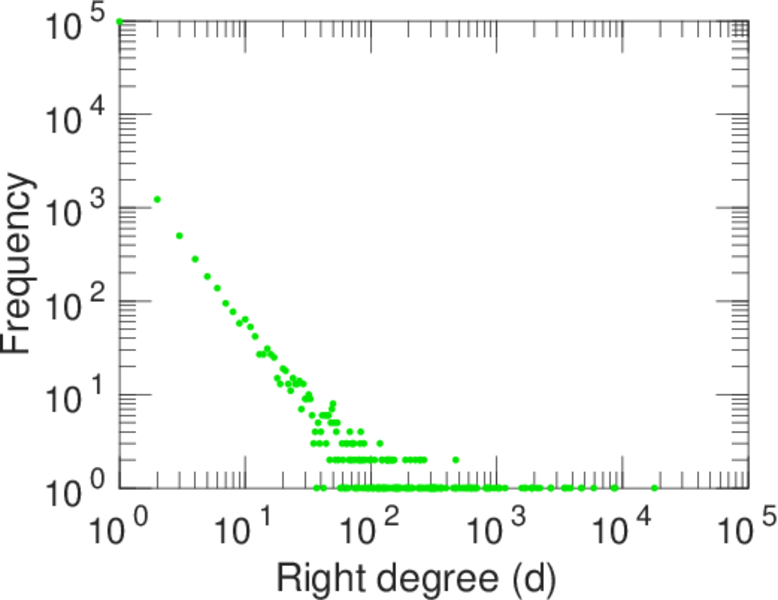
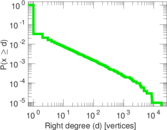
| Maximum right degree | d2max = | 17,997
|
| Average degree | d = | 2.188 73
|
| Average left degree | d1 = | 1.967 01
|
| Average right degree | d2 = | 2.466 77
|
| Fill | p = | 1.933 56 × 10−5
|
| Size of LCC | N = | 143,220
|
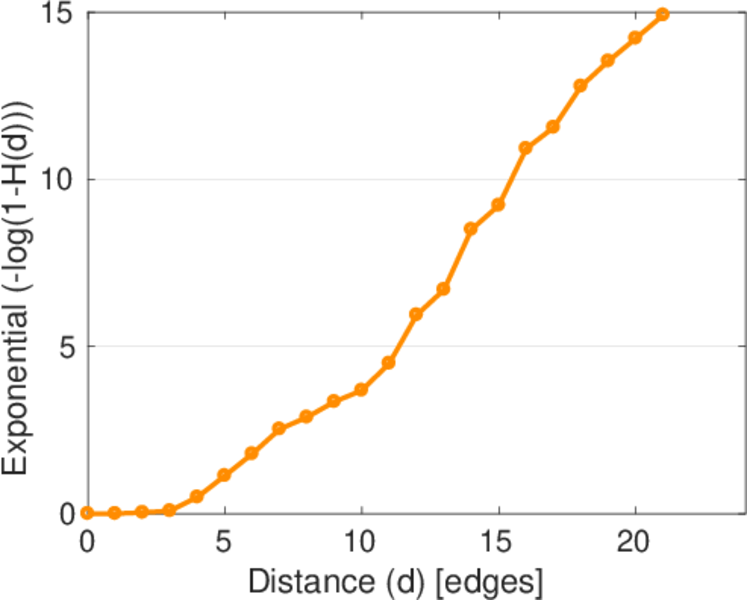
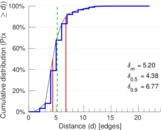
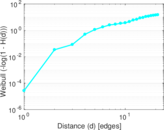
| Diameter | δ = | 24
|
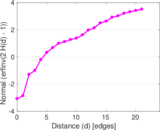
| 50-Percentile effective diameter | δ0.5 = | 4.383 41
|
| 90-Percentile effective diameter | δ0.9 = | 6.770 30
|
| Median distance | δM = | 5
|
| Mean distance | δm = | 5.198 51
|
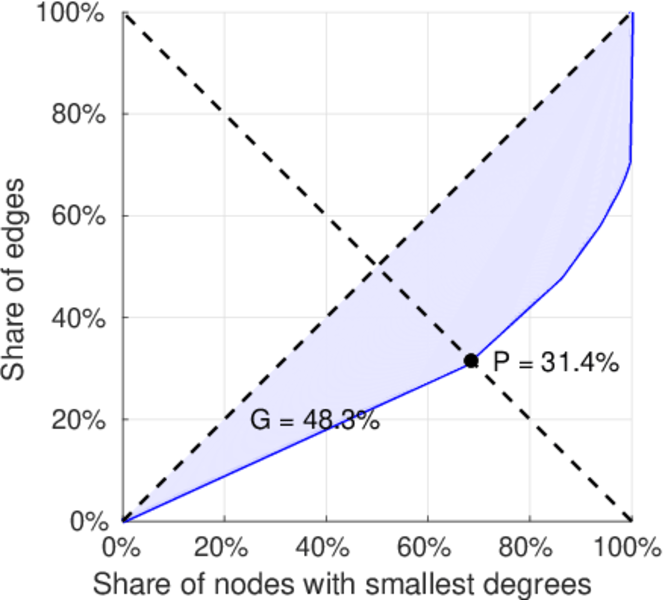
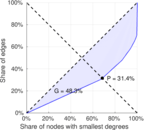
| Gini coefficient | G = | 0.454 552
|
| Balanced inequality ratio | P = | 0.347 200
|
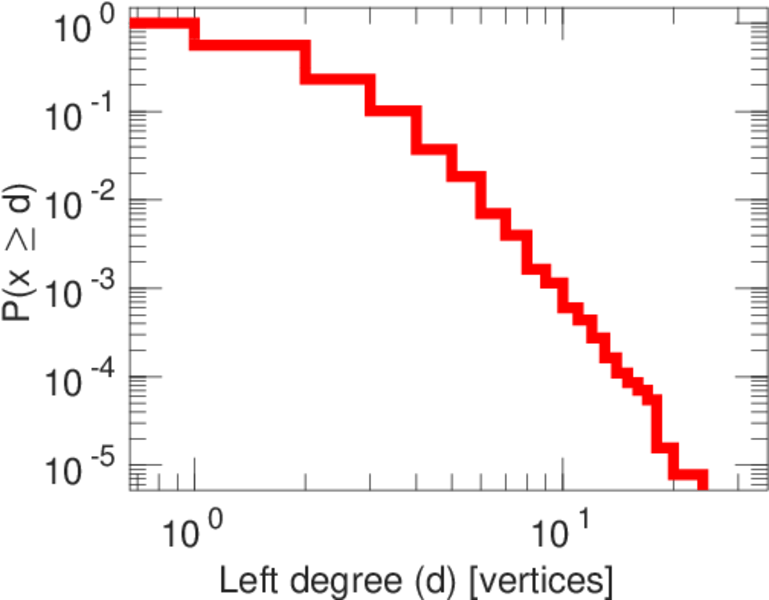
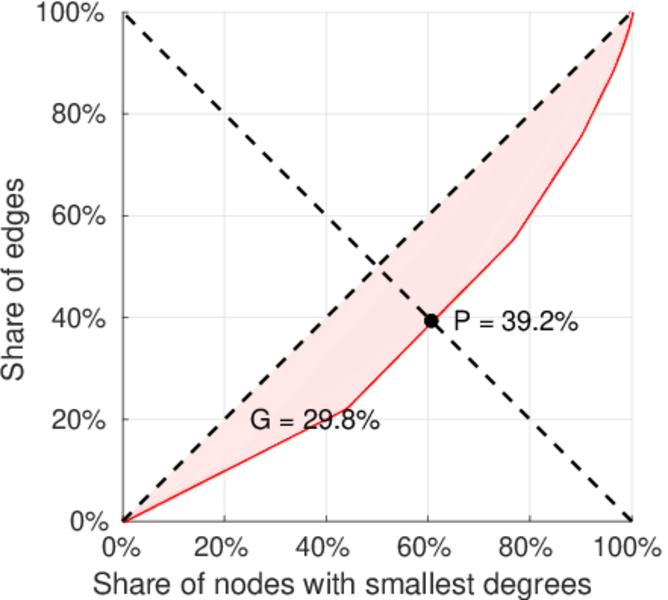
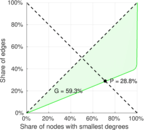
| Left balanced inequality ratio | P1 = | 0.392 126
|
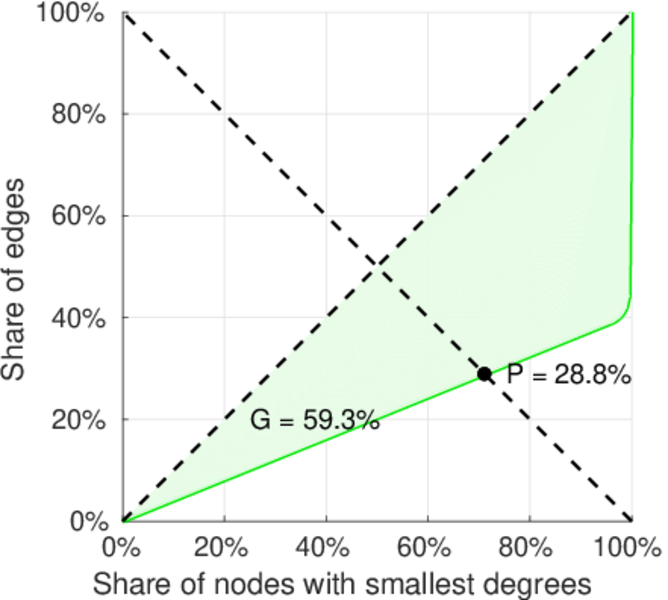
| Right balanced inequality ratio | P2 = | 0.287 824
|
| Relative edge distribution entropy | Her = | 0.859 208
|
| Power law exponent | γ = | 4.145 40
|
| Tail power law exponent | γt = | 1.761 00
|
| Tail power law exponent with p | γ3 = | 1.761 00
|
| p-value | p = | 0.638 000
|
| Left tail power law exponent with p | γ3,1 = | 5.161 00
|
| Left p-value | p1 = | 0.000 00
|
| Right tail power law exponent with p | γ3,2 = | 1.731 00
|
| Right p-value | p2 = | 0.825 000
|
| Degree assortativity | ρ = | +0.028 052 2
|
| Degree assortativity p-value | pρ = | 7.149 25 × 10−45
|
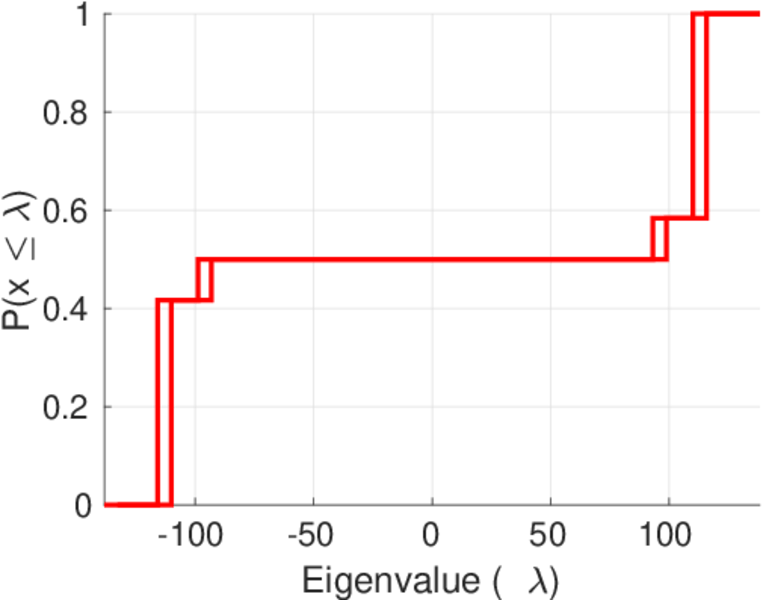
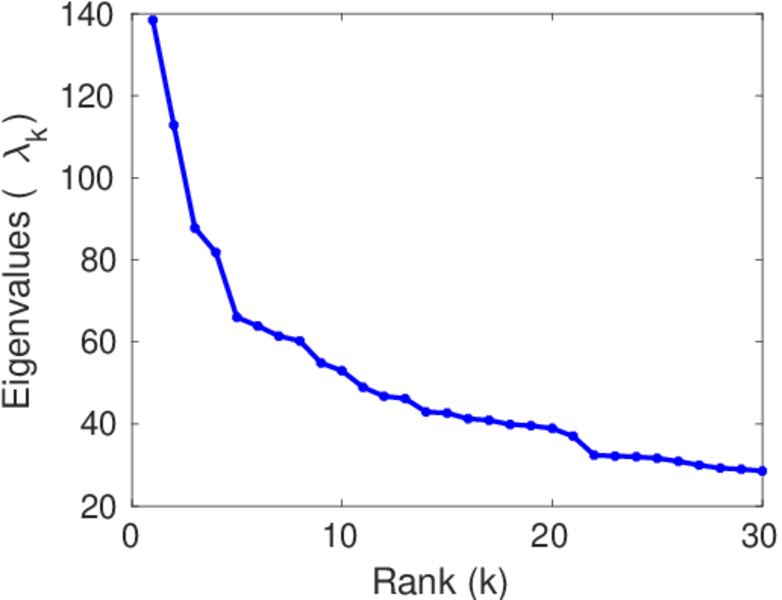
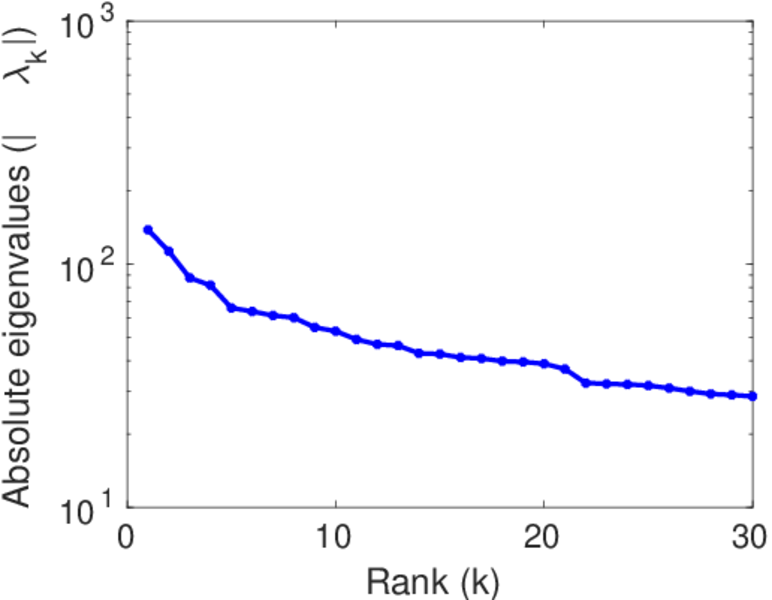
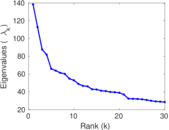
| Spectral norm | α = | 138.395
|
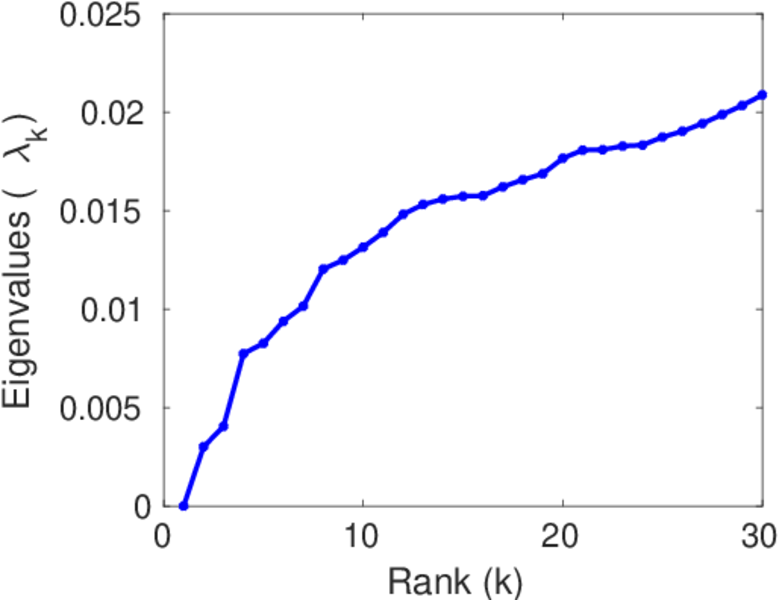
| Algebraic connectivity | a = | 0.003 010 06
|
| Spectral separation | |λ1[A] / λ2[A]| = | 1.226 83
|
| Controllability | C = | 52,600
|
| Relative controllability | Cr = | 0.229 393
|
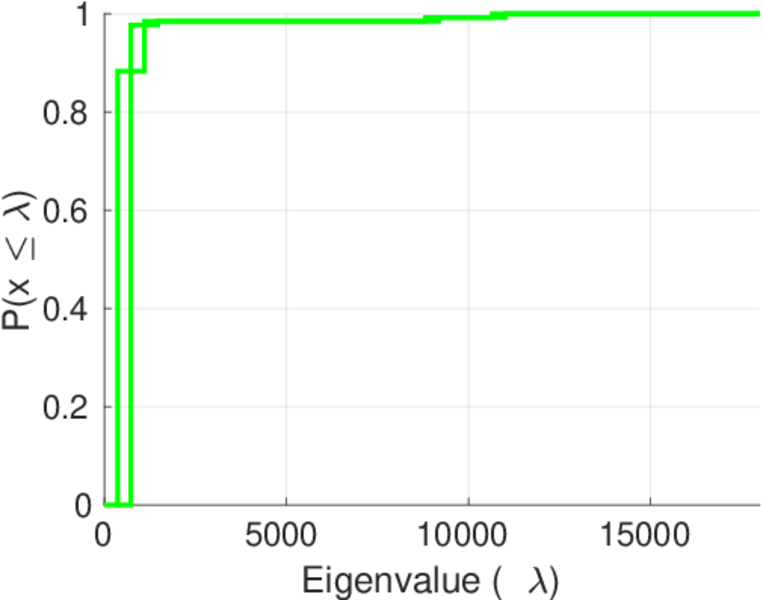
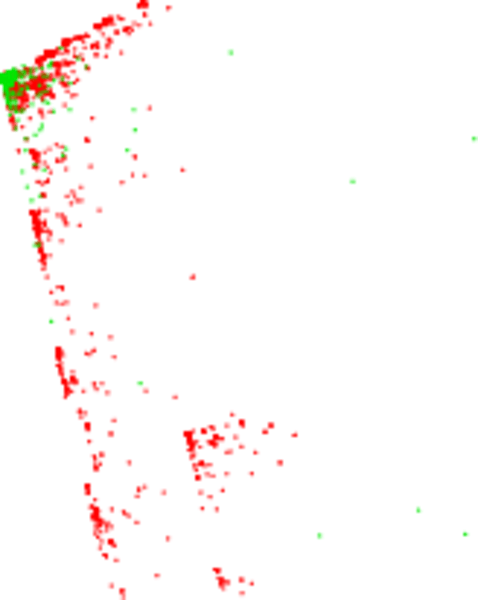
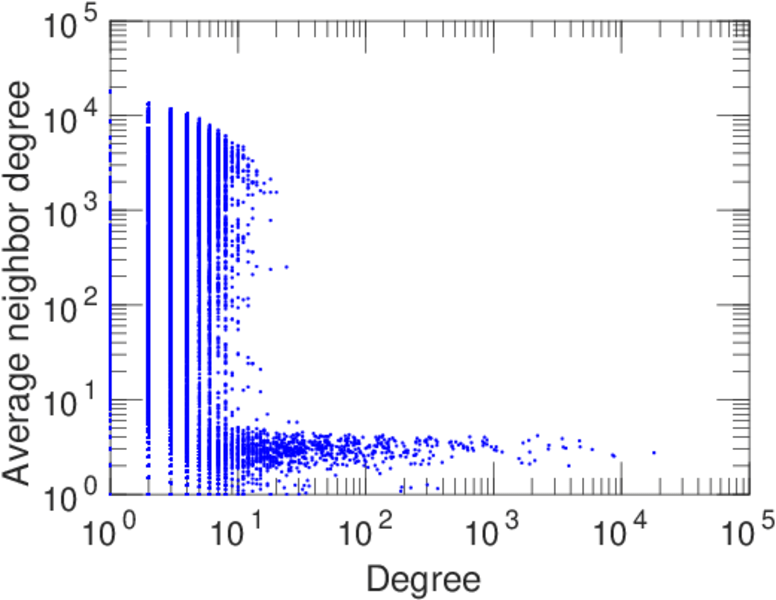
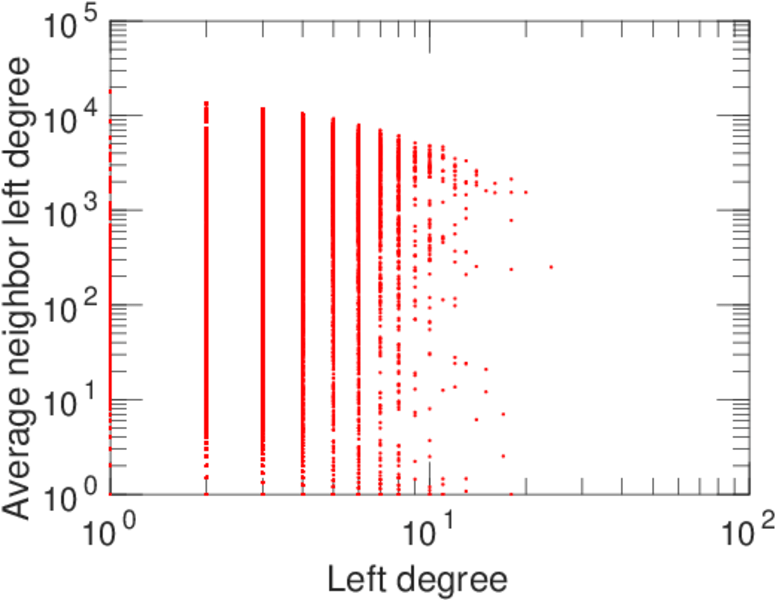
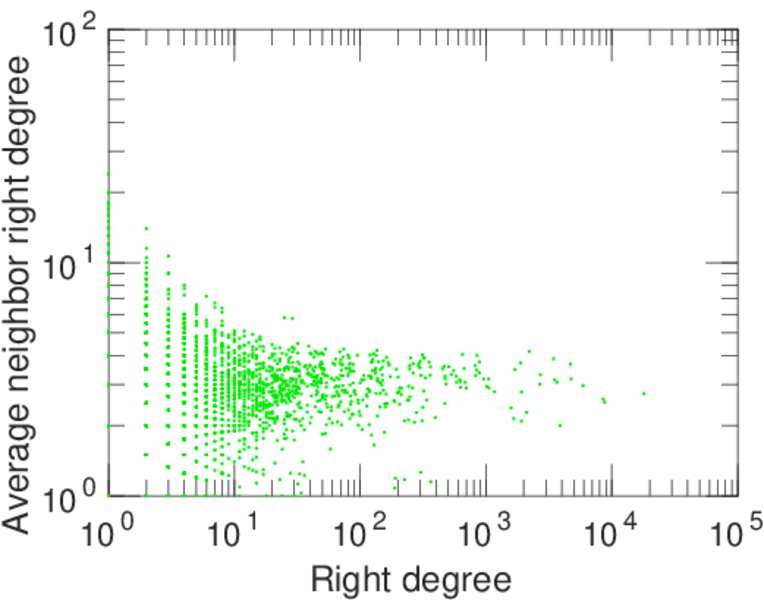
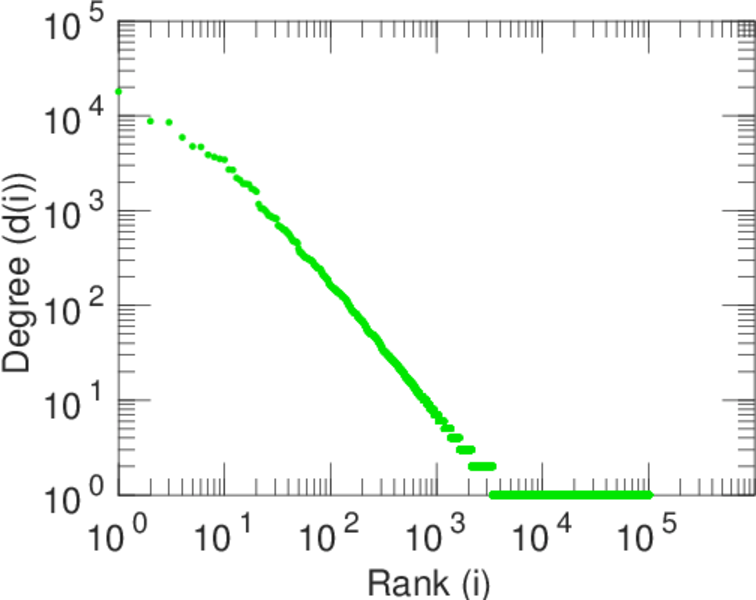
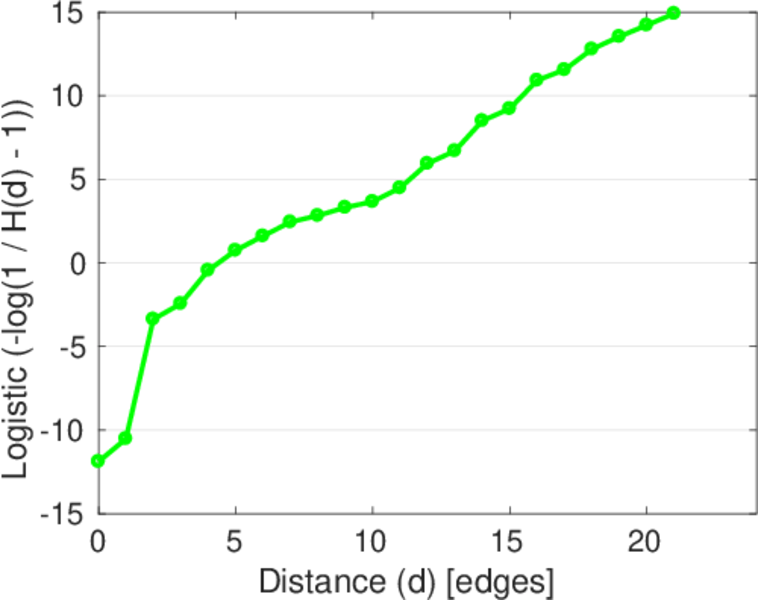
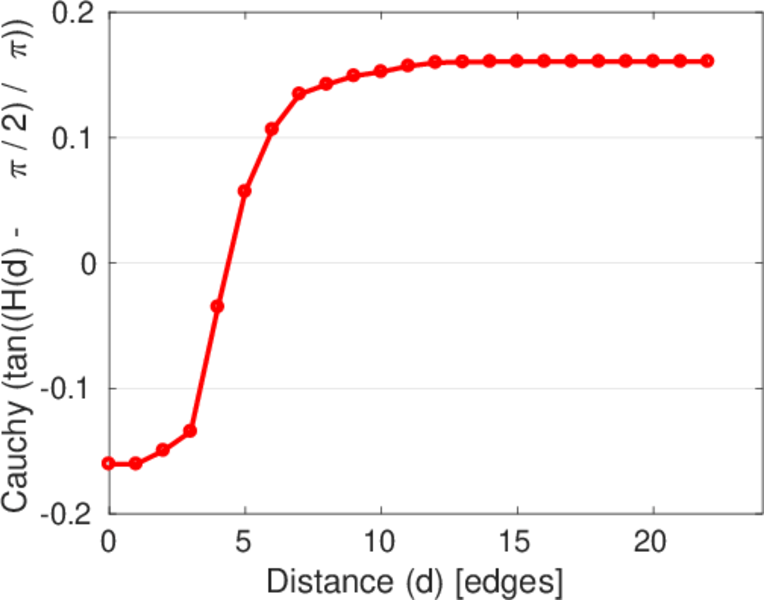
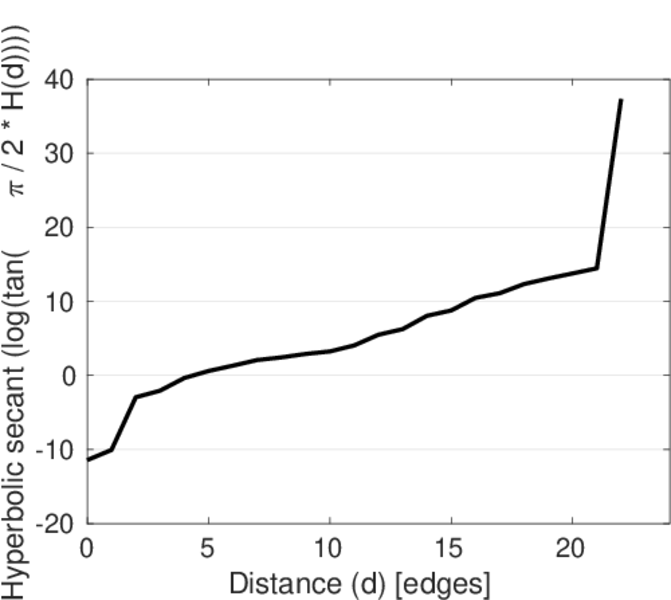
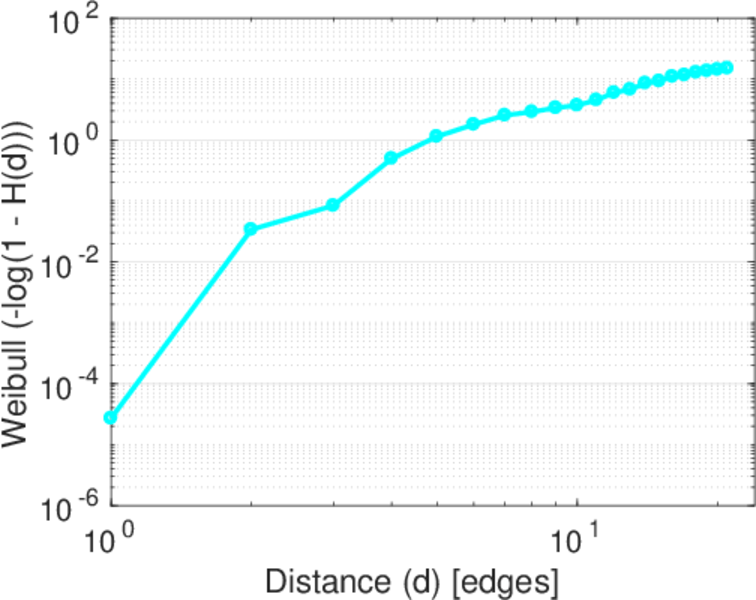
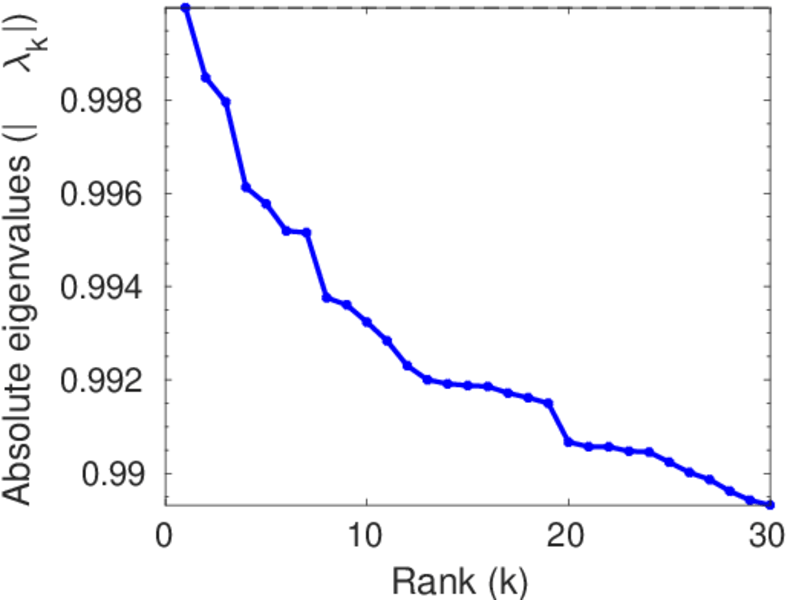
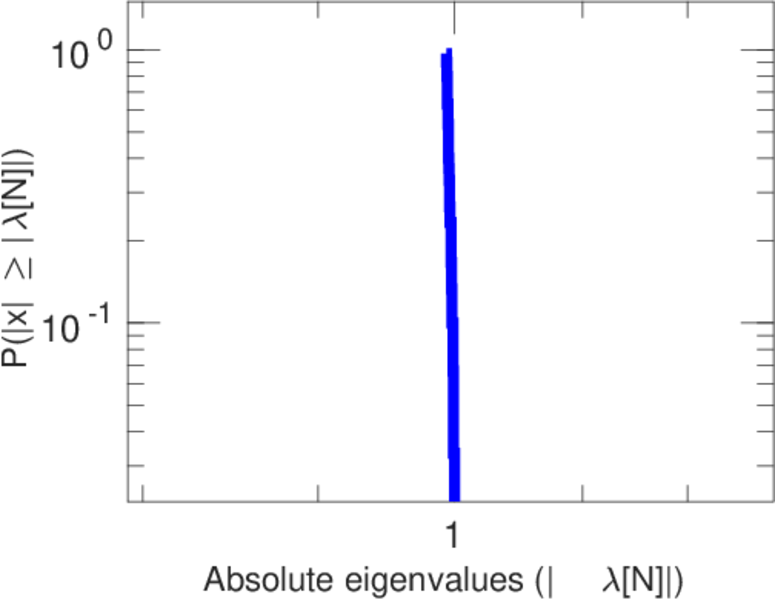
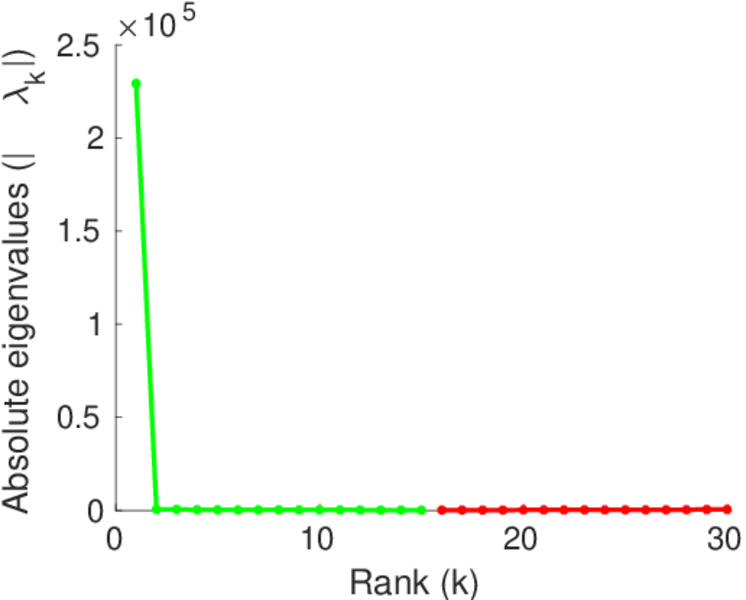
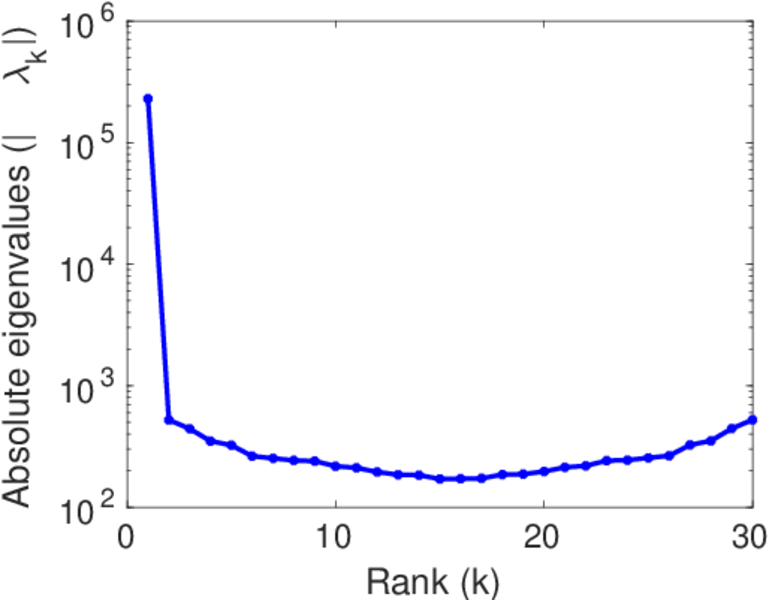
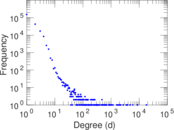
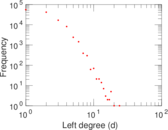
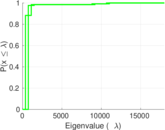
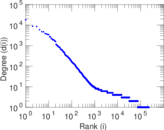
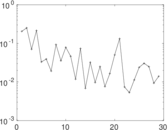
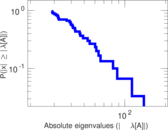
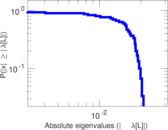
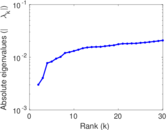
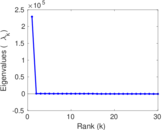
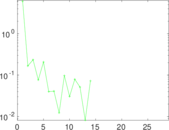
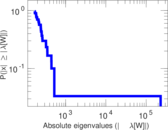
Plots


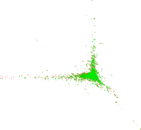


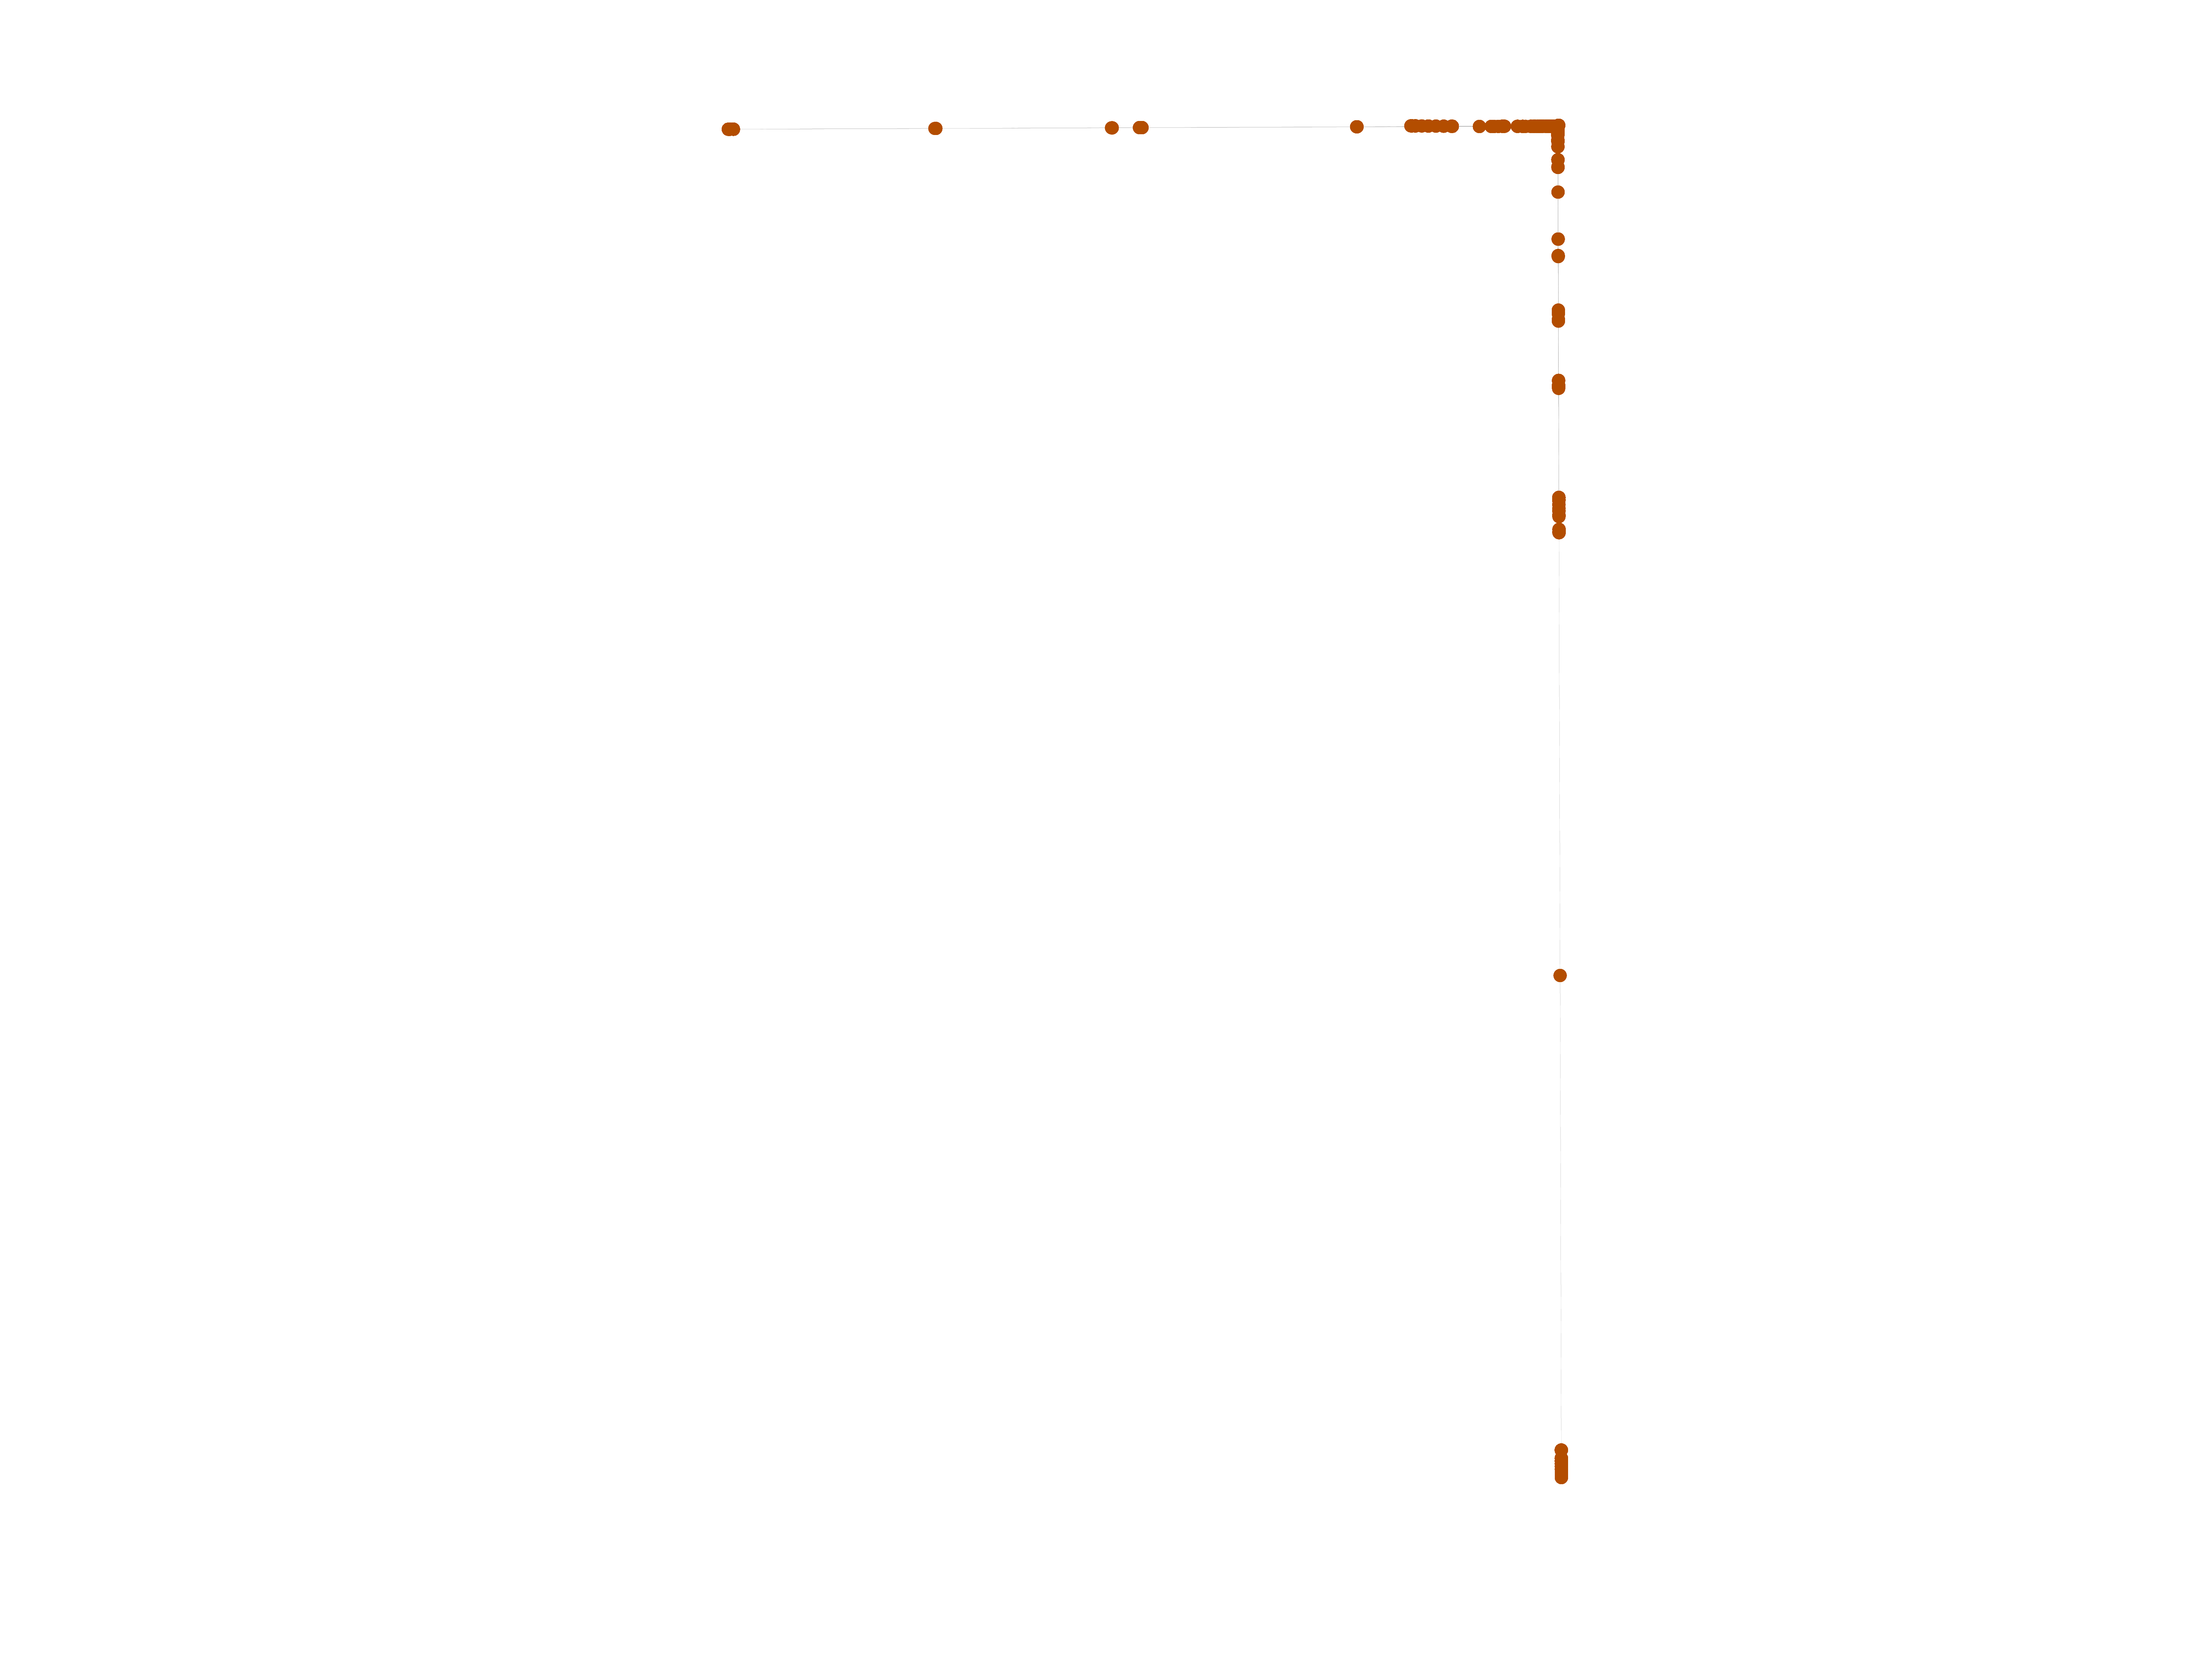
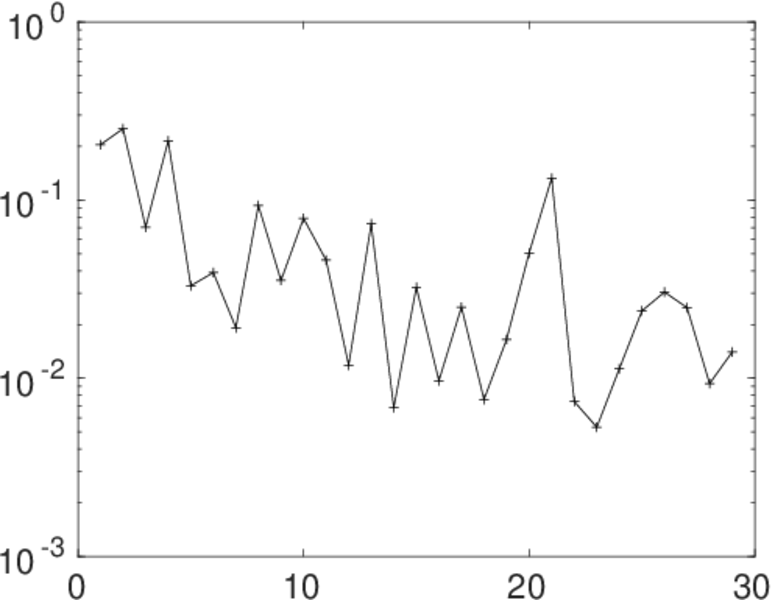
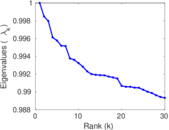
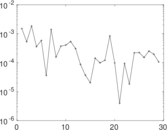
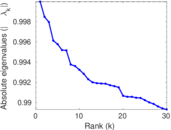
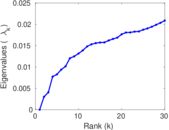
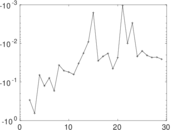
Matrix decompositions plots


Downloads
References
|
[1]
|
Jérôme Kunegis.
KONECT – The Koblenz Network Collection.
In Proc. Int. Conf. on World Wide Web Companion, pages
1343–1350, 2013.
[ http ]
|
|
[2]
|
Sören Auer, Christian Bizer, Georgi Kobilarov, Jens Lehmann, Richard Cyganiak,
and Zachary Ives.
DBpedia: A nucleus for a web of open data.
In Proc. Int. Semant. Web Conf., pages 722–735, 2008.
|
 KONECT ‣ Networks ‣
Buy Me a Coffee
KONECT ‣ Networks ‣
Buy Me a Coffee