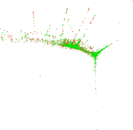
Producers
This is the bipartite producer network of DBpedia. Nodes are producers
(persons) and their works. The edges correspond to the
<http://dbpedia.org/ontology/producer> relationships in DBpedia.
Metadata
Statistics
| Size | n = | 187,677
|
| Left size | n1 = | 48,833
|
| Right size | n2 = | 138,844
|
| Volume | m = | 207,268
|
| Wedge count | s = | 4,461,275
|
| Claw count | z = | 232,308,826
|
| Cross count | x = | 15,720,840,659
|
| Square count | q = | 266,983
|
| 4-Tour count | T4 = | 20,396,460
|
| Maximum degree | dmax = | 512
|
| Maximum left degree | d1max = | 512
|
| Maximum right degree | d2max = | 30
|
| Average degree | d = | 2.208 77
|
| Average left degree | d1 = | 4.244 42
|
| Average right degree | d2 = | 1.492 81
|
| Fill | p = | 3.056 97 × 10−5
|
| Size of LCC | N = | 111,630
|
| Diameter | δ = | 50
|
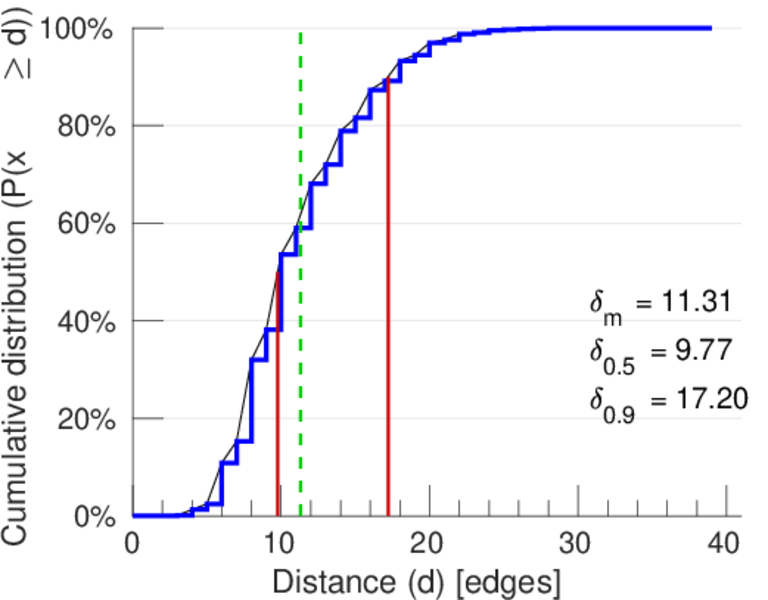
| 50-Percentile effective diameter | δ0.5 = | 9.765 12
|
| 90-Percentile effective diameter | δ0.9 = | 17.200 5
|
| Median distance | δM = | 10
|
| Mean distance | δm = | 11.312 9
|
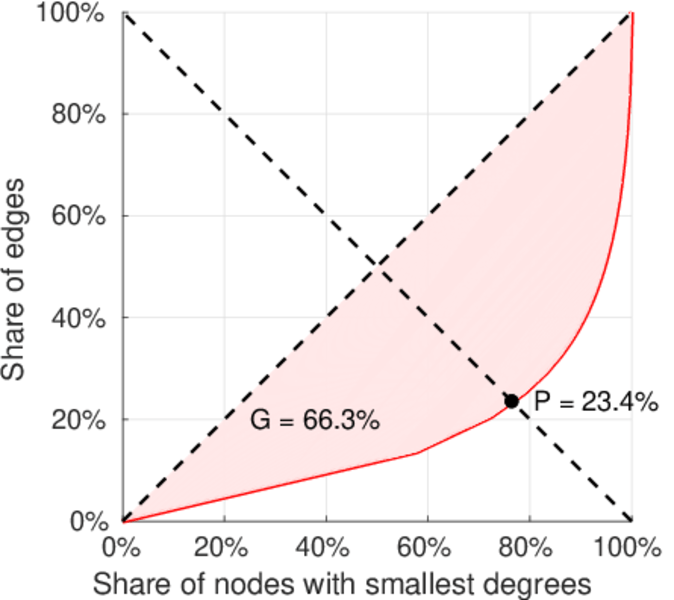
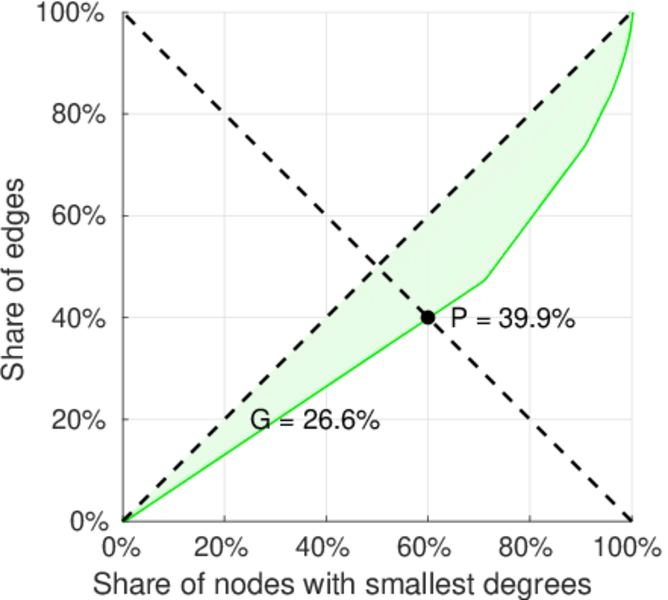
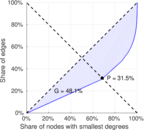
| Gini coefficient | G = | 0.528 377
|
| Balanced inequality ratio | P = | 0.302 203
|
| Left balanced inequality ratio | P1 = | 0.234 194
|
| Right balanced inequality ratio | P2 = | 0.398 561
|
| Relative edge distribution entropy | Her = | 0.934 778
|
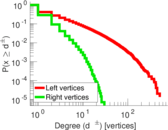
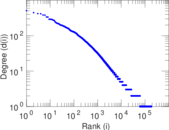
| Power law exponent | γ = | 3.763 92
|
| Tail power law exponent | γt = | 2.271 00
|
| Tail power law exponent with p | γ3 = | 2.271 00
|
| p-value | p = | 0.002 000 00
|
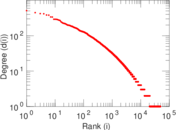
| Left tail power law exponent with p | γ3,1 = | 1.921 00
|
| Left p-value | p1 = | 0.000 00
|
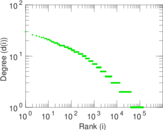
| Right tail power law exponent with p | γ3,2 = | 3.421 00
|
| Right p-value | p2 = | 0.000 00
|
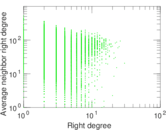
| Degree assortativity | ρ = | +0.026 301 6
|
| Degree assortativity p-value | pρ = | 4.733 68 × 10−33
|
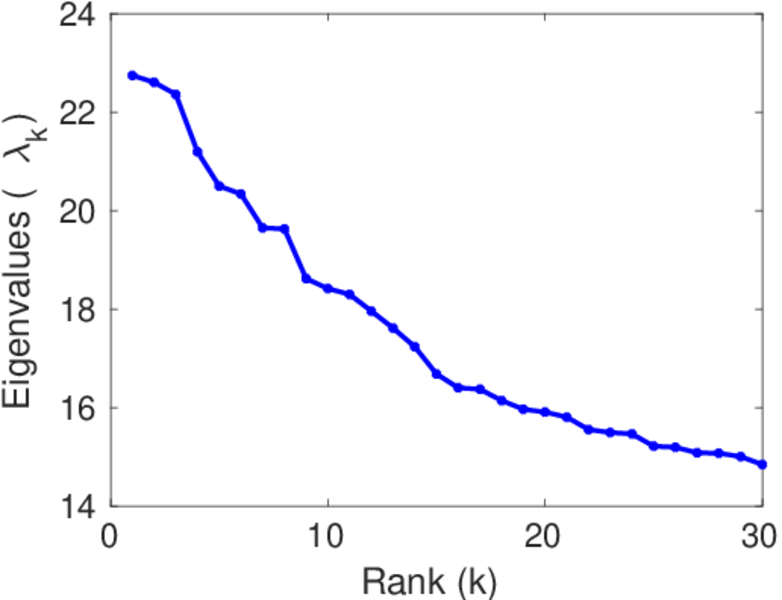
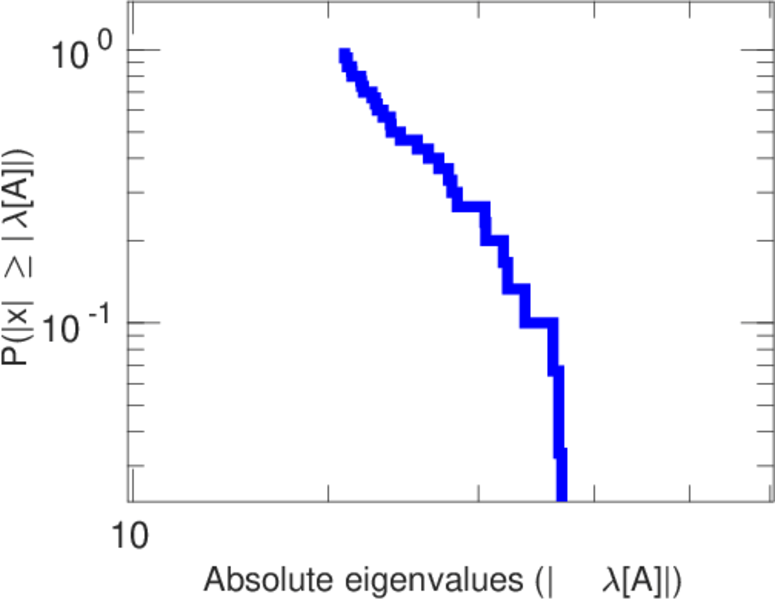
| Spectral norm | α = | 22.743 8
|
| Algebraic connectivity | a = | 0.000 391 262
|
| Spectral separation | |λ1[A] / λ2[A]| = | 1.006 10
|
| Controllability | C = | 102,998
|
| Relative controllability | Cr = | 0.548 819
|
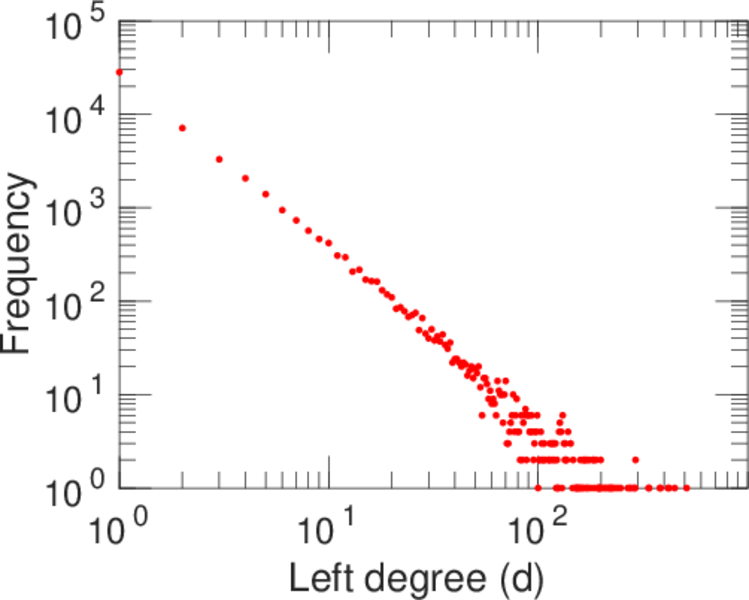
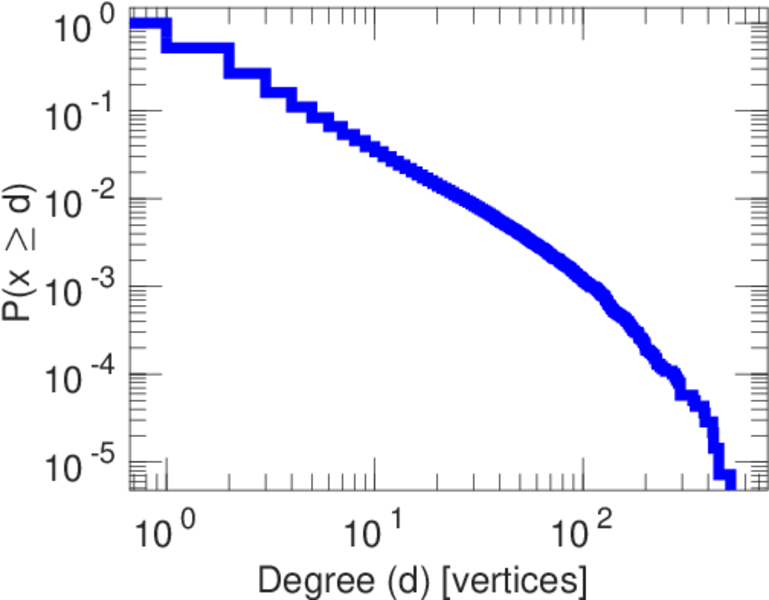
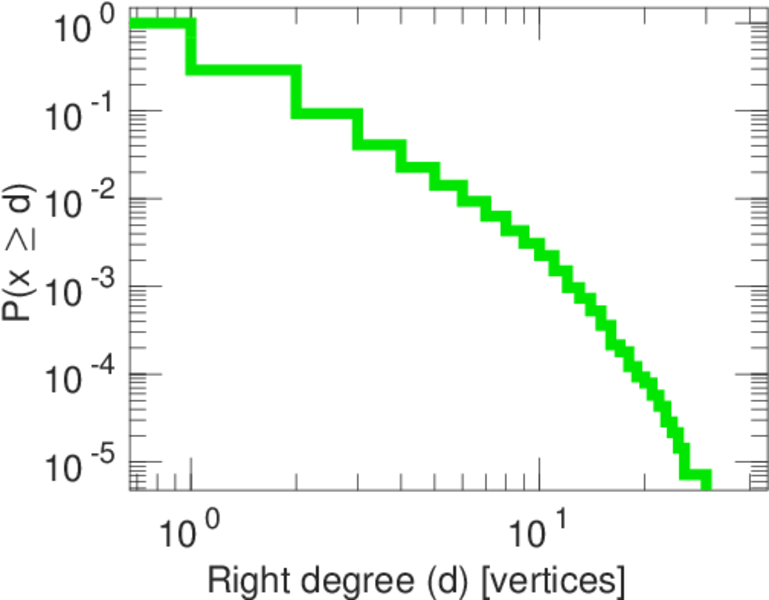
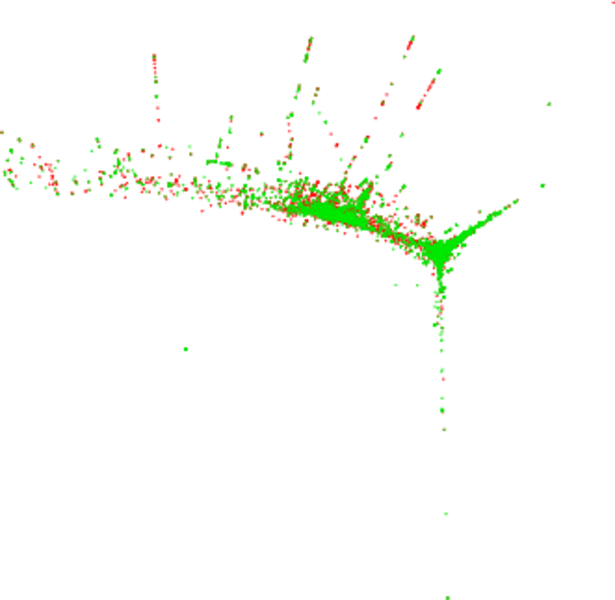
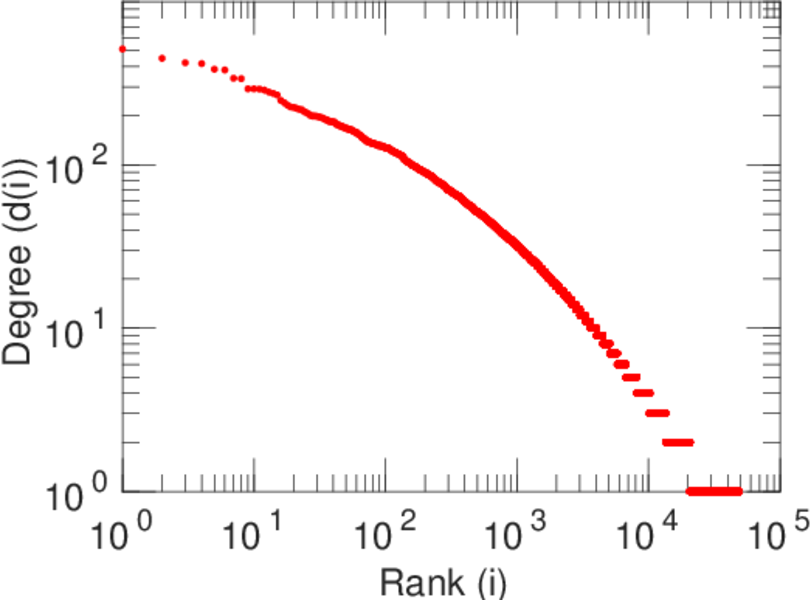
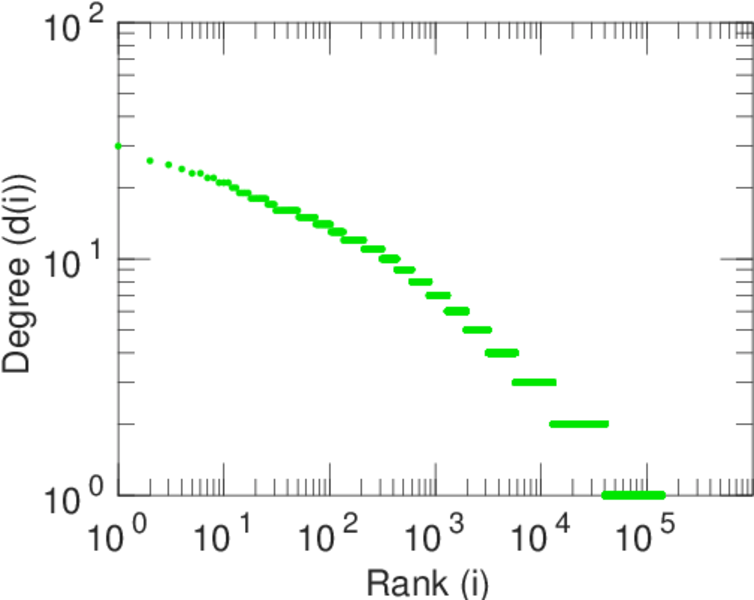
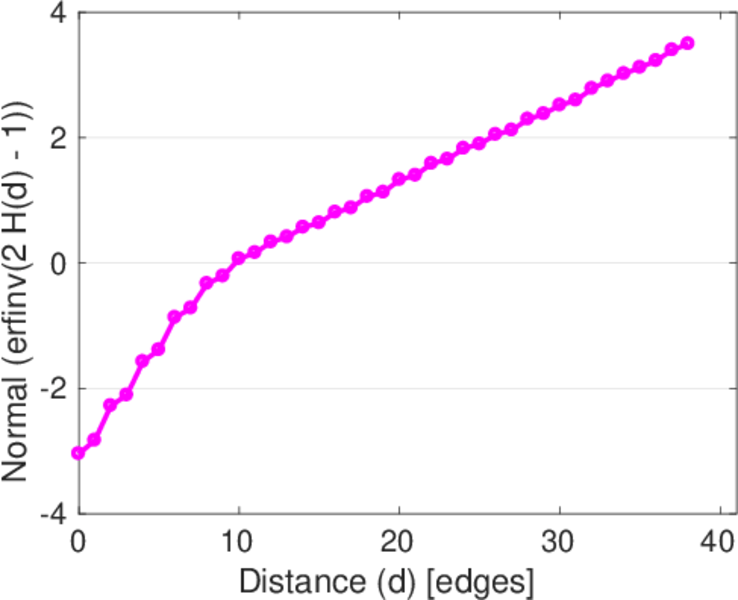
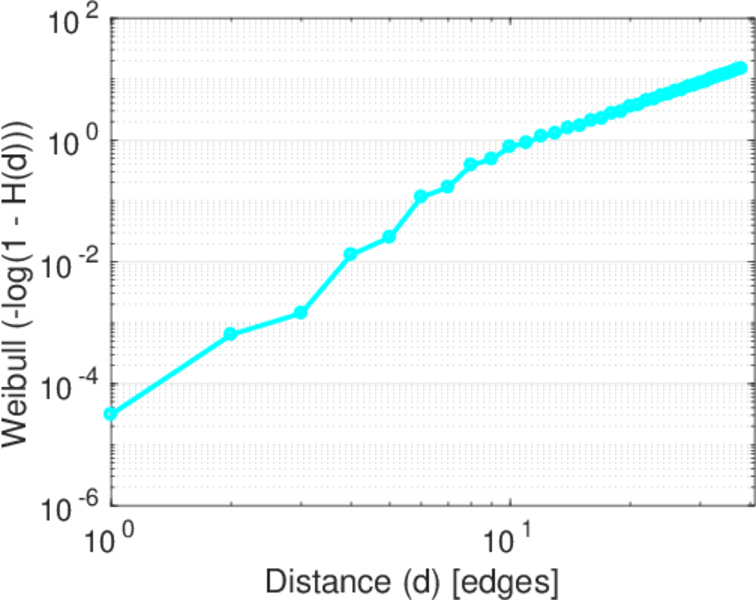
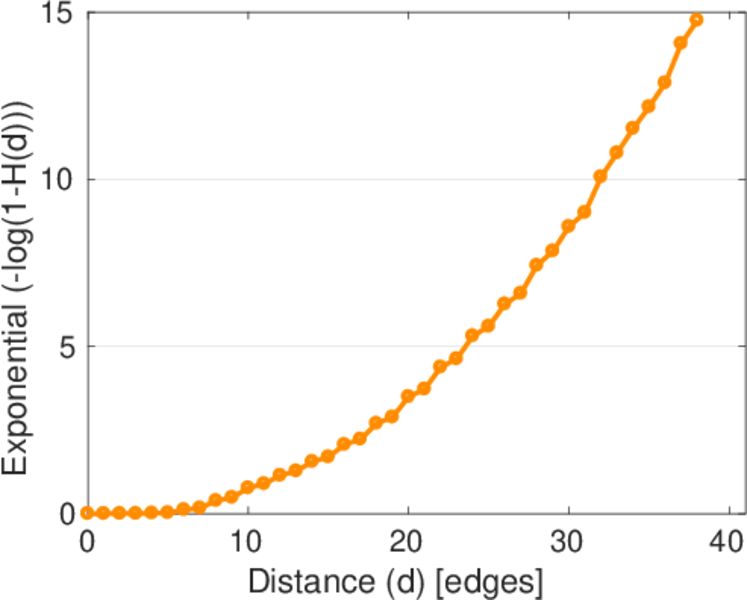
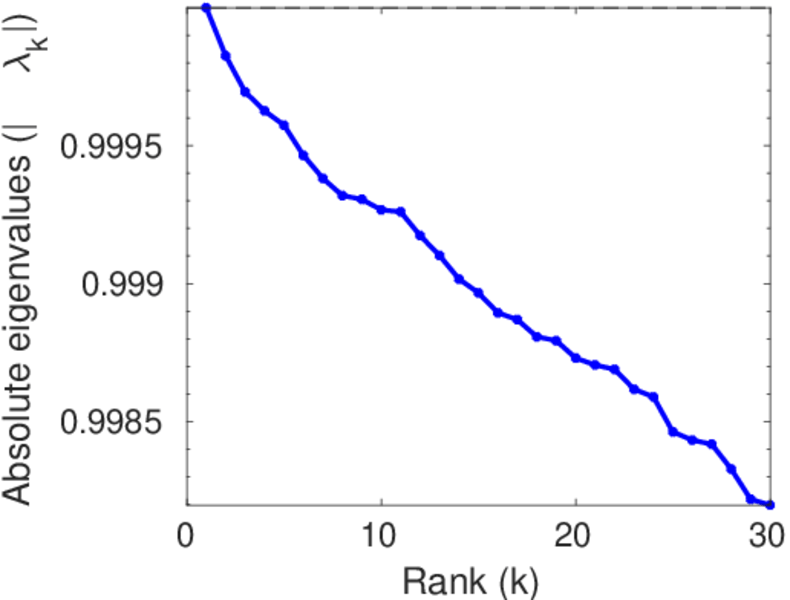
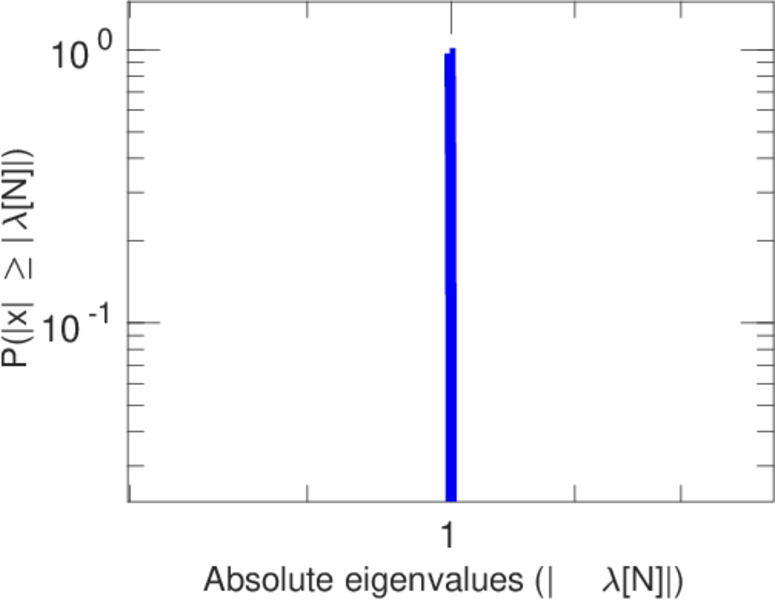
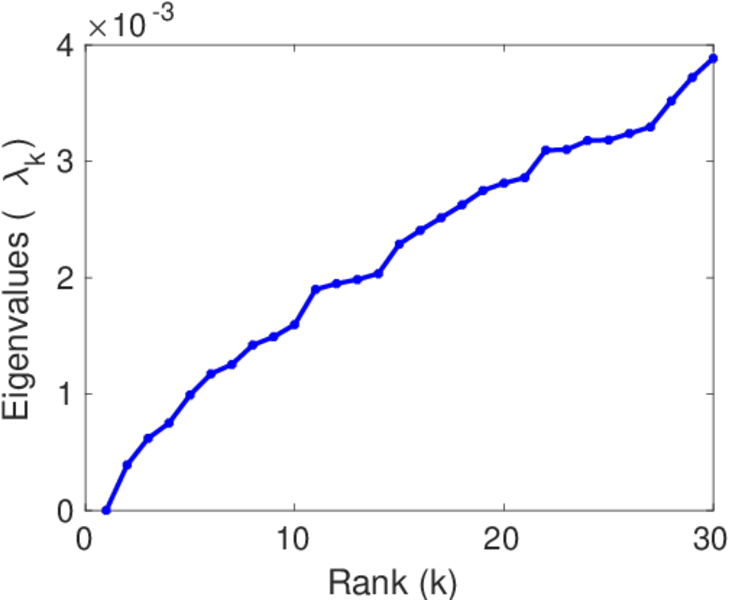
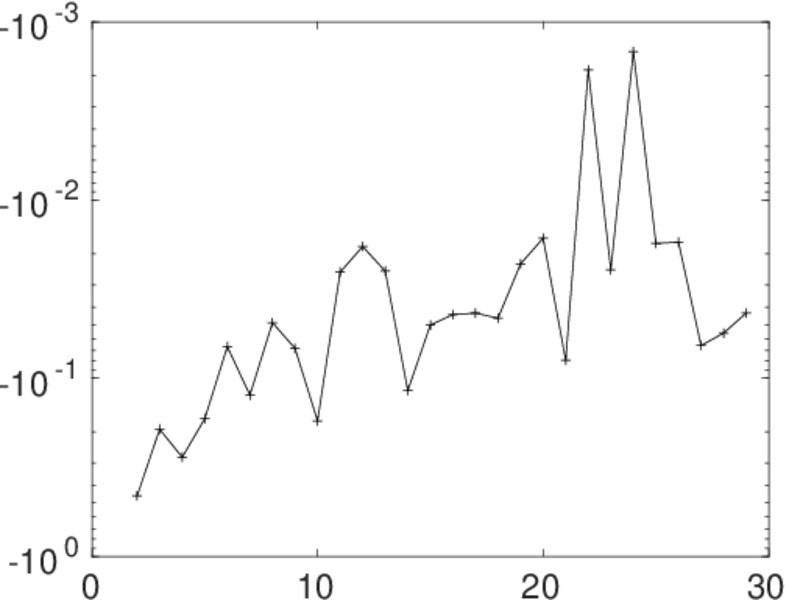
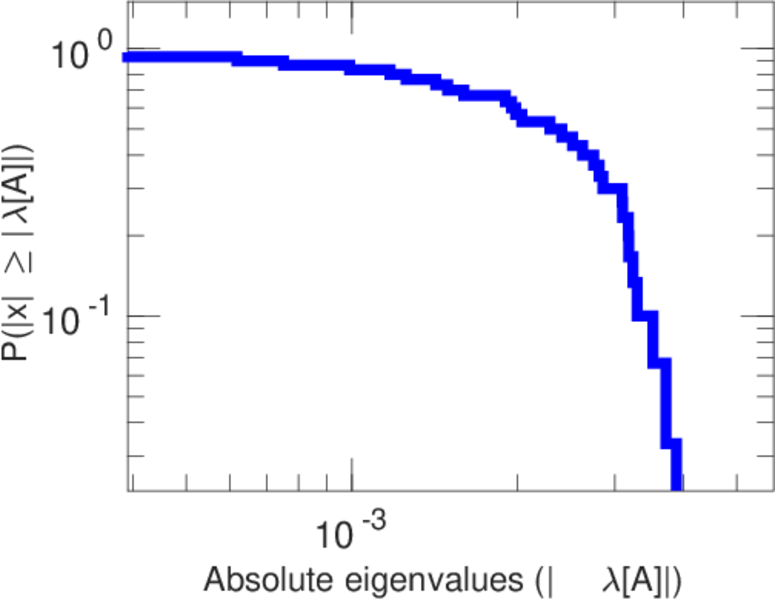
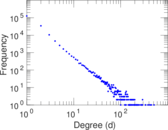
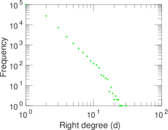
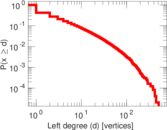
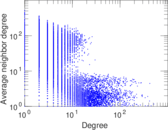
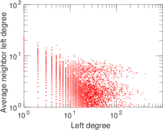
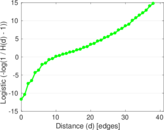
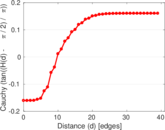
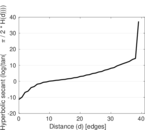
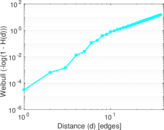
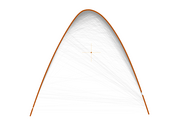
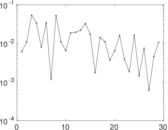
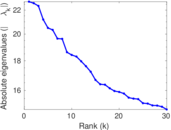
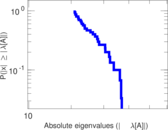
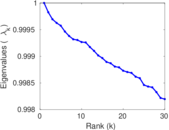
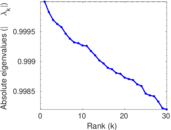
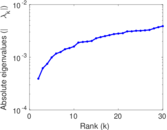
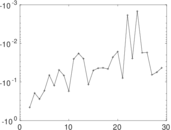
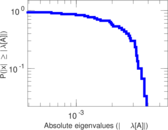
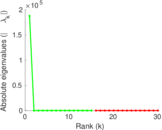
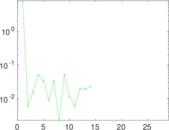
Plots


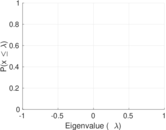


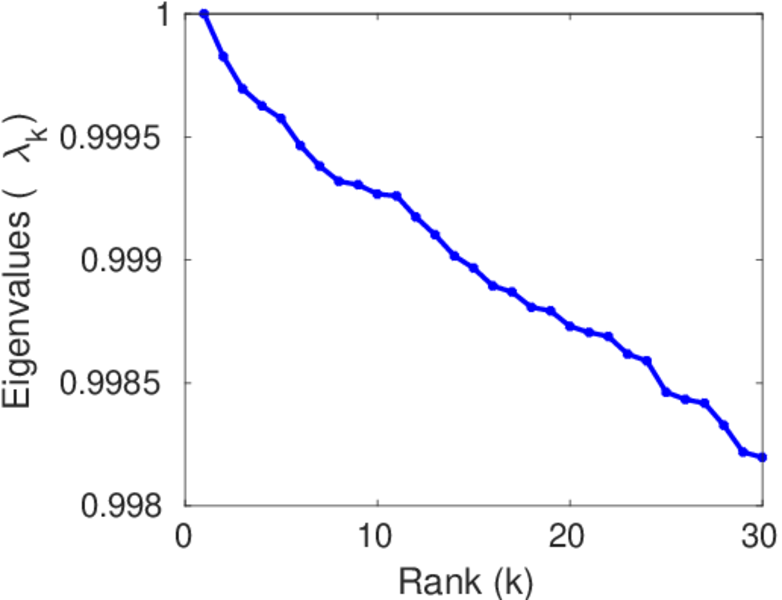
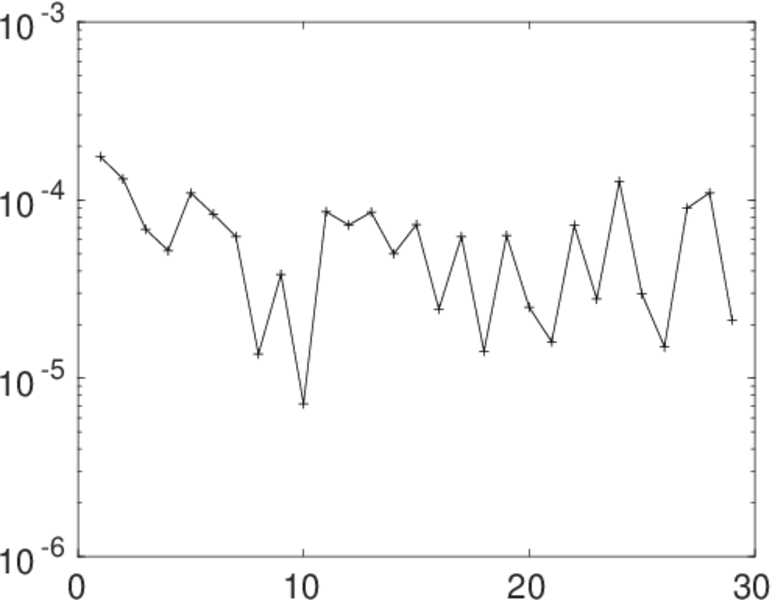
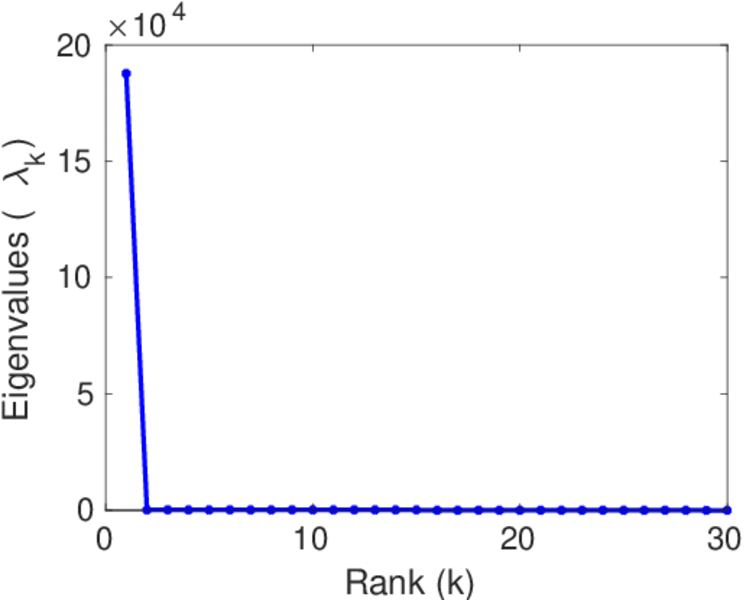
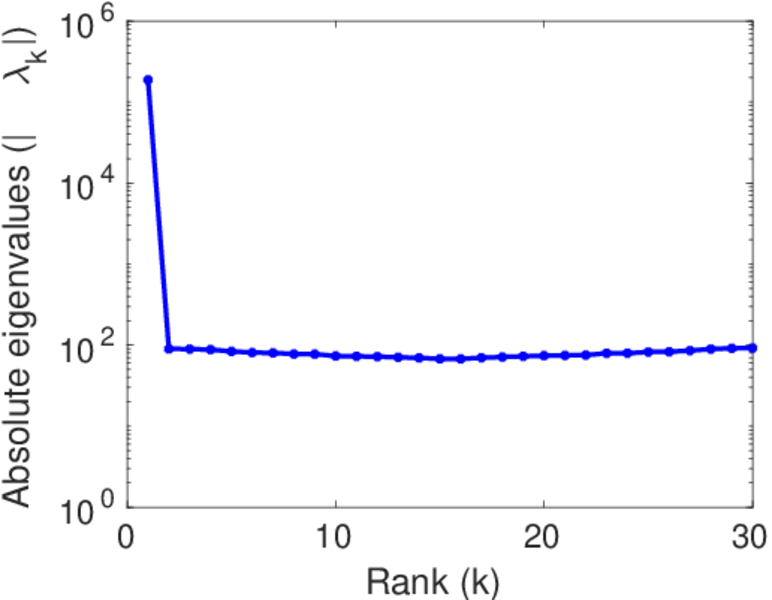
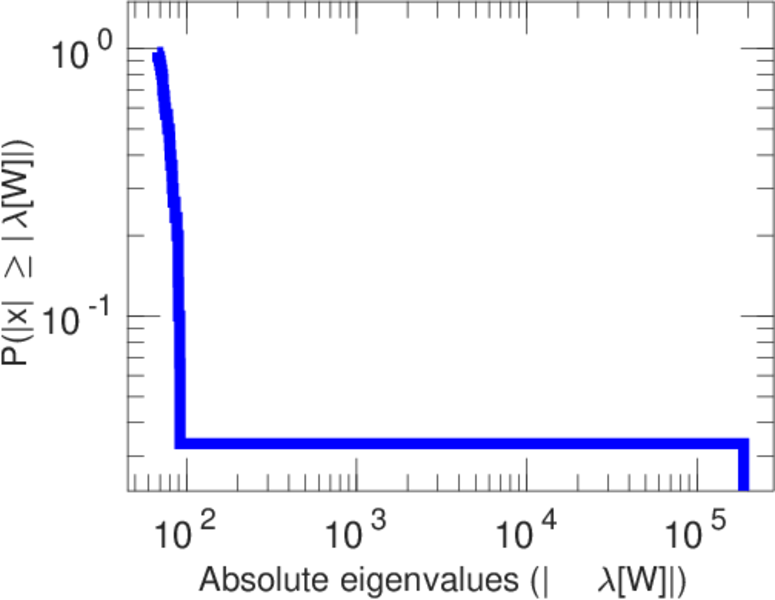
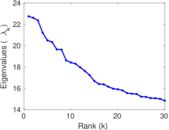
Matrix decompositions plots


Downloads
References
|
[1]
|
Jérôme Kunegis.
KONECT – The Koblenz Network Collection.
In Proc. Int. Conf. on World Wide Web Companion, pages
1343–1350, 2013.
[ http ]
|
|
[2]
|
Sören Auer, Christian Bizer, Georgi Kobilarov, Jens Lehmann, Richard Cyganiak,
and Zachary Ives.
DBpedia: A nucleus for a web of open data.
In Proc. Int. Semant. Web Conf., pages 722–735, 2008.
|
 KONECT ‣ Networks ‣
Buy Me a Coffee
KONECT ‣ Networks ‣
Buy Me a Coffee