Record labels
This is the bipartite network of musical artists and their record labels from
DBpedia. Nodes in the network are artists and record labels. Each edge connects
an artist with a record label under which the artist has performed. The edges
correspond to the <http://dbpedia.org/ontology/recordLabel> relationships
in DBpedia.
Metadata
Statistics
| Size | n = | 186,758
|
| Left size | n1 = | 168,337
|
| Right size | n2 = | 18,421
|
| Volume | m = | 233,286
|
| Wedge count | s = | 144,874,235
|
| Claw count | z = | 188,705,350,220
|
| Cross count | x = | 238,923,687,286,069
|
| Square count | q = | 1,086,886
|
| 4-Tour count | T4 = | 588,686,820
|
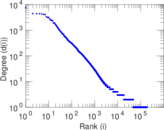
| Maximum degree | dmax = | 7,446
|
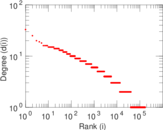
| Maximum left degree | d1max = | 33
|
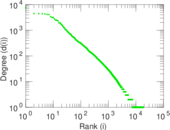
| Maximum right degree | d2max = | 7,446
|
| Average degree | d = | 2.498 27
|
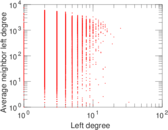
| Average left degree | d1 = | 1.385 83
|
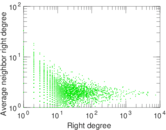
| Average right degree | d2 = | 12.664 1
|
| Fill | p = | 7.523 08 × 10−5
|
| Size of LCC | N = | 169,462
|
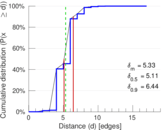
| Diameter | δ = | 23
|
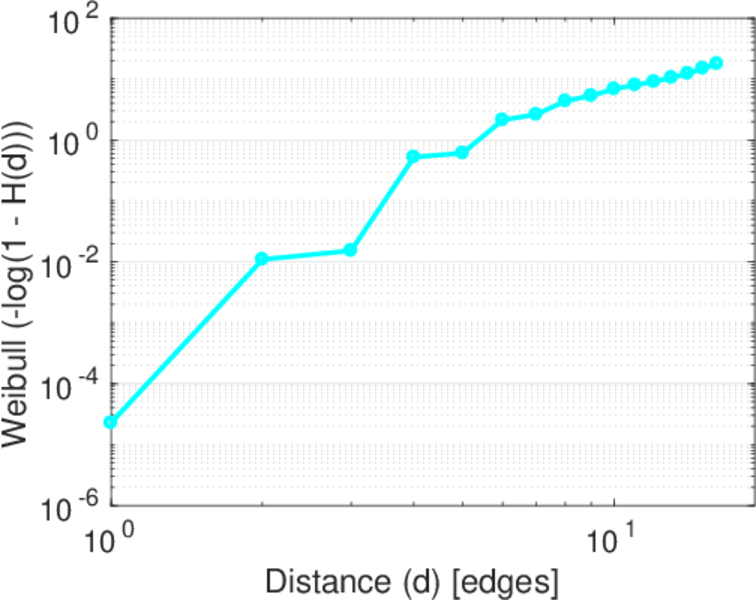
| 50-Percentile effective diameter | δ0.5 = | 5.105 38
|
| 90-Percentile effective diameter | δ0.9 = | 6.437 99
|
| Median distance | δM = | 6
|
| Mean distance | δm = | 5.326 39
|
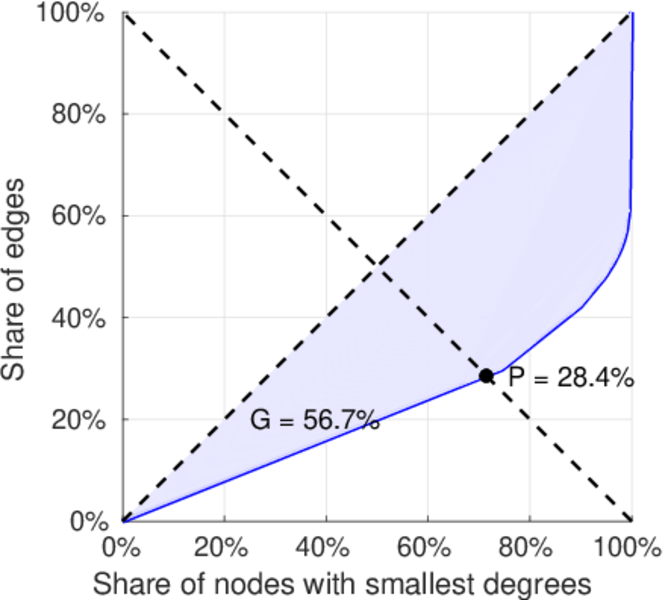
| Gini coefficient | G = | 0.597 056
|
| Balanced inequality ratio | P = | 0.269 733
|
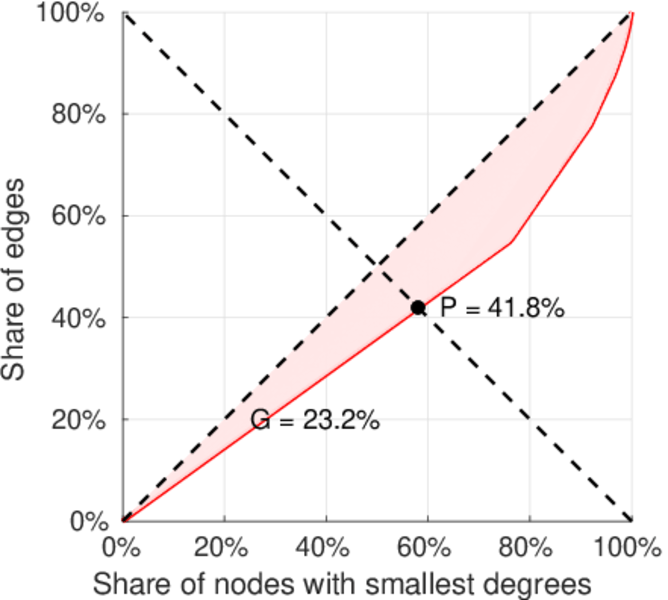
| Left balanced inequality ratio | P1 = | 0.418 349
|
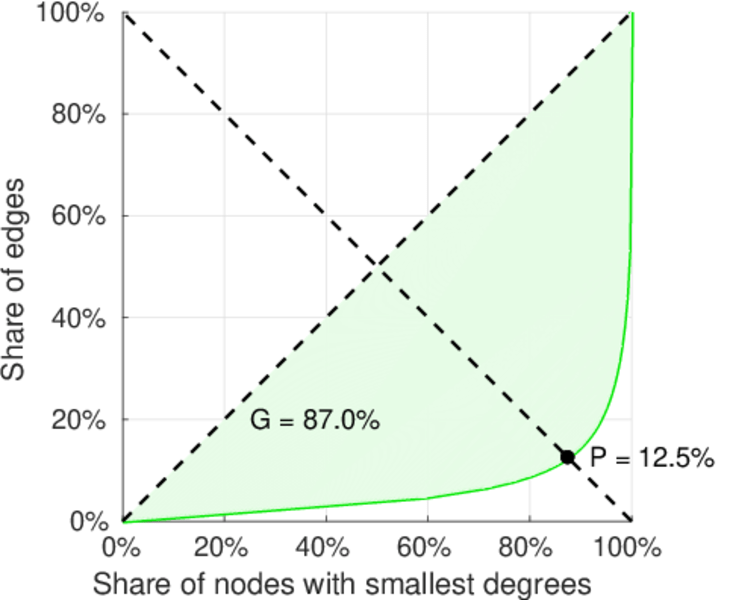
| Right balanced inequality ratio | P2 = | 0.124 551
|
| Relative edge distribution entropy | Her = | 0.835 910
|
| Power law exponent | γ = | 4.755 84
|
| Tail power law exponent | γt = | 2.571 00
|
| Tail power law exponent with p | γ3 = | 2.571 00
|
| p-value | p = | 0.000 00
|
| Left tail power law exponent with p | γ3,1 = | 5.761 00
|
| Left p-value | p1 = | 0.793 000
|
| Right tail power law exponent with p | γ3,2 = | 1.711 00
|
| Right p-value | p2 = | 0.000 00
|
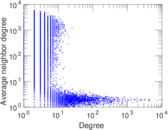
| Degree assortativity | ρ = | −0.047 893 7
|
| Degree assortativity p-value | pρ = | 1.607 40 × 10−118
|
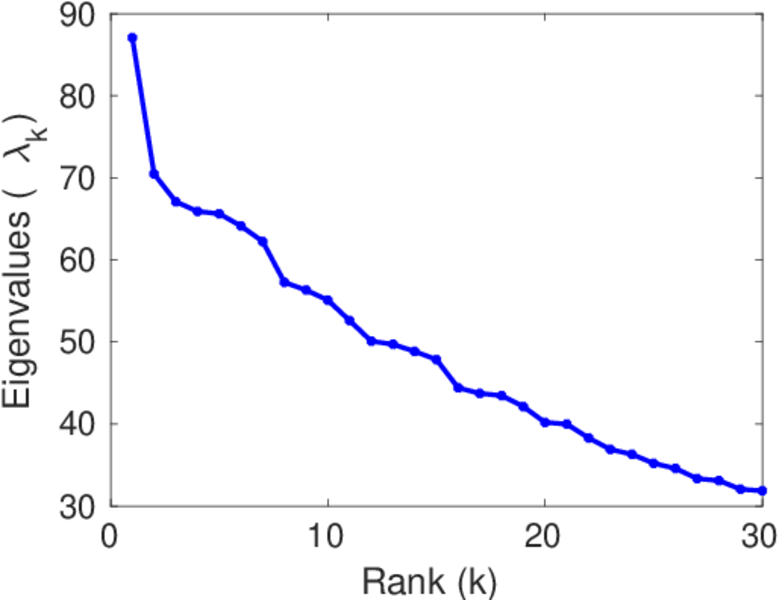
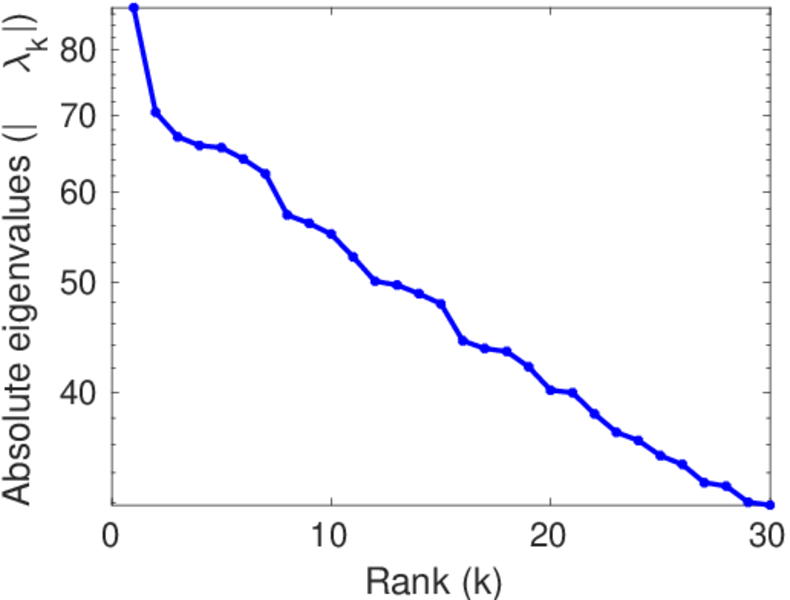
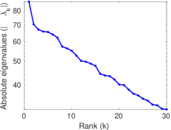
| Spectral norm | α = | 87.074 8
|
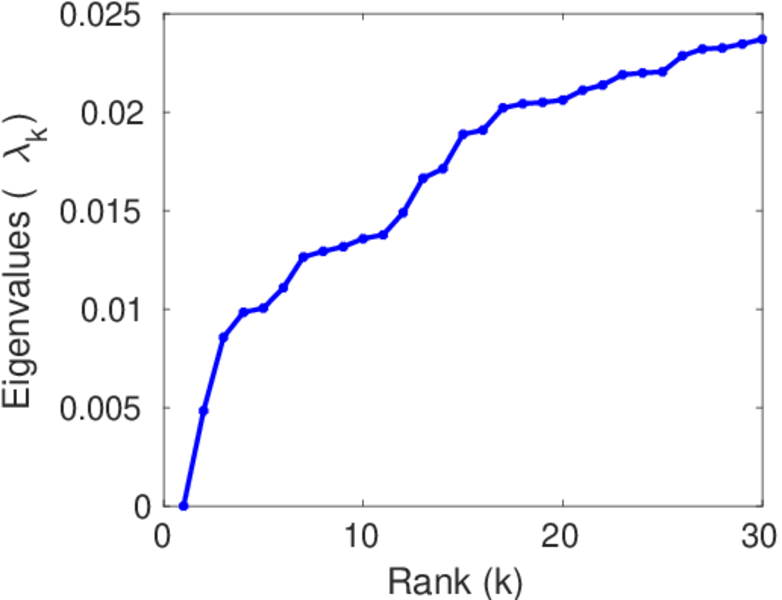
| Algebraic connectivity | a = | 0.004 835 56
|
| Spectral separation | |λ1[A] / λ2[A]| = | 1.235 64
|
| Controllability | C = | 153,693
|
| Relative controllability | Cr = | 0.823 257
|
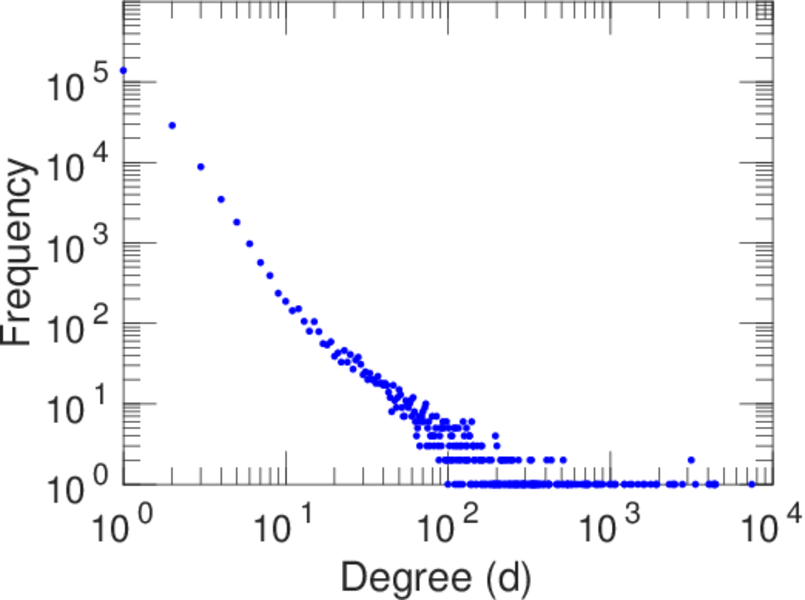
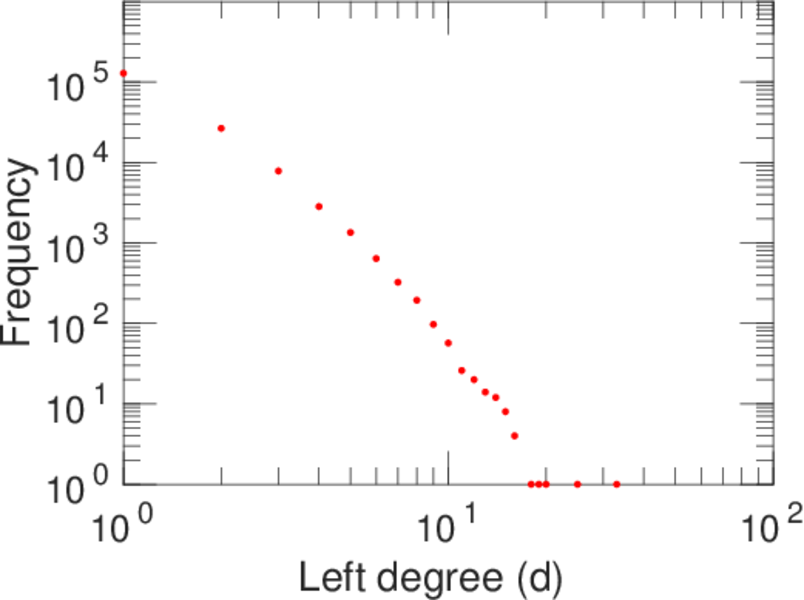
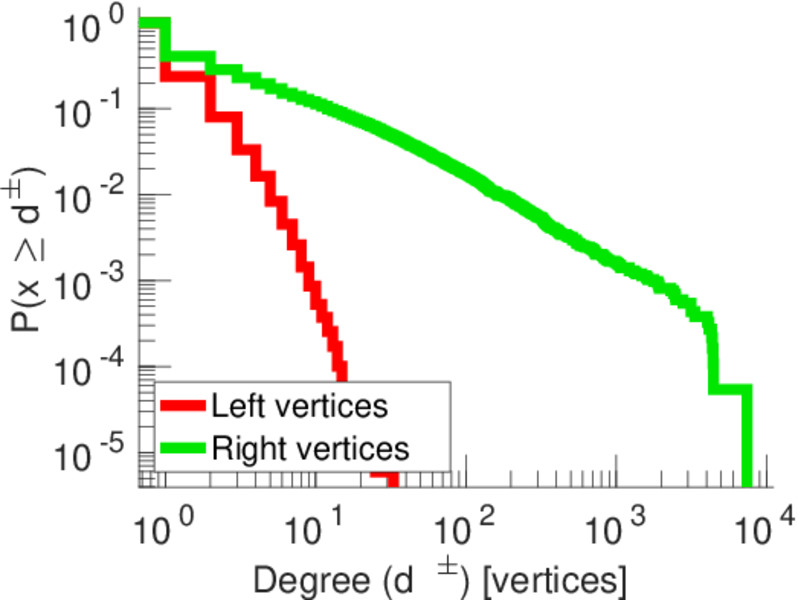
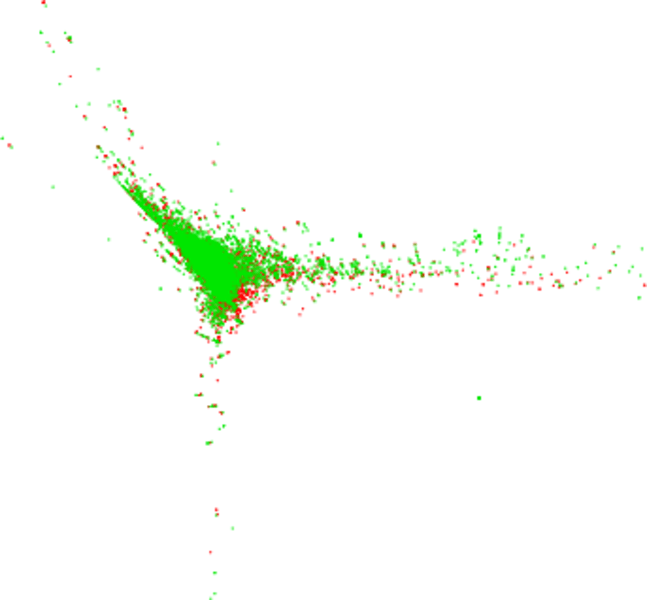
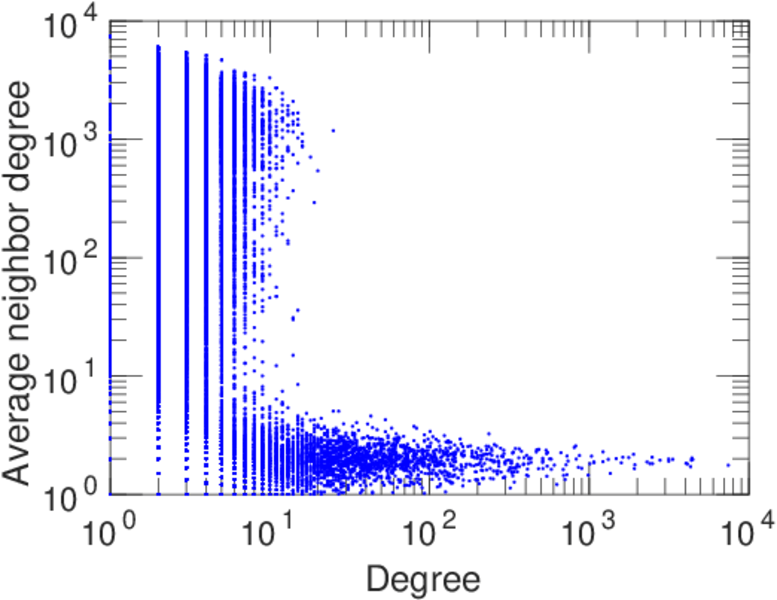
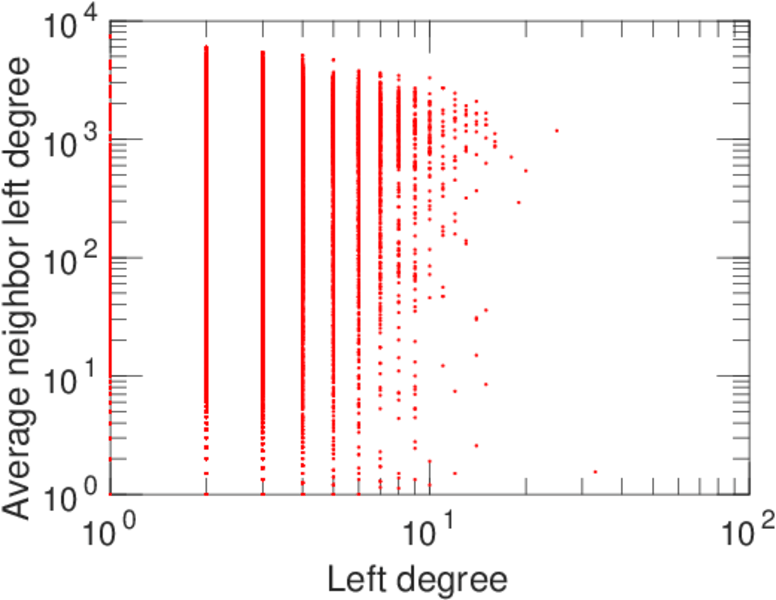
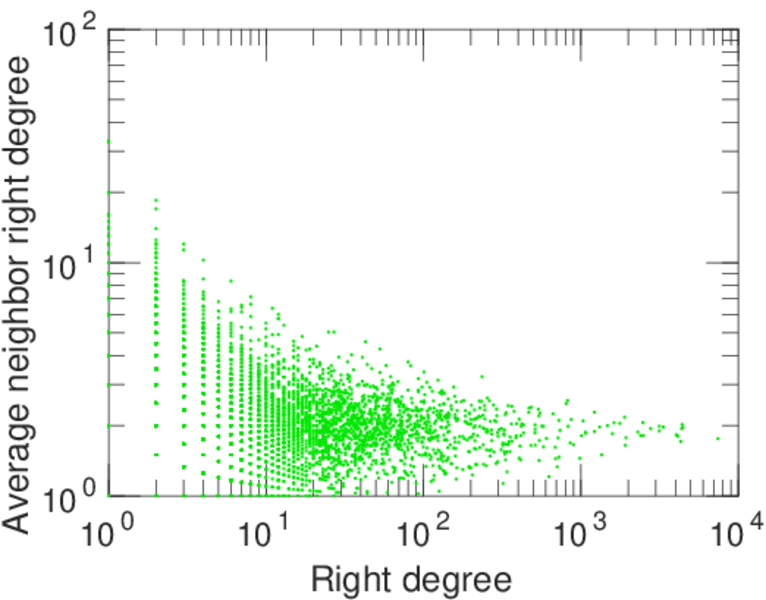
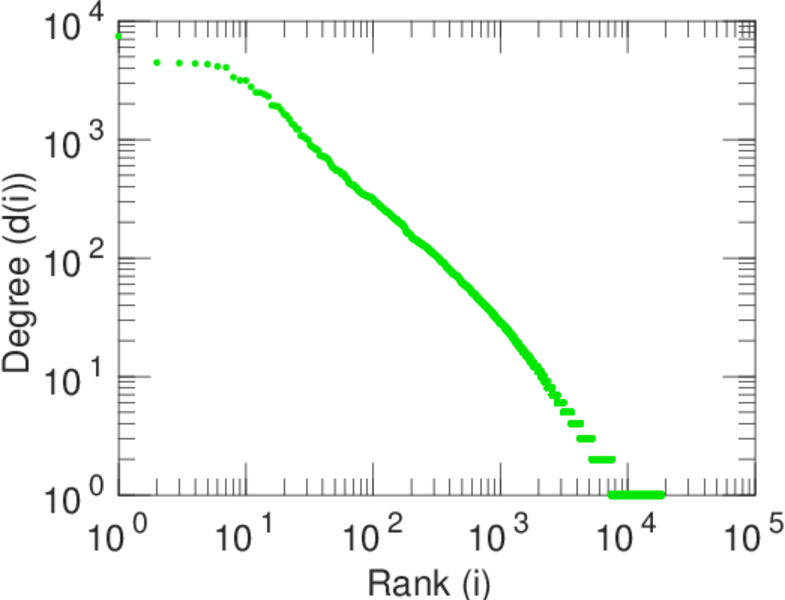
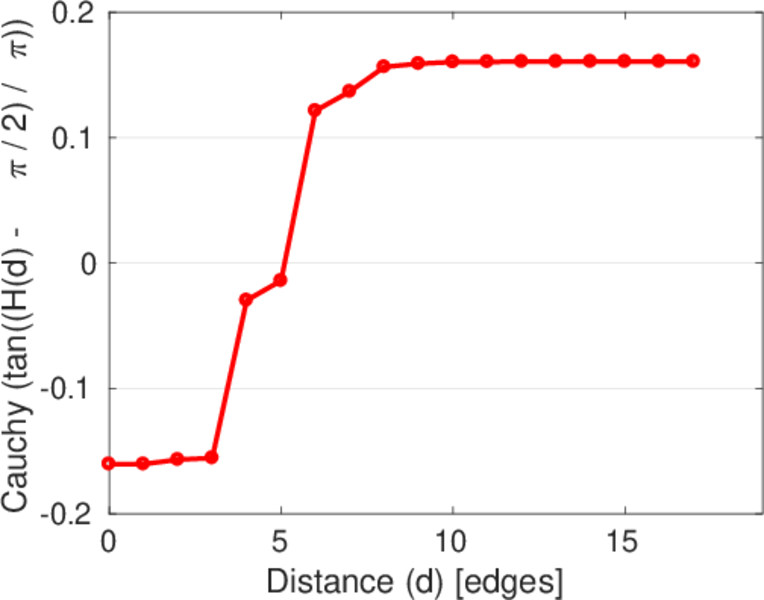
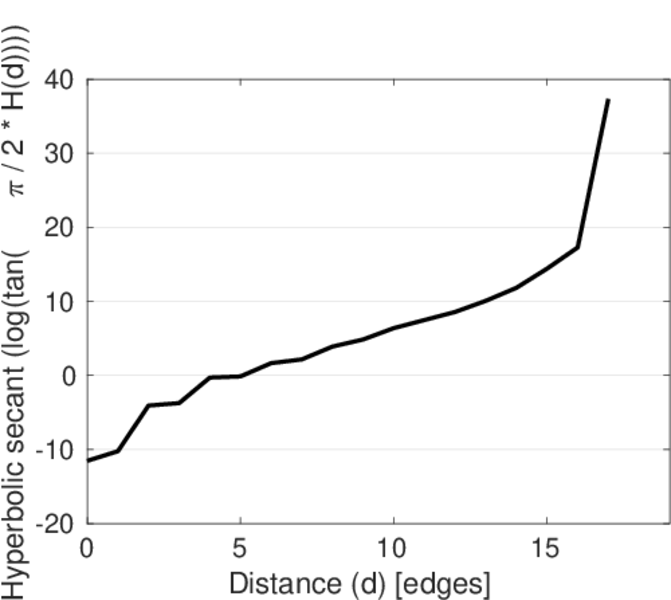
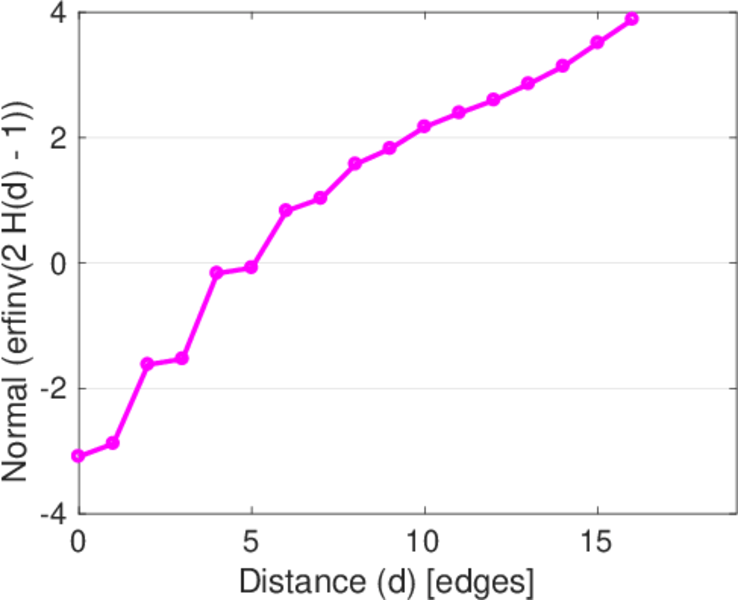
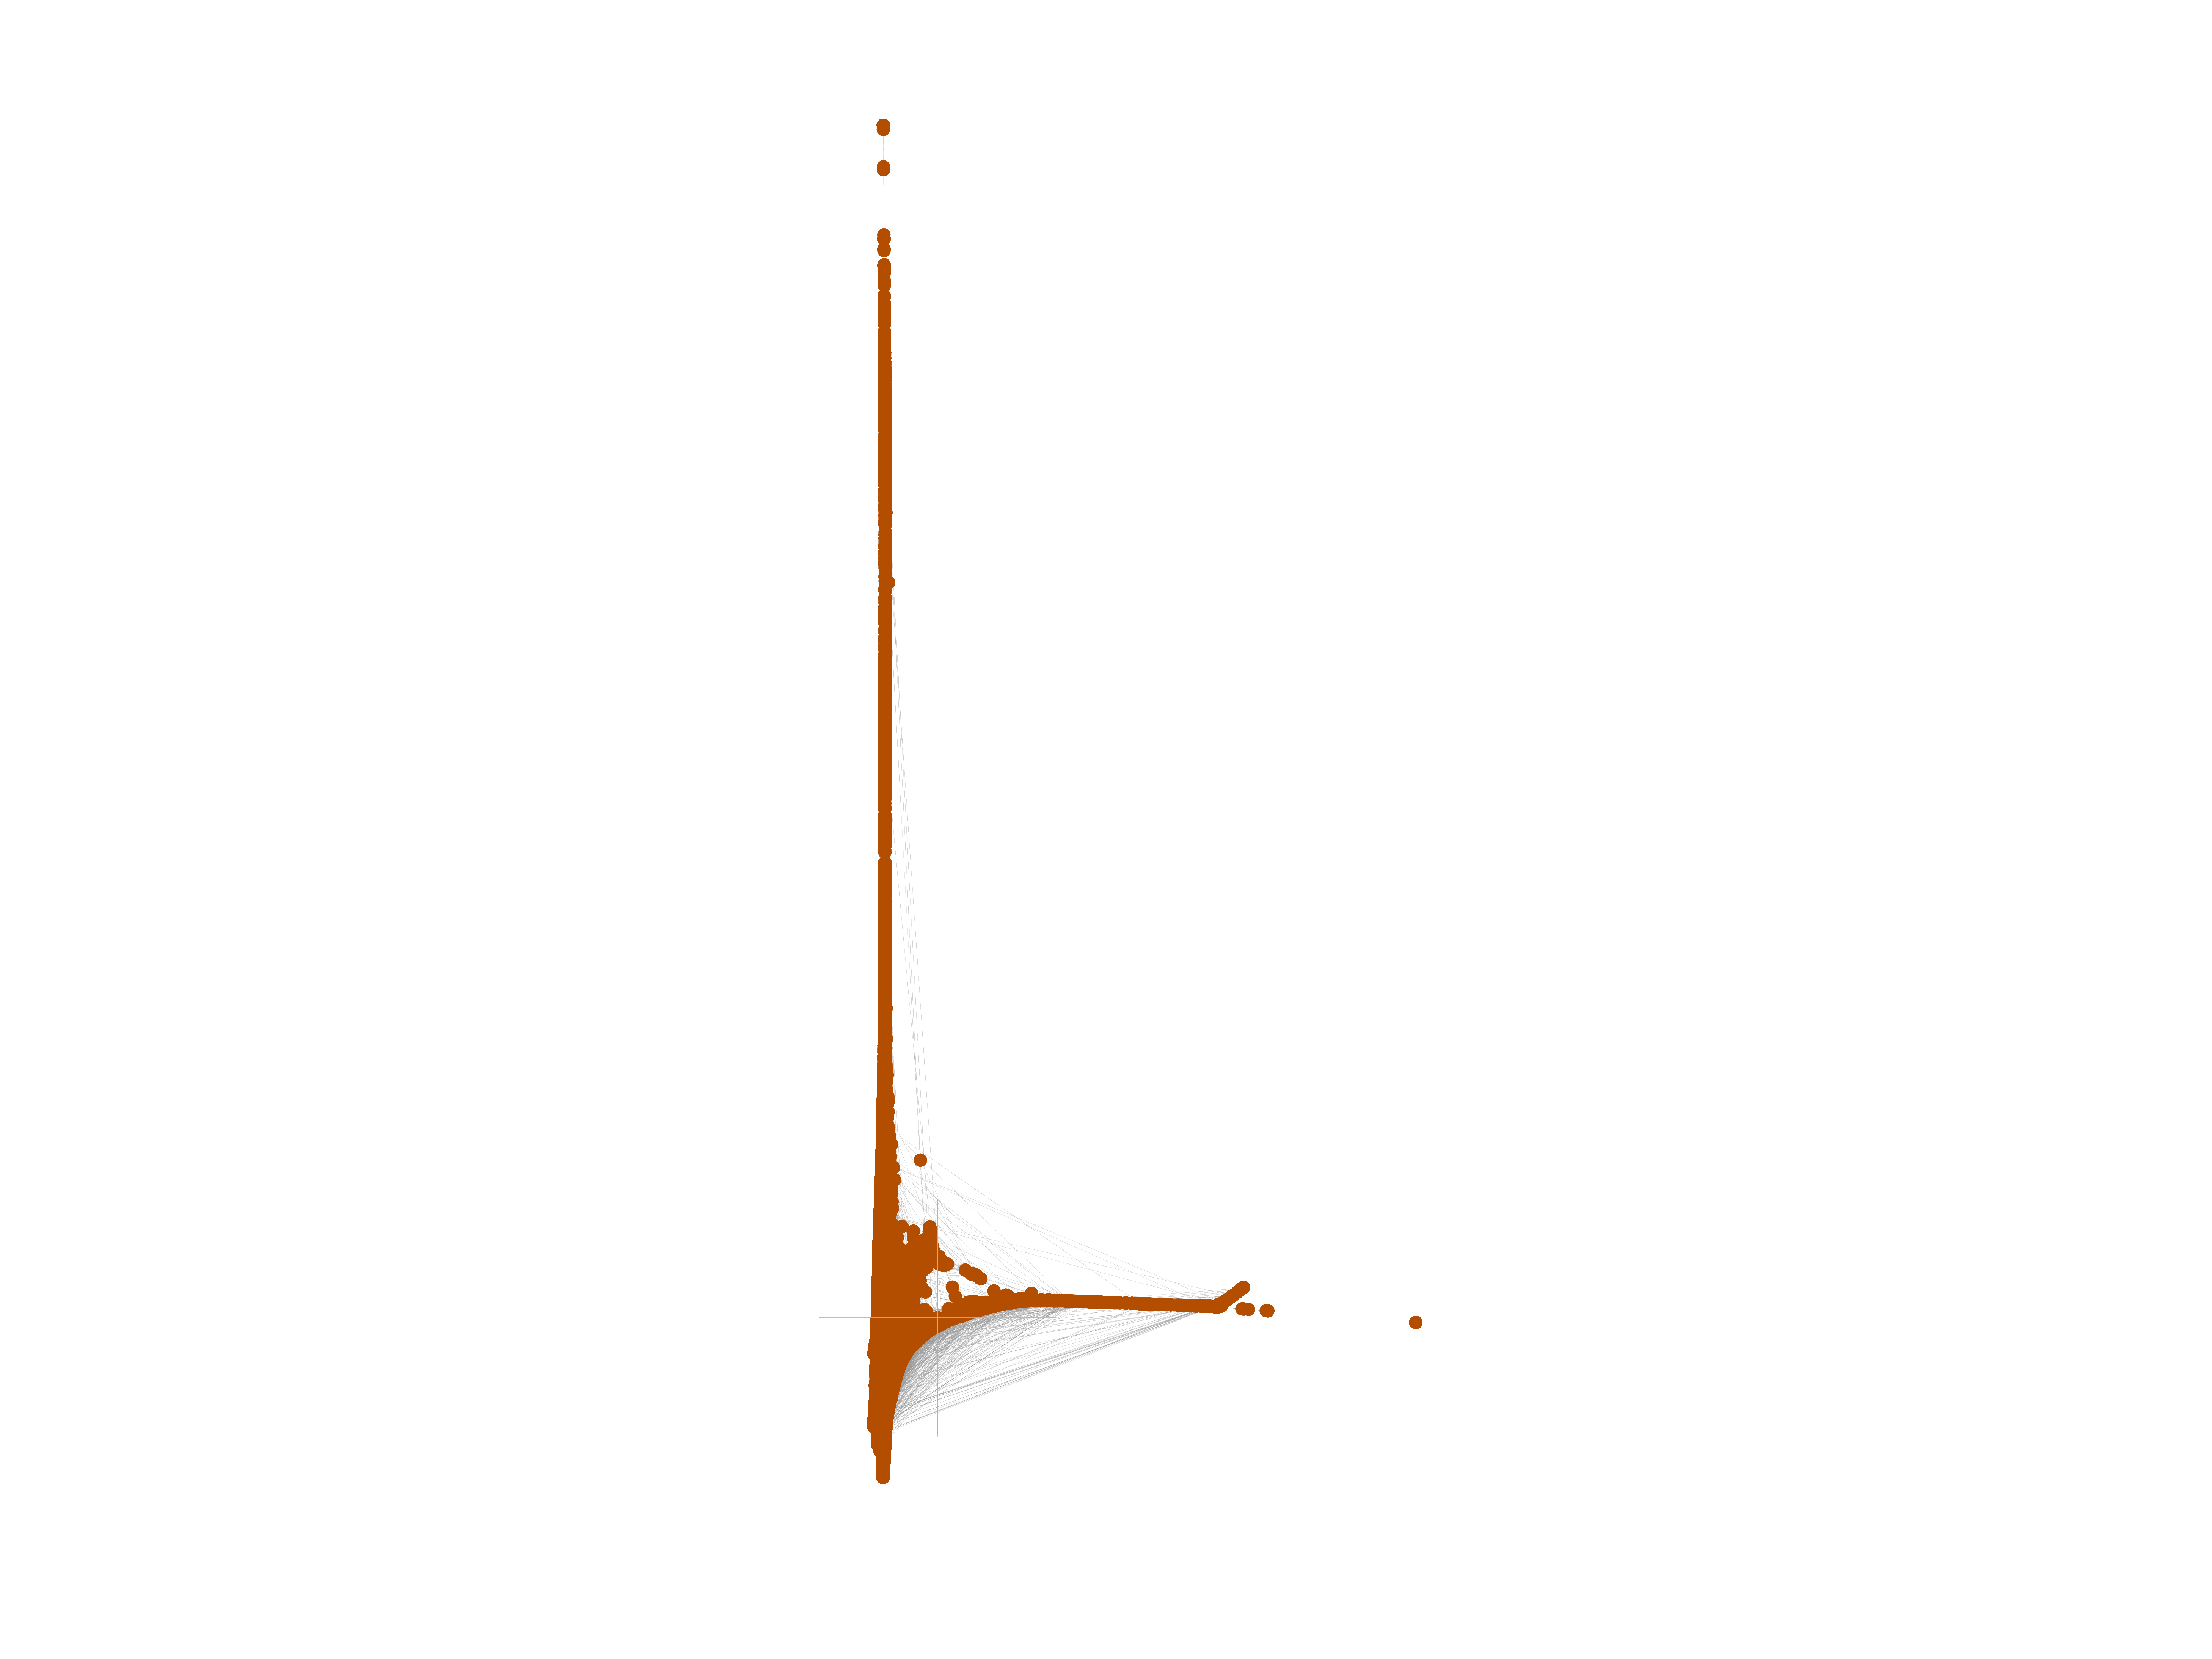
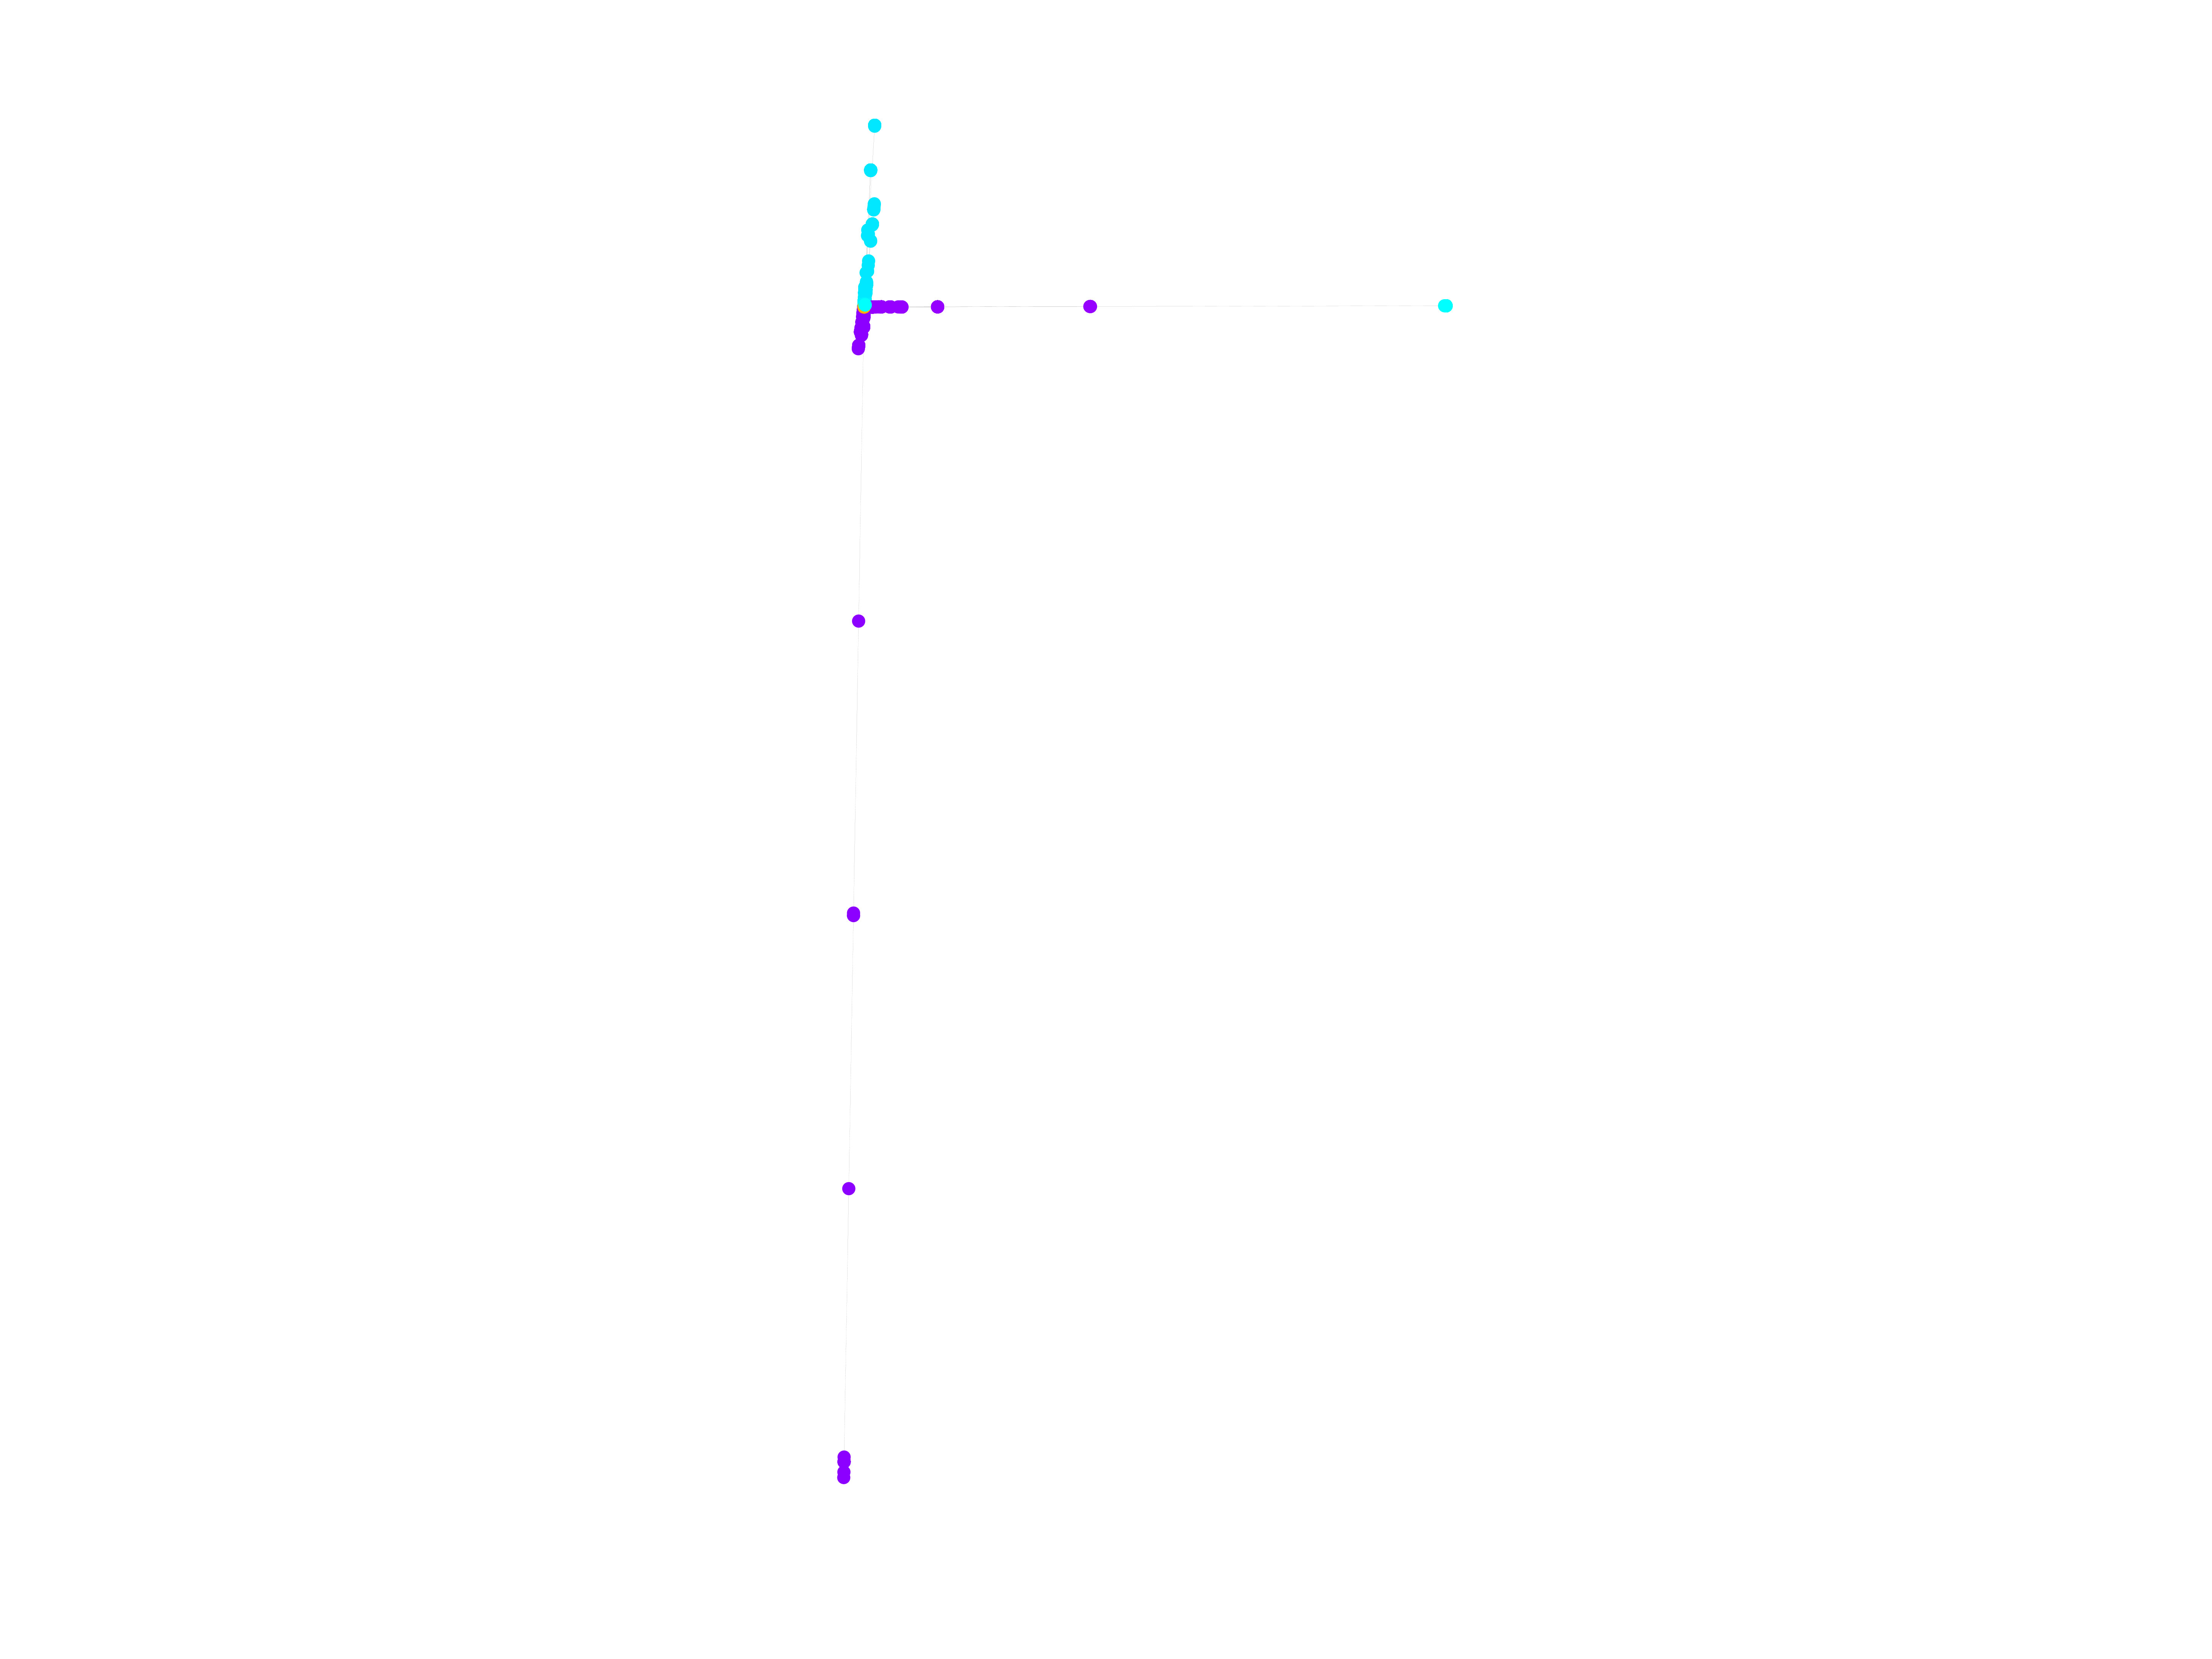
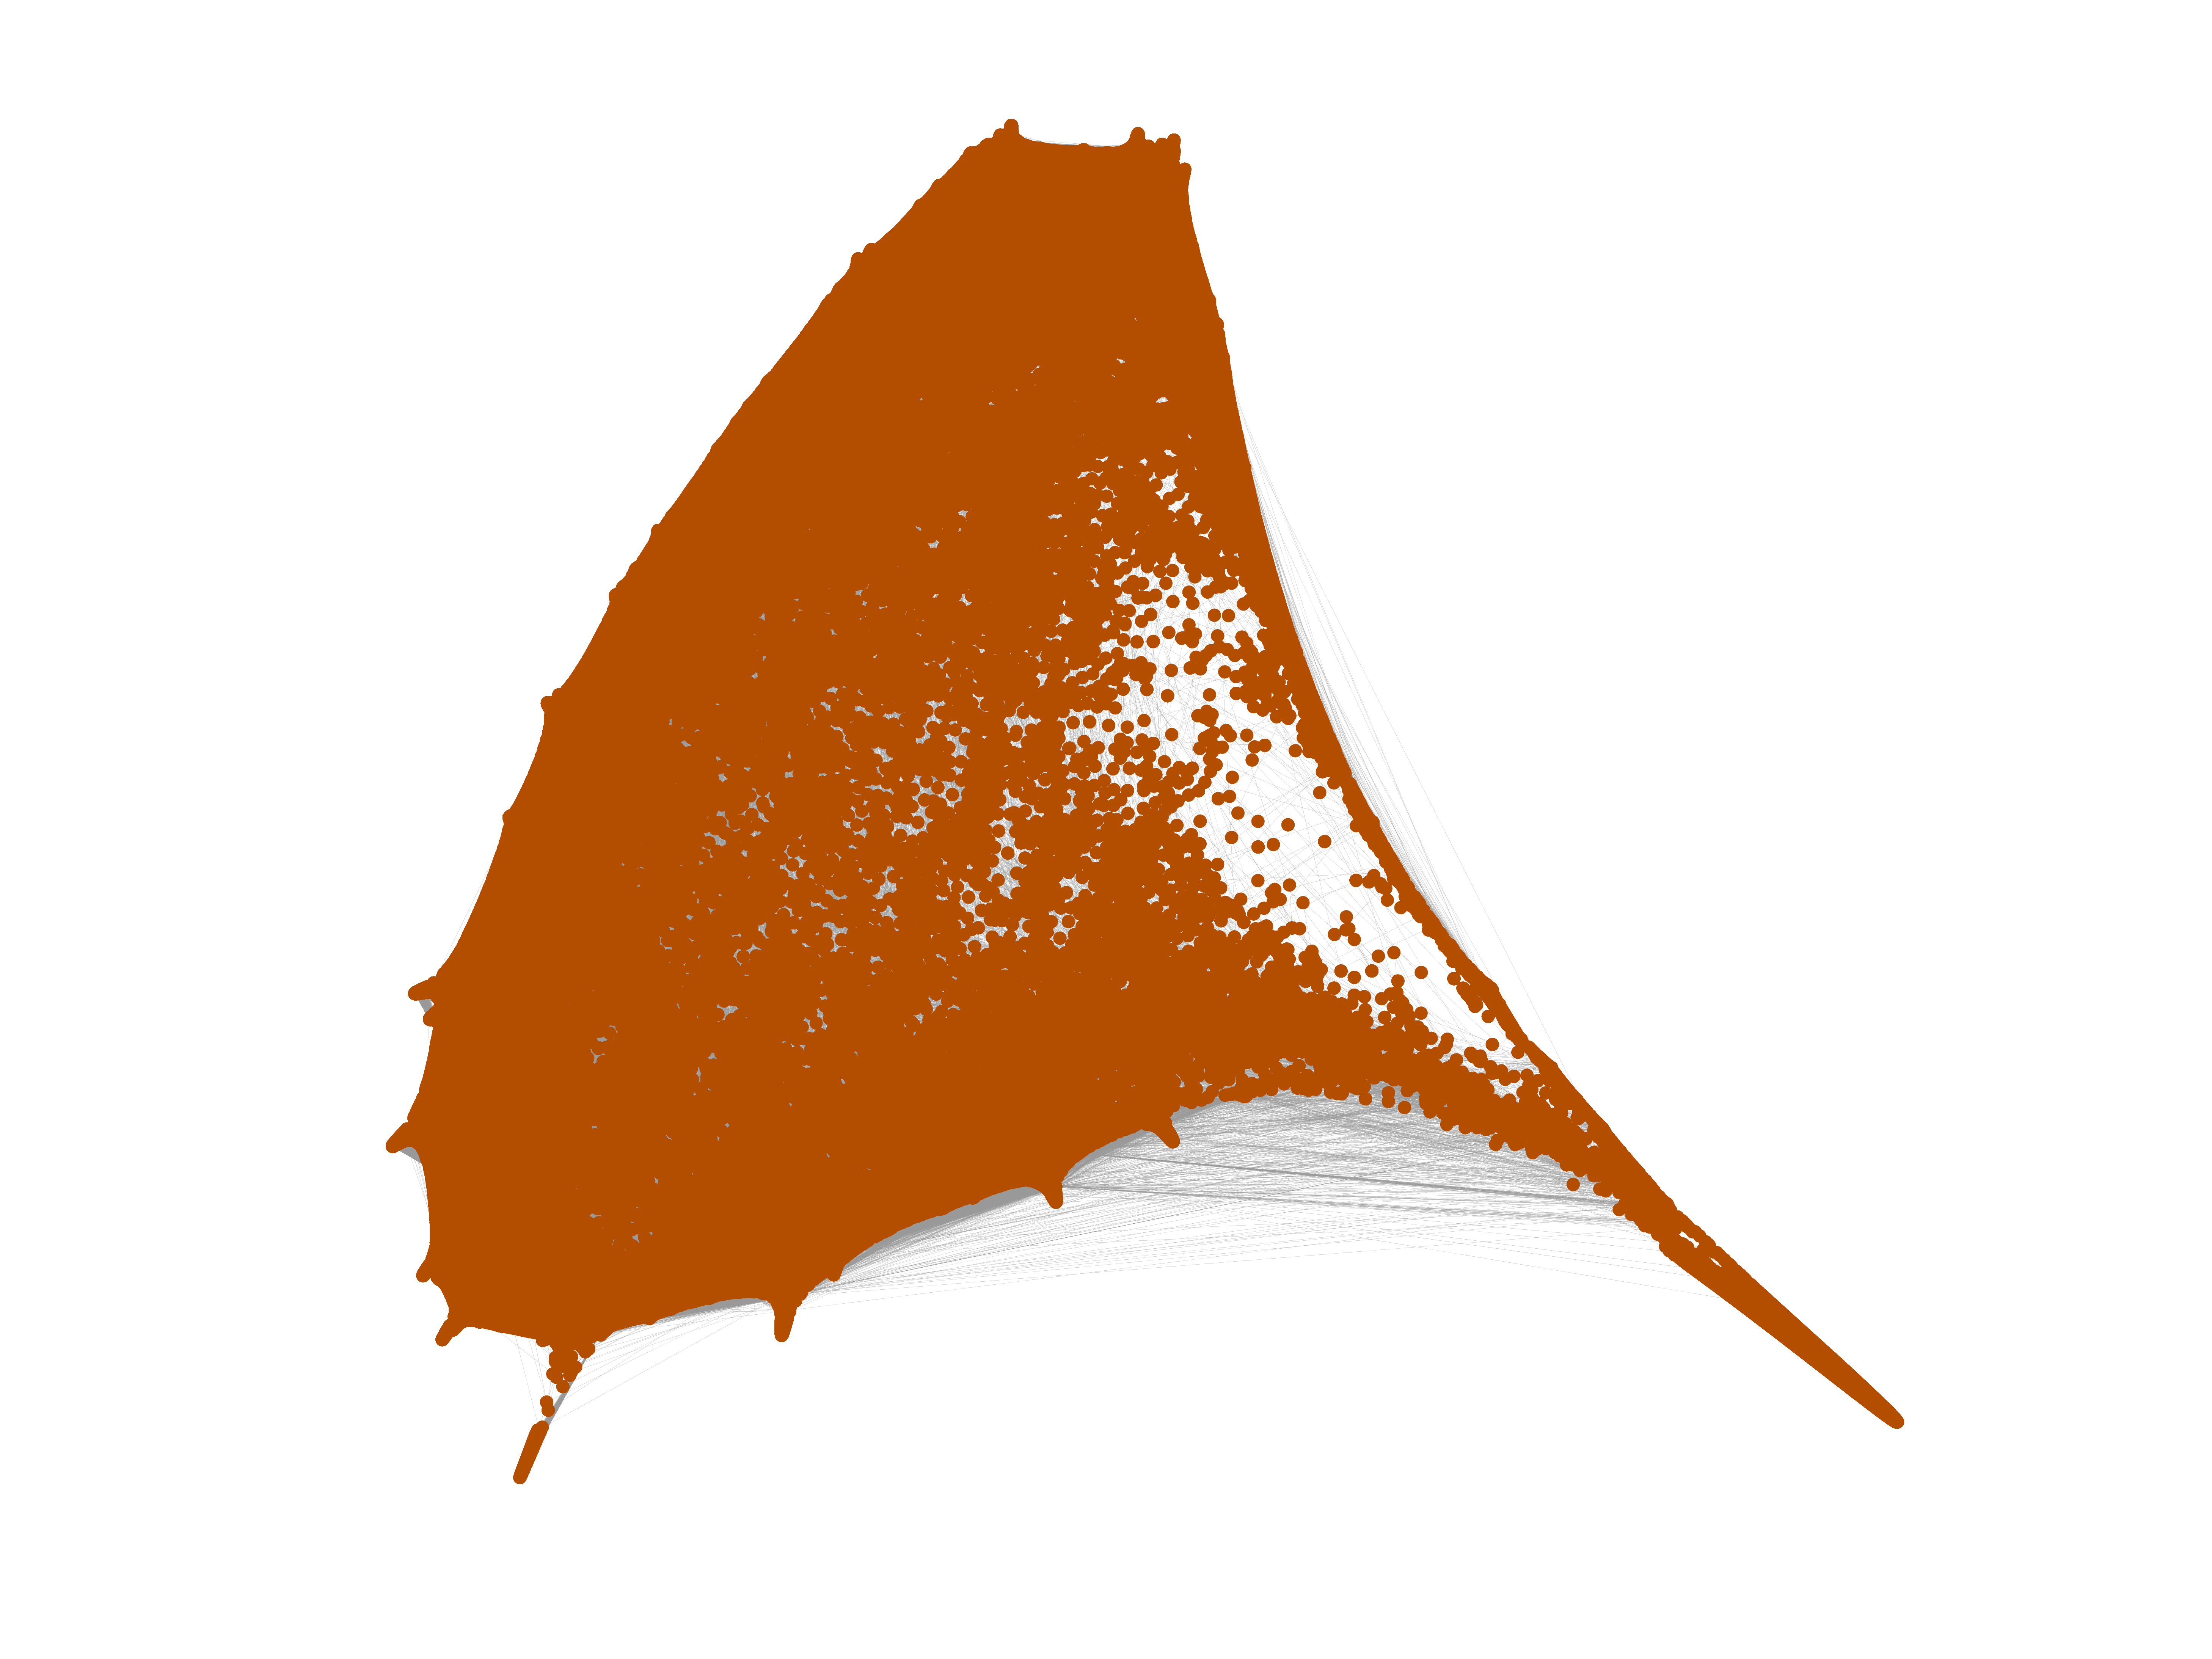
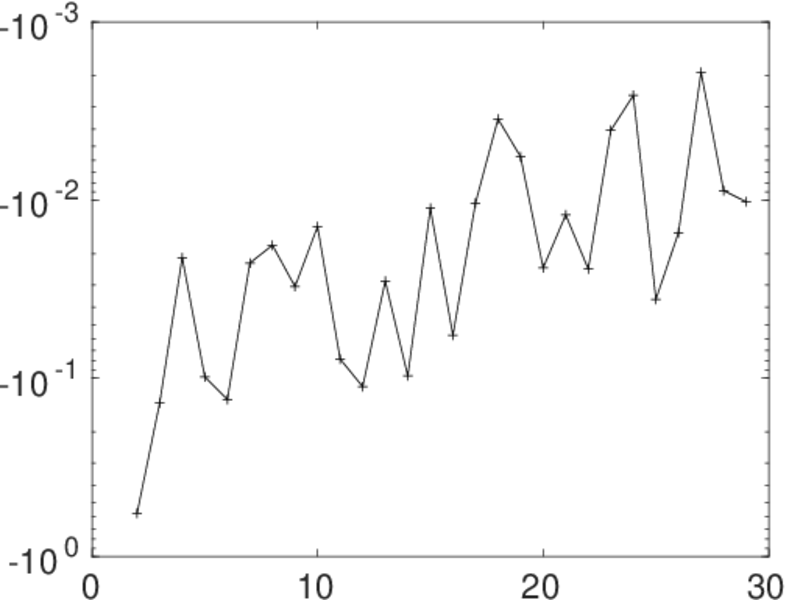
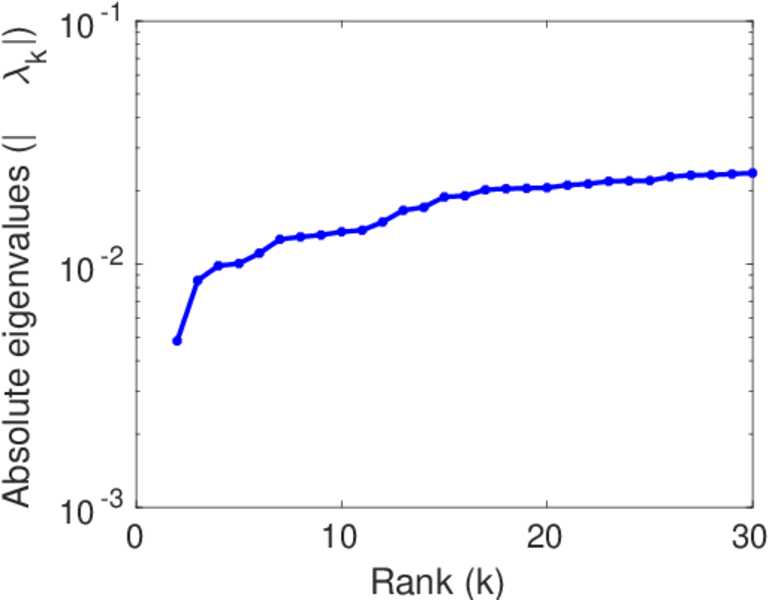
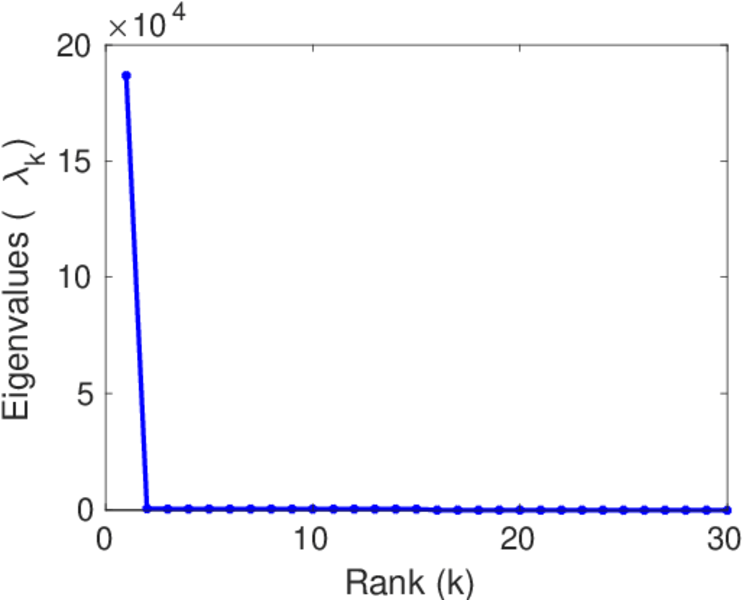
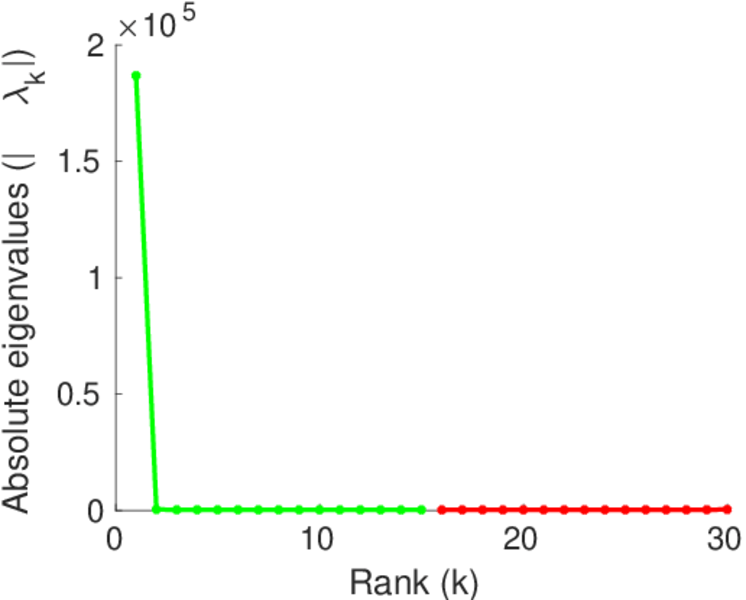
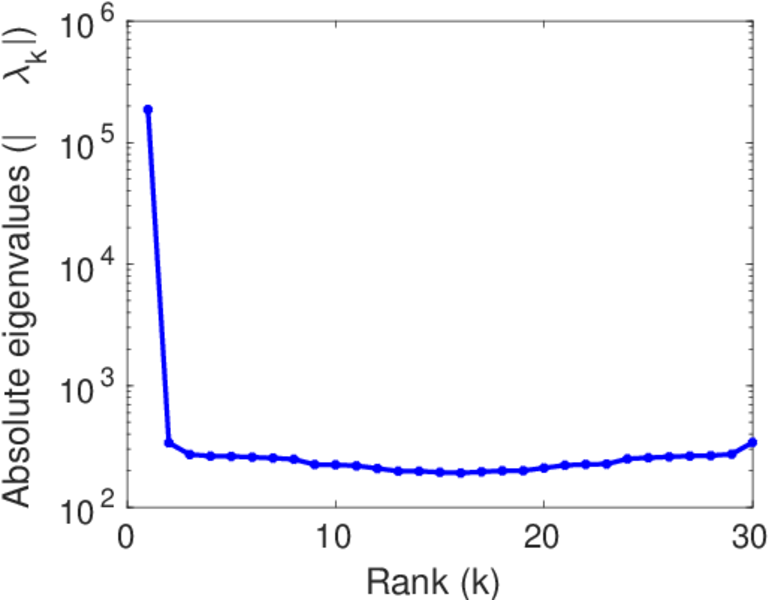
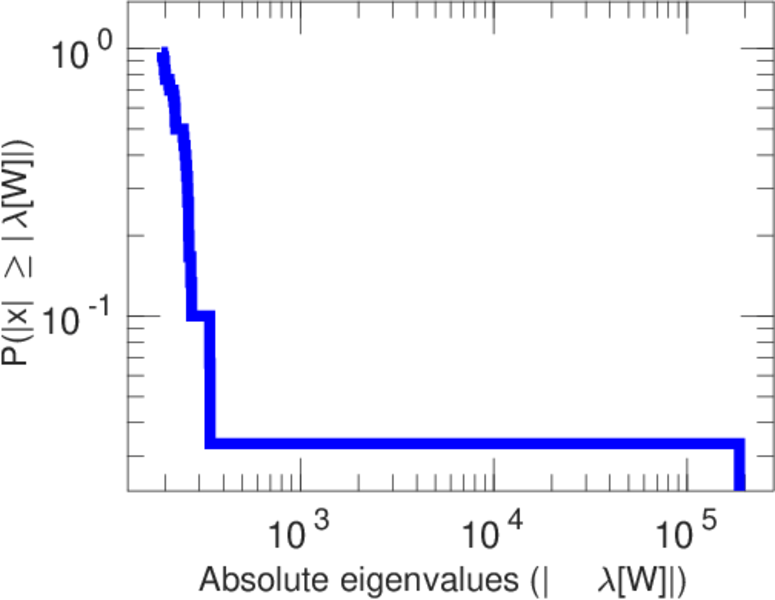
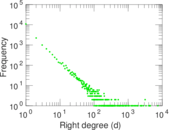
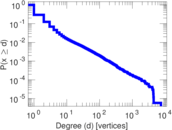
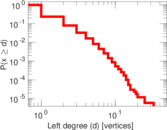
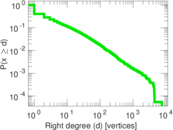
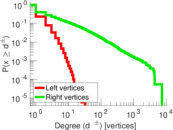
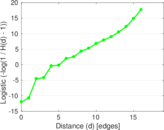
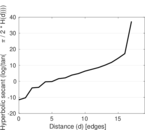
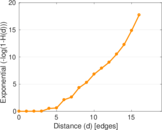
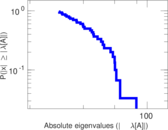
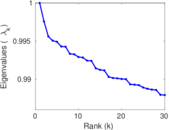
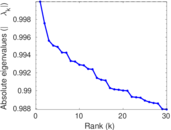
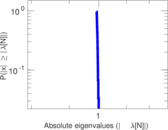
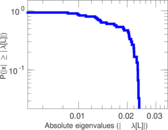
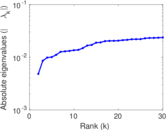
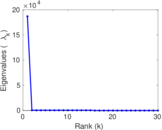
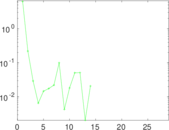
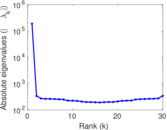
Plots


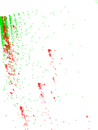
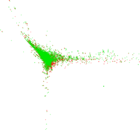


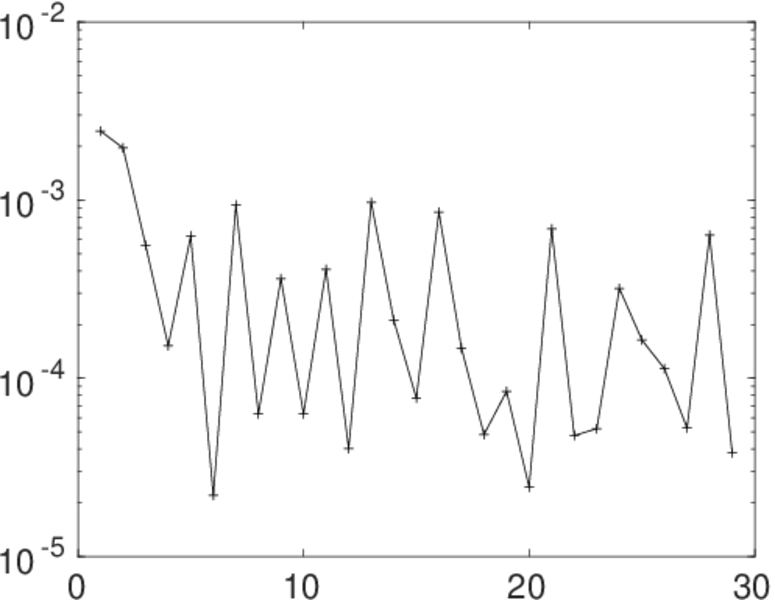
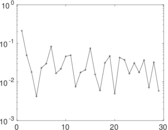
Matrix decompositions plots


Downloads
References
|
[1]
|
Jérôme Kunegis.
KONECT – The Koblenz Network Collection.
In Proc. Int. Conf. on World Wide Web Companion, pages
1343–1350, 2013.
[ http ]
|
|
[2]
|
Sören Auer, Christian Bizer, Georgi Kobilarov, Jens Lehmann, Richard Cyganiak,
and Zachary Ives.
DBpedia: A nucleus for a web of open data.
In Proc. Int. Semant. Web Conf., pages 722–735, 2008.
|
 KONECT ‣ Networks ‣
Buy Me a Coffee
KONECT ‣ Networks ‣
Buy Me a Coffee