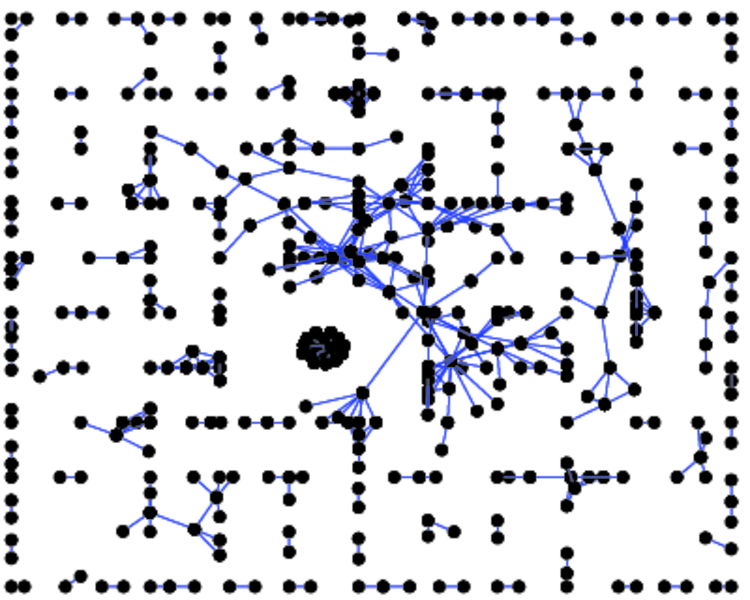
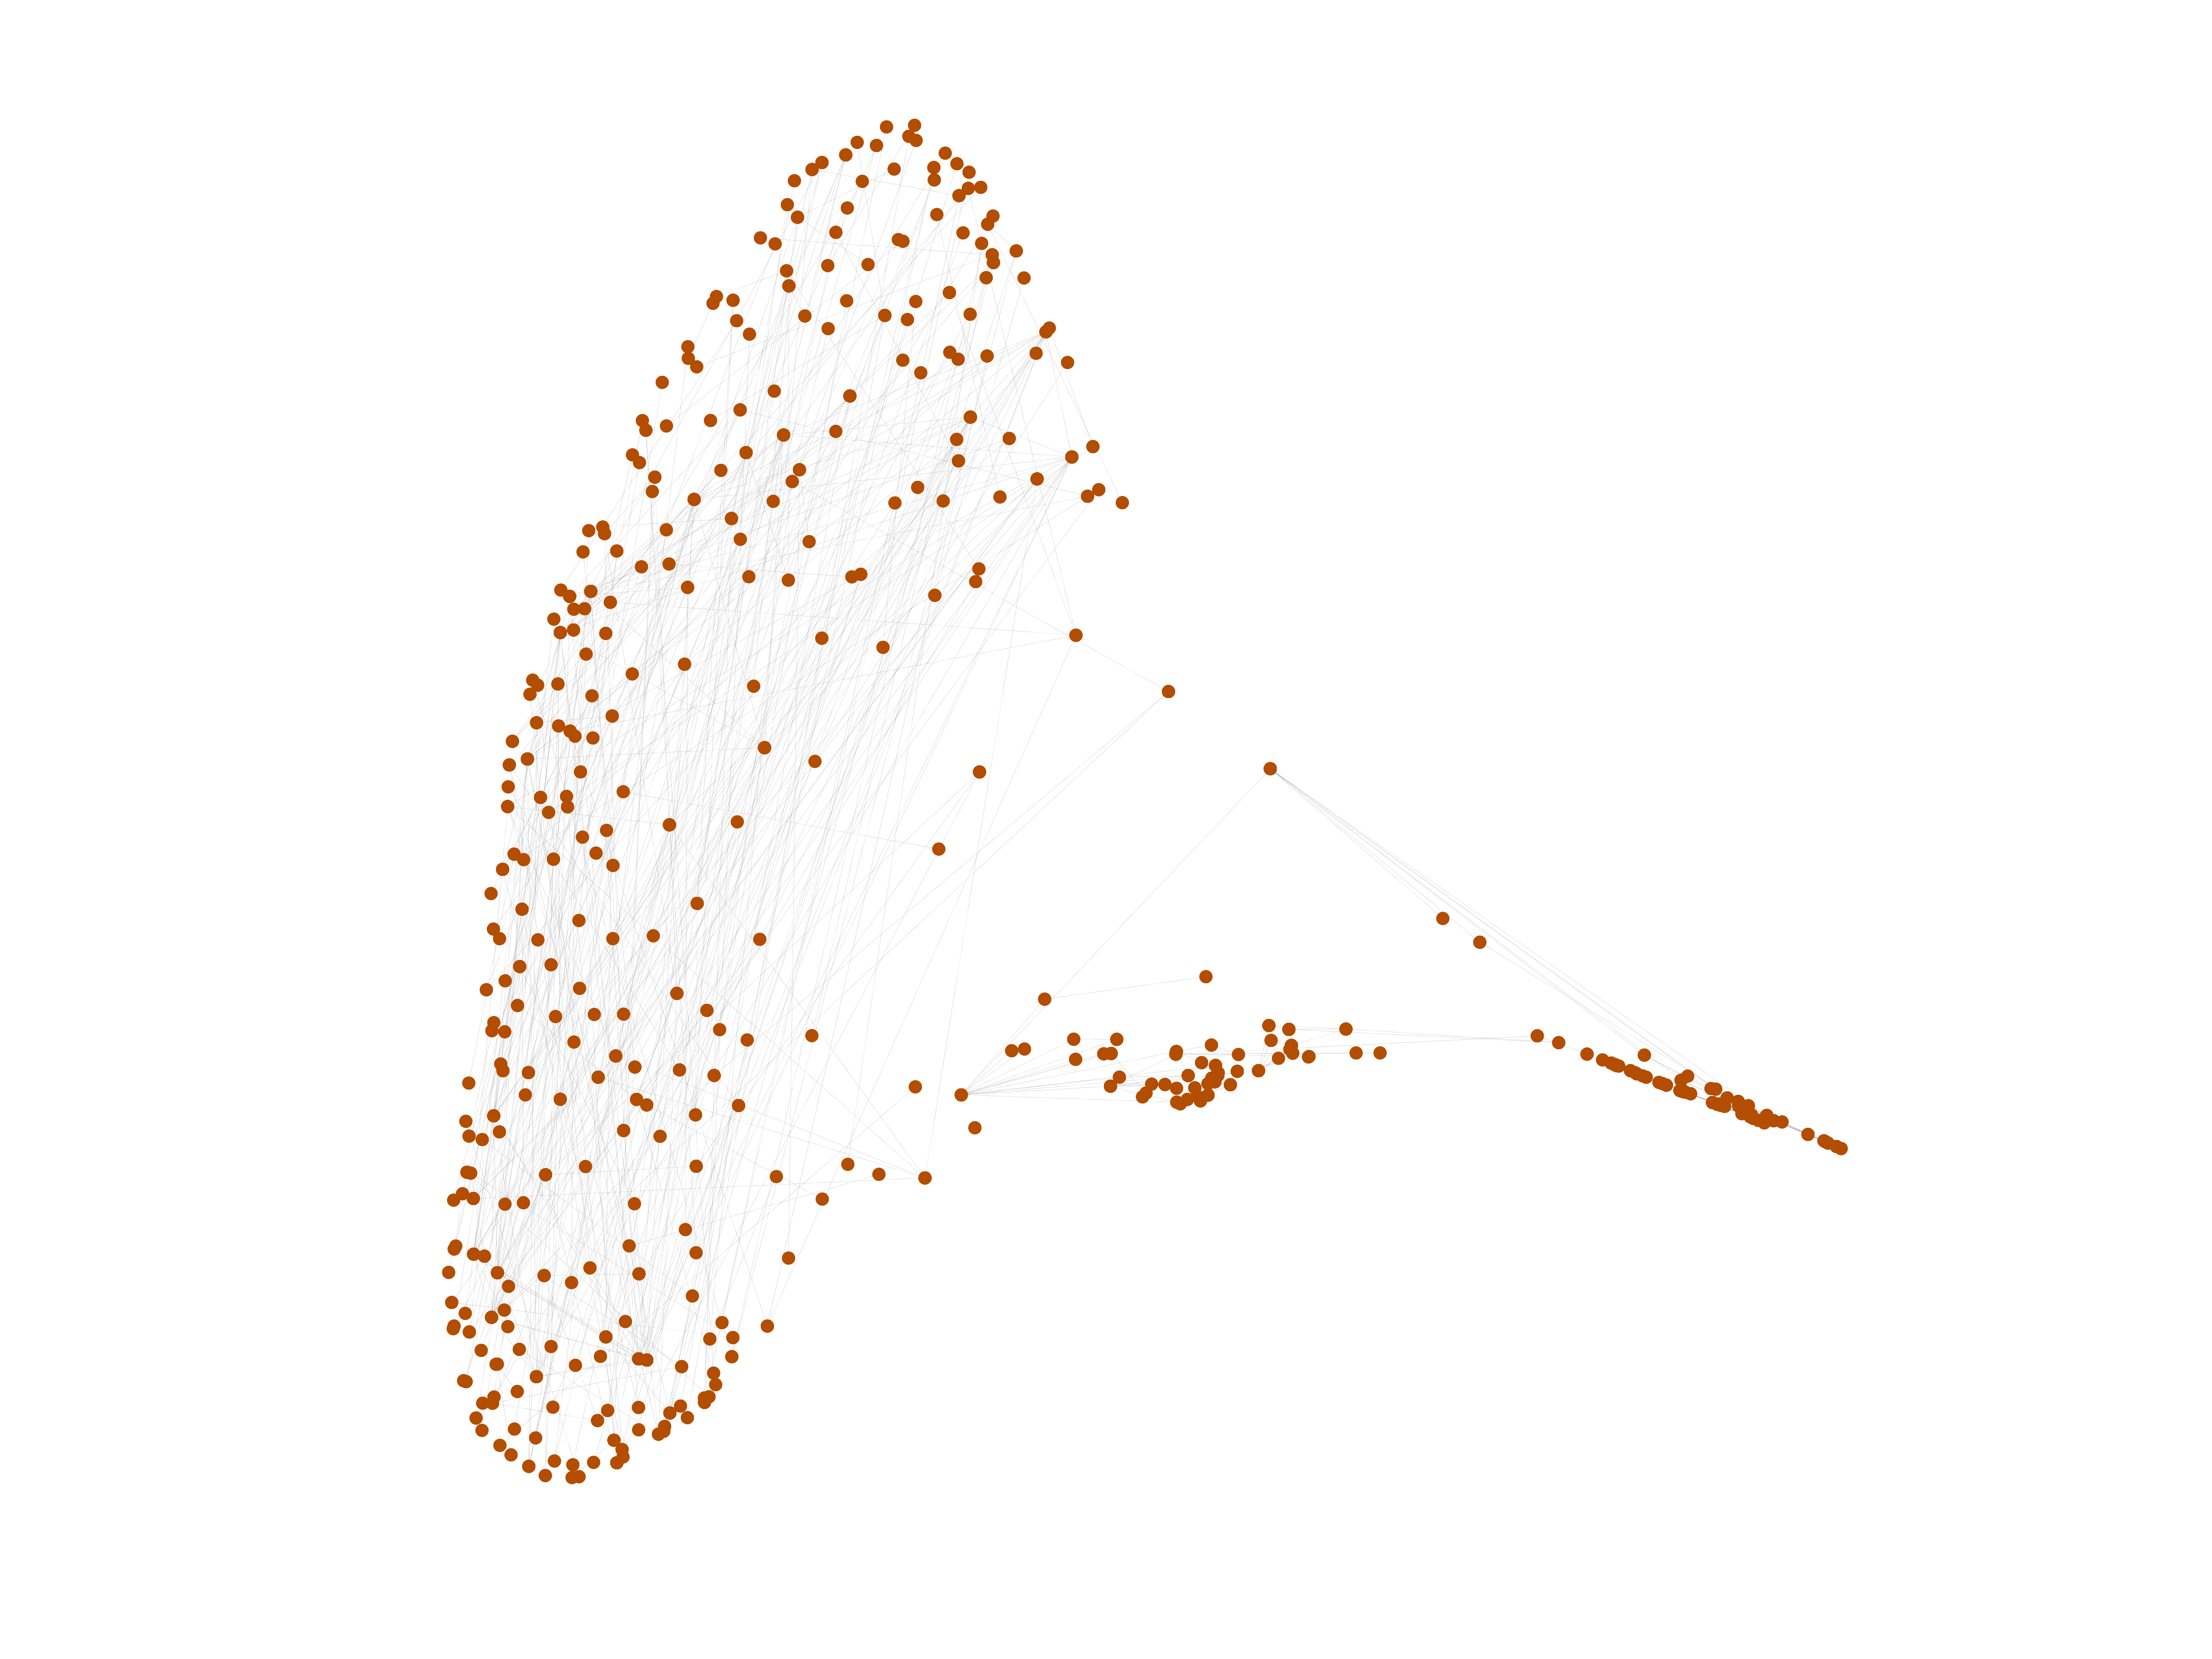
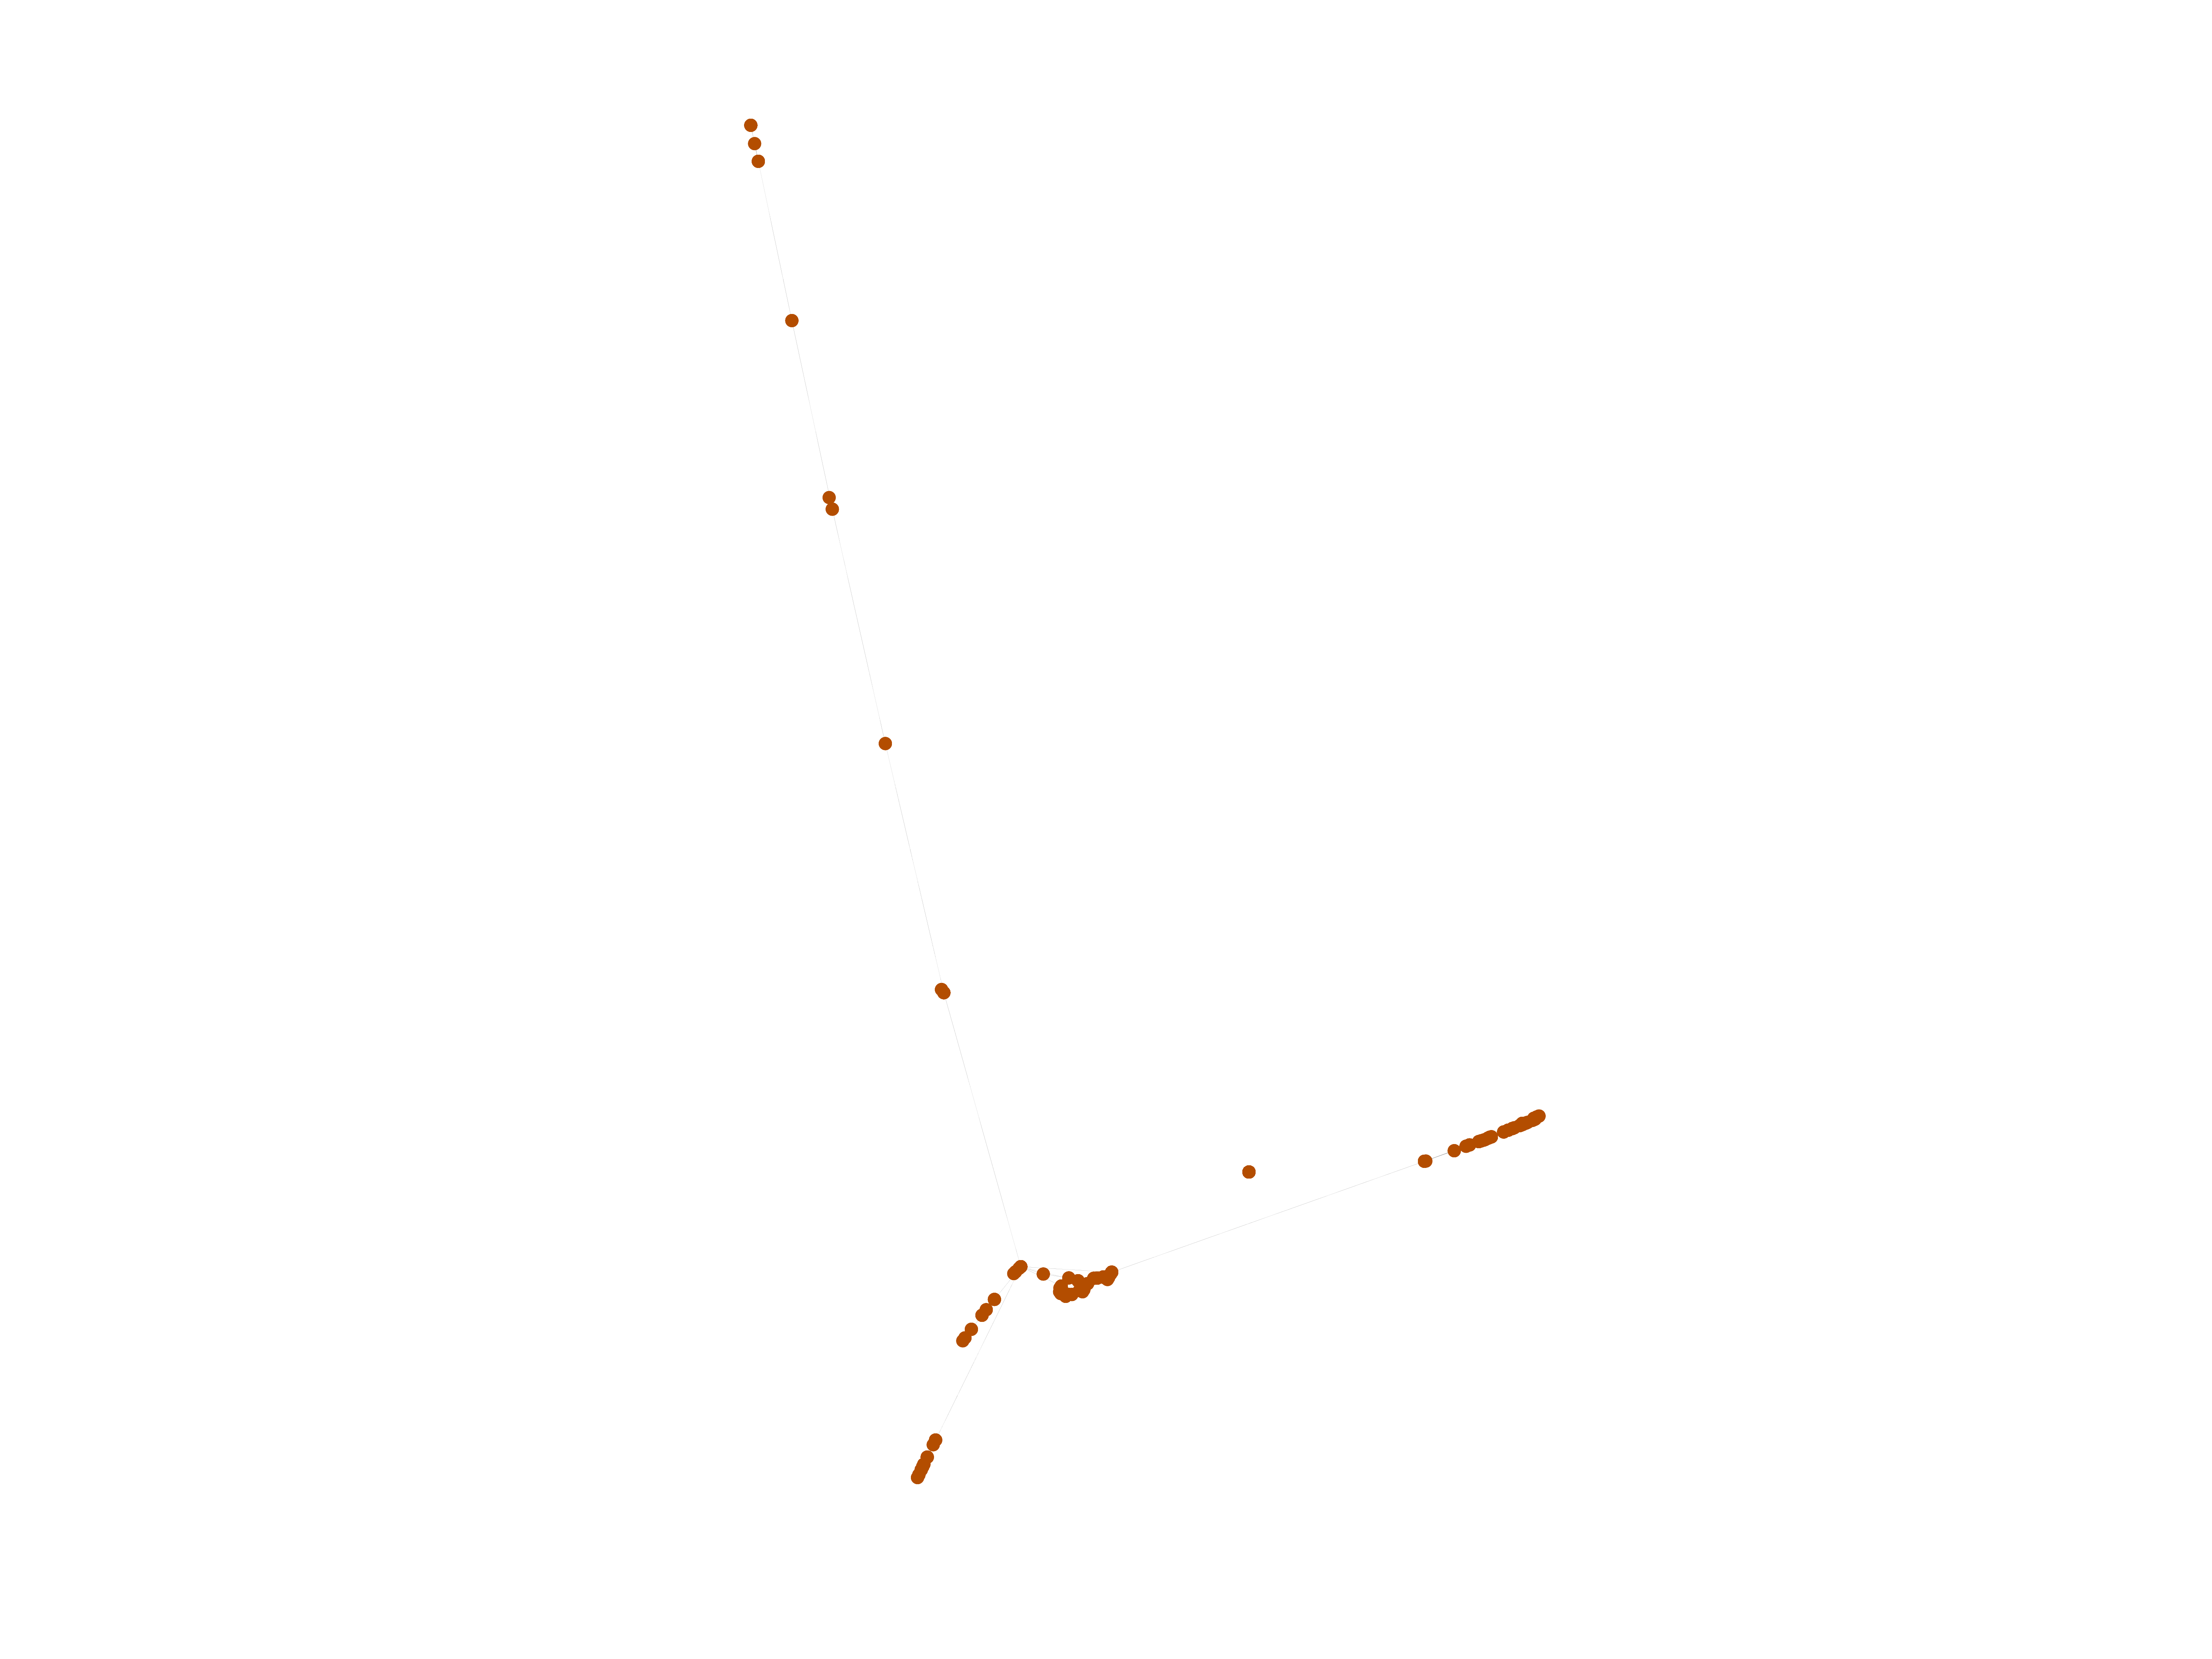
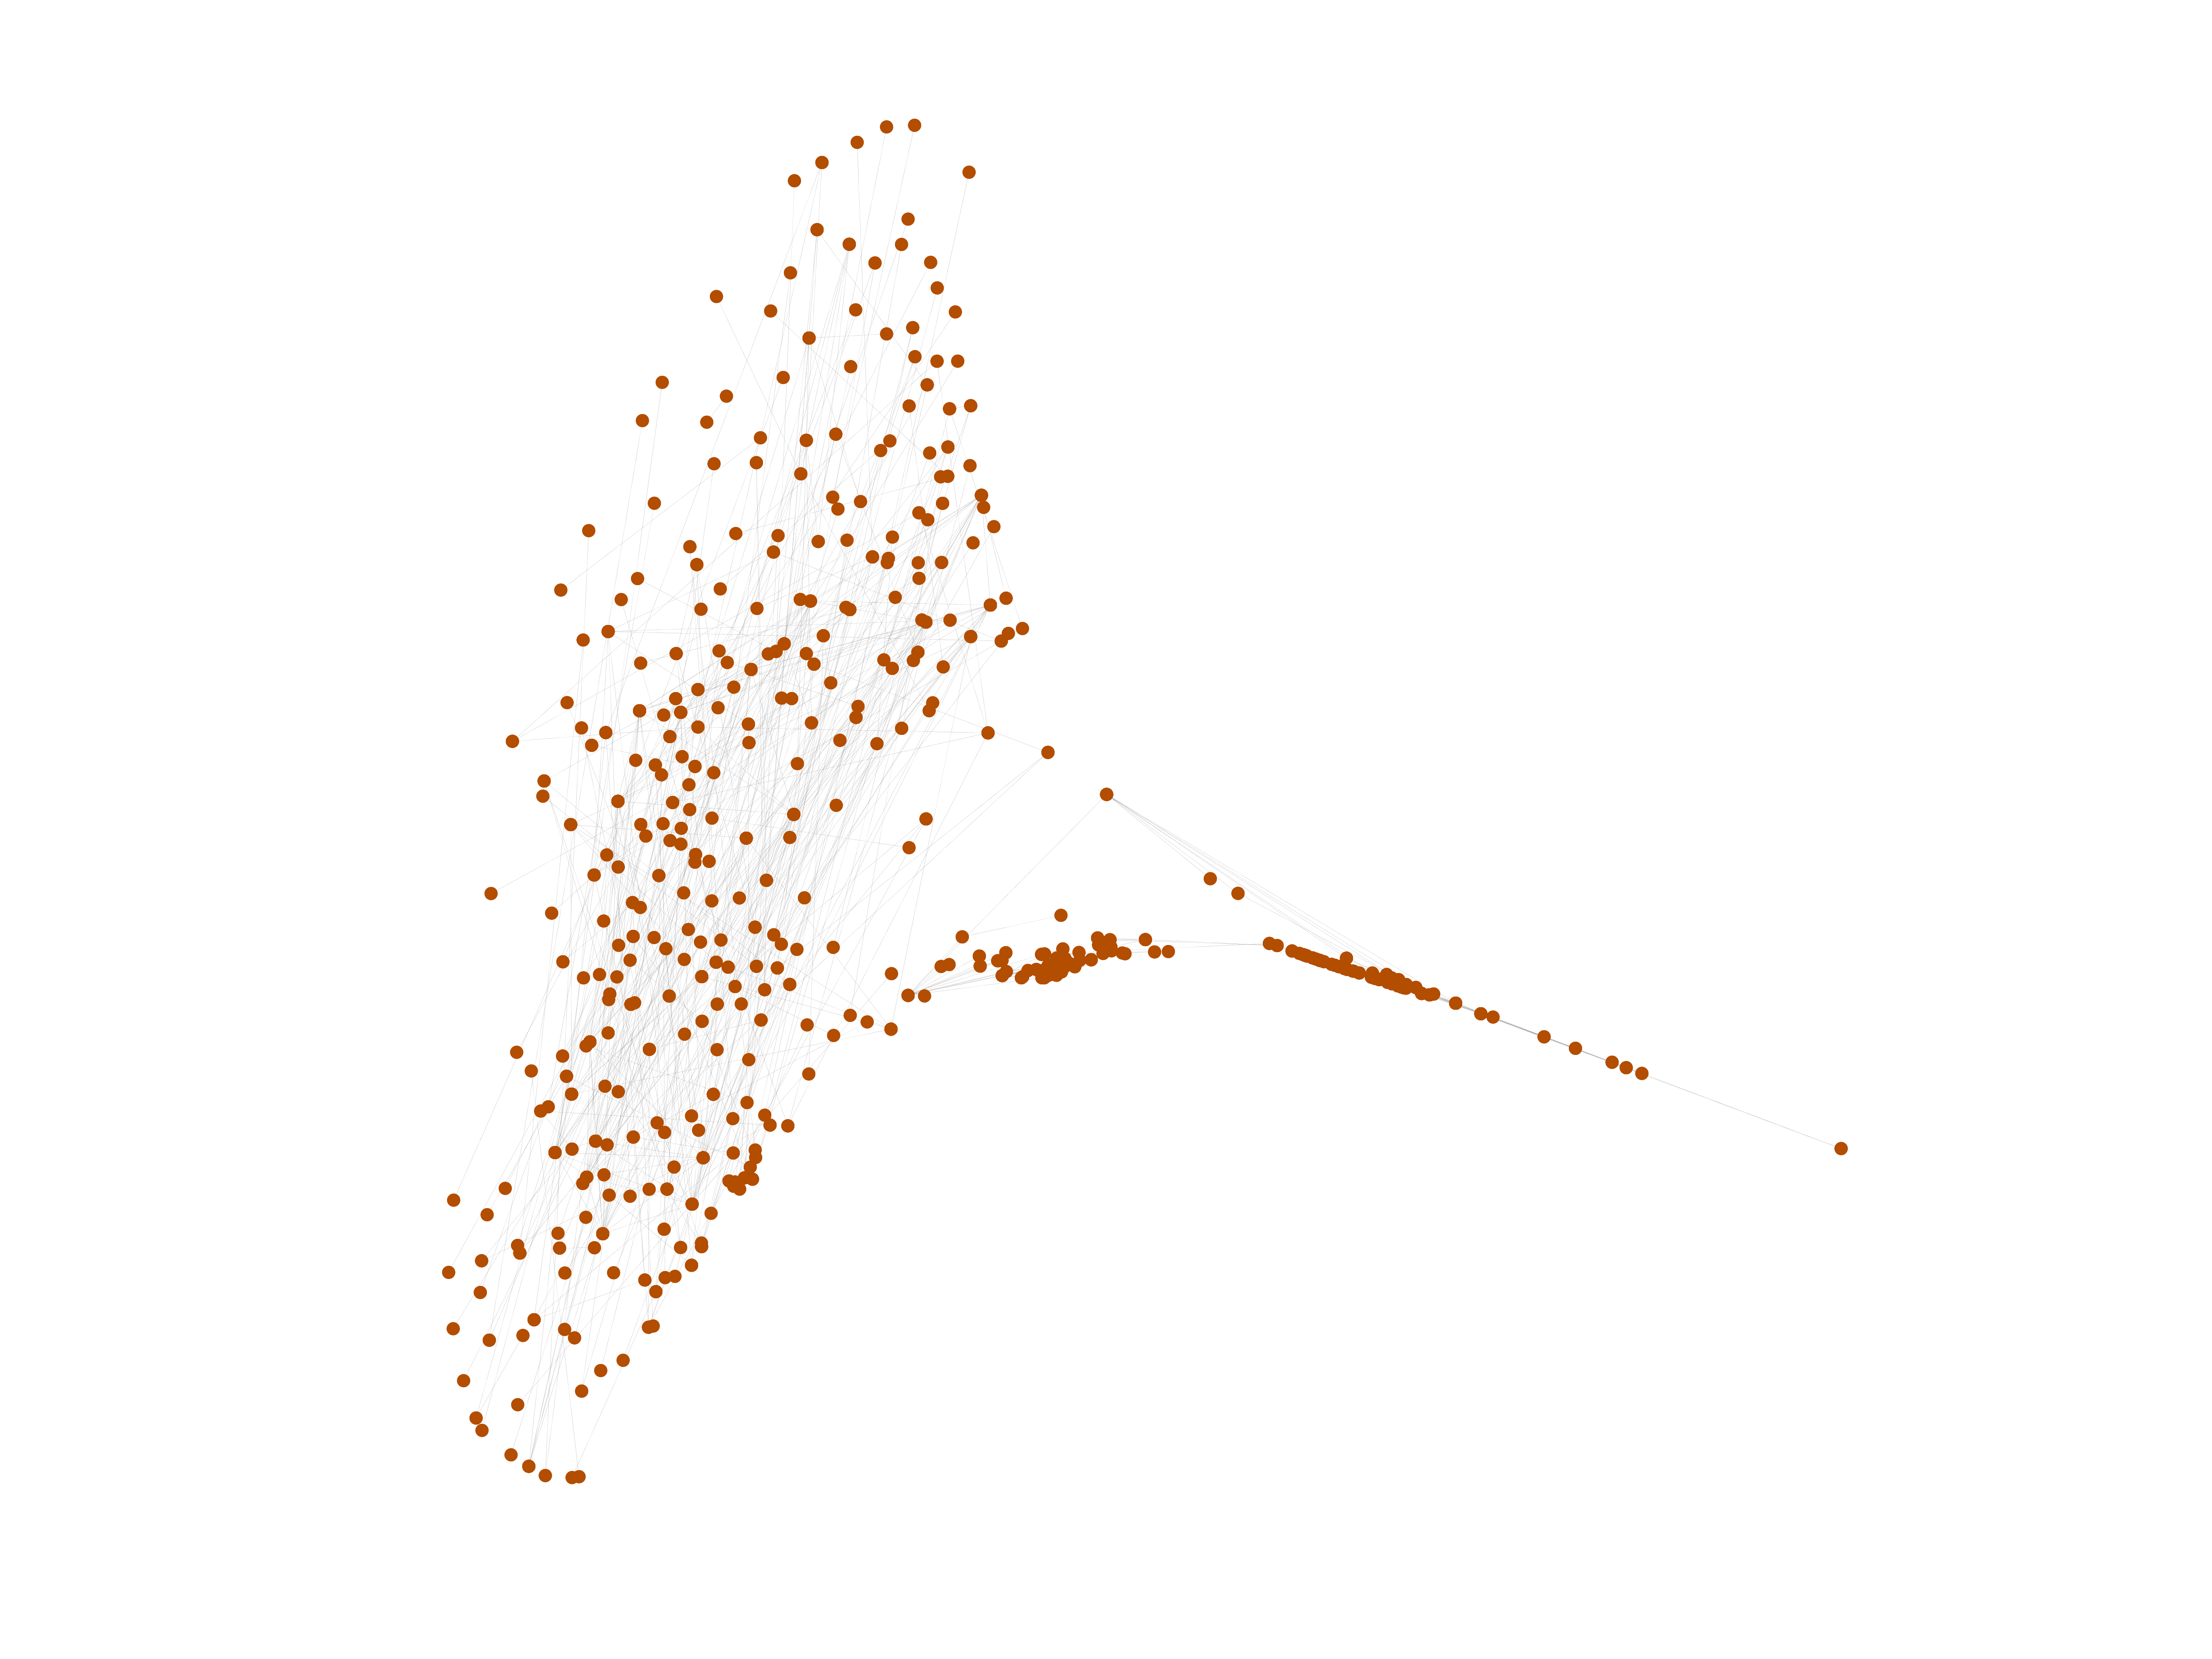
Similarities (DBpedia)
This is the similarity graph from DBpedia. It contains the "similar to" links
between pages of Wikipedia. The network is undirected and does not contain
multiple edges. The "similar to" relationship was removed from DBpedia at a
specific version. Thus, this dataset will not be updated with new versions of
DBpedia. The edges correspond to the
<http://dbpedia.org/property/similar> relationship type in DBpedia.
Metadata
Statistics
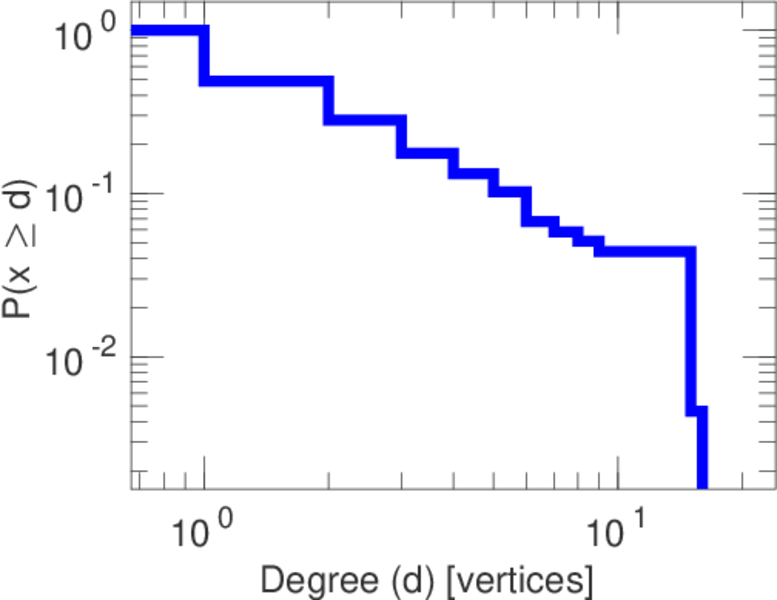
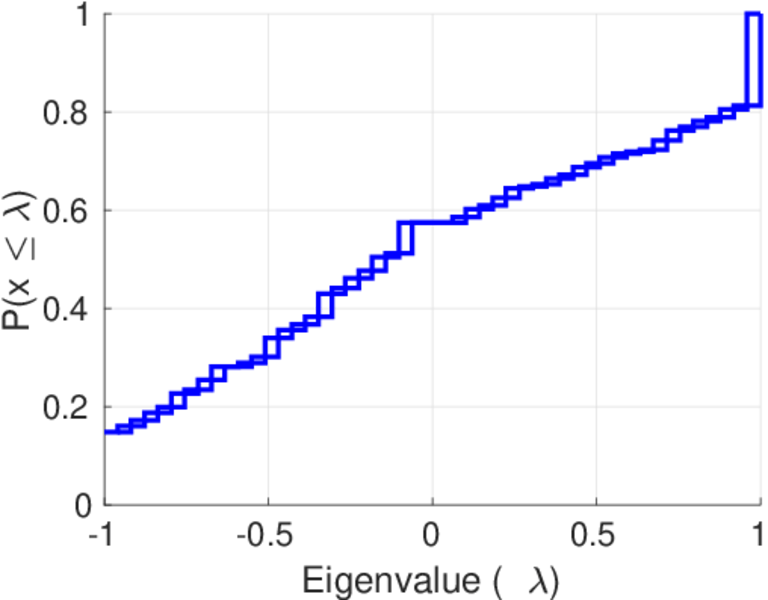
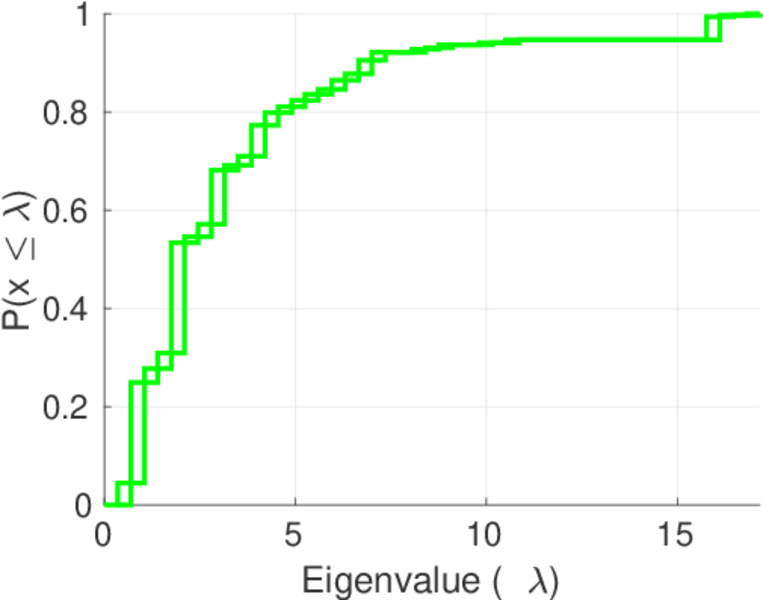
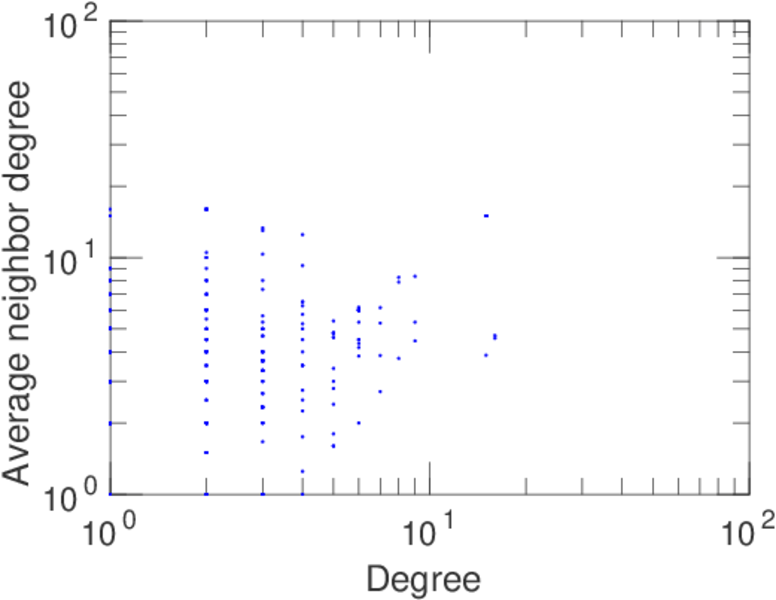
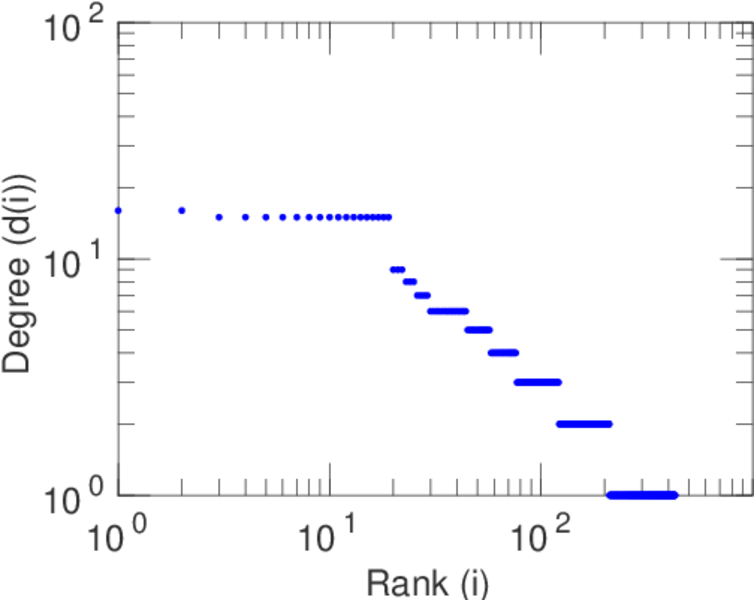
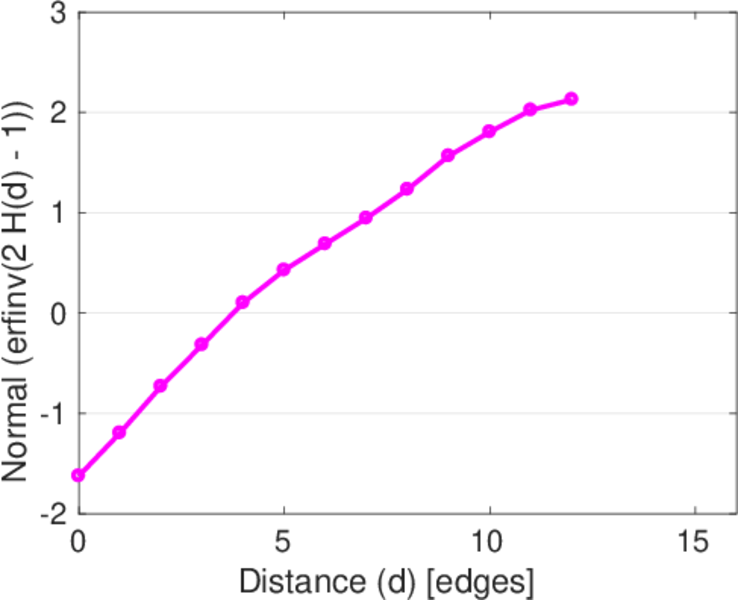
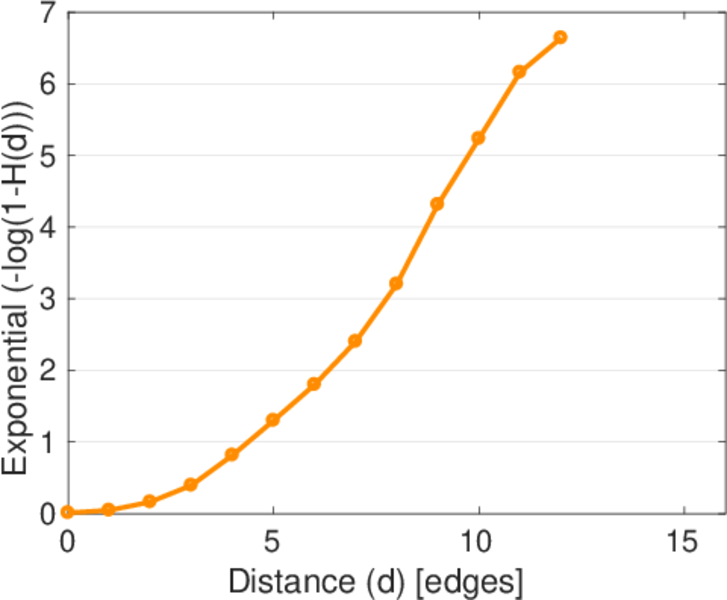
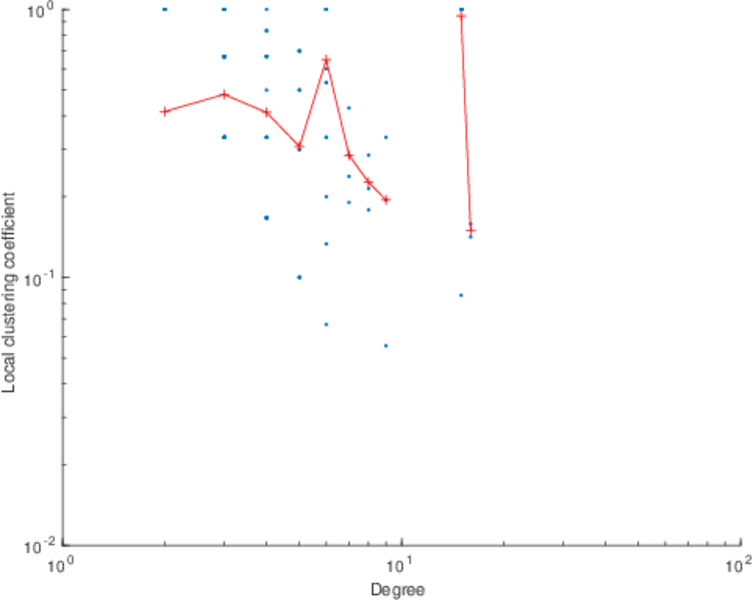
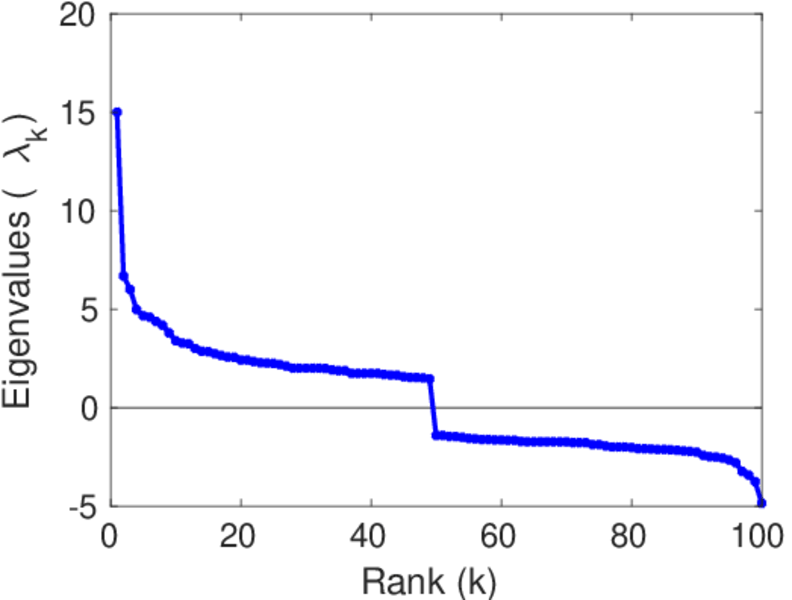
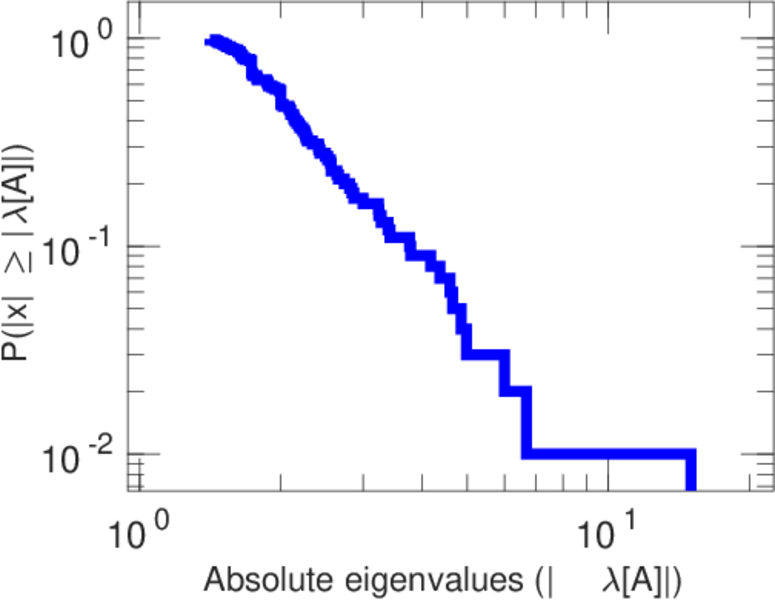
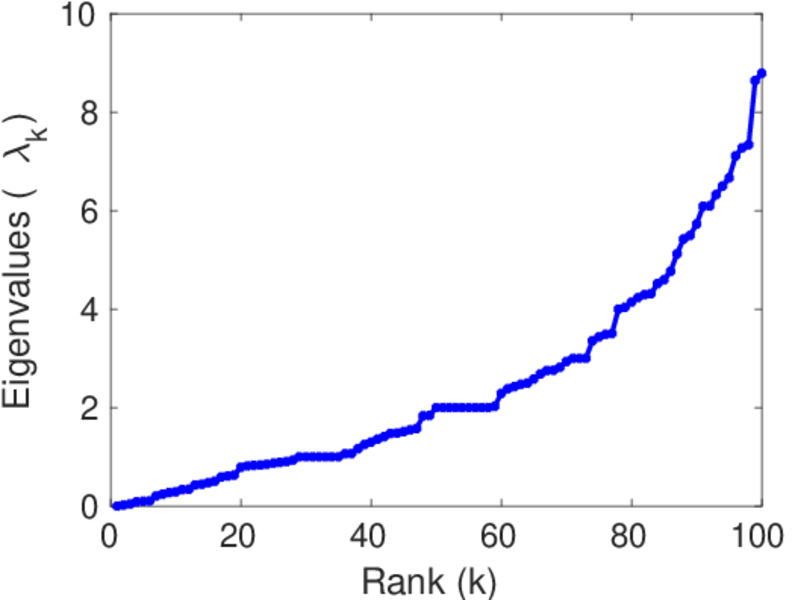
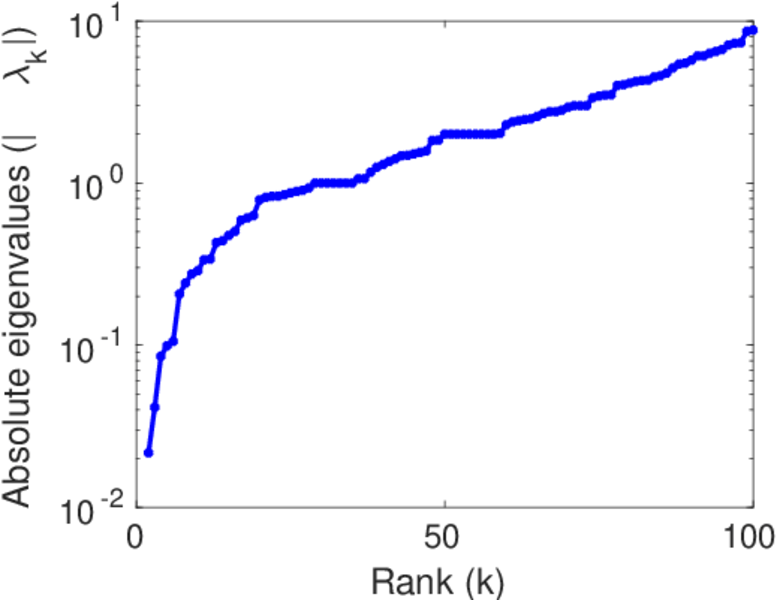
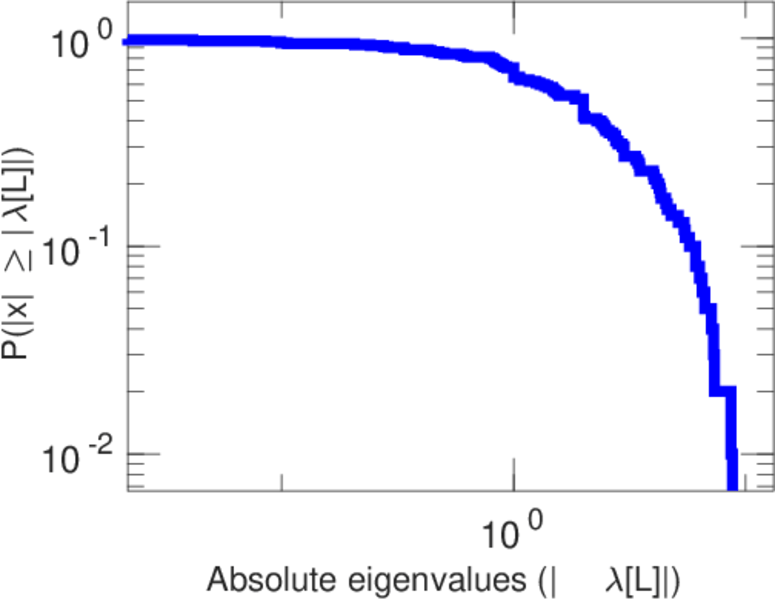
Plots


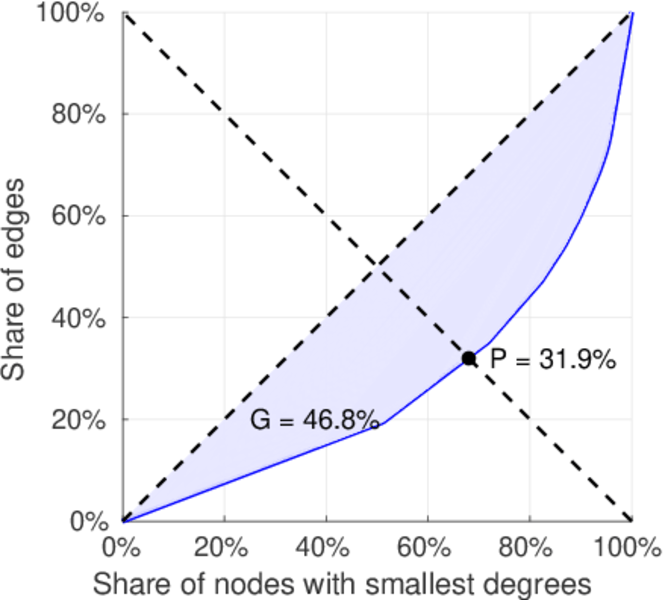
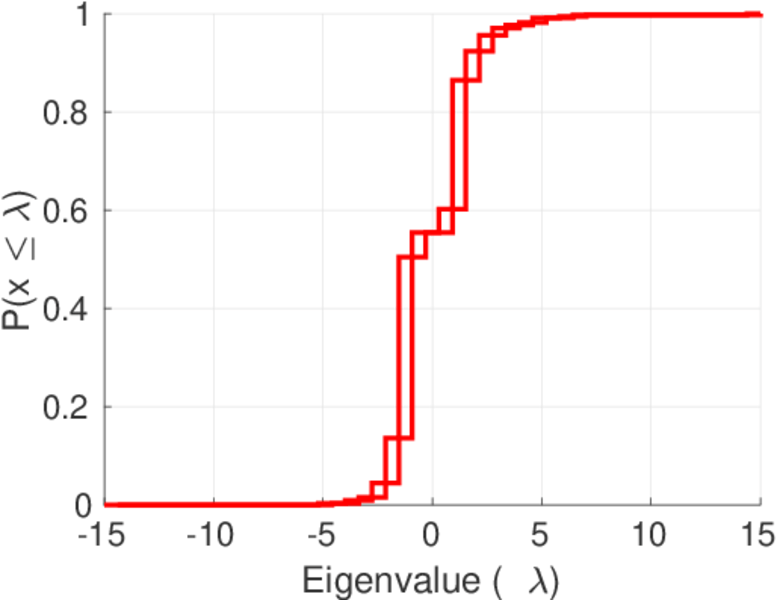
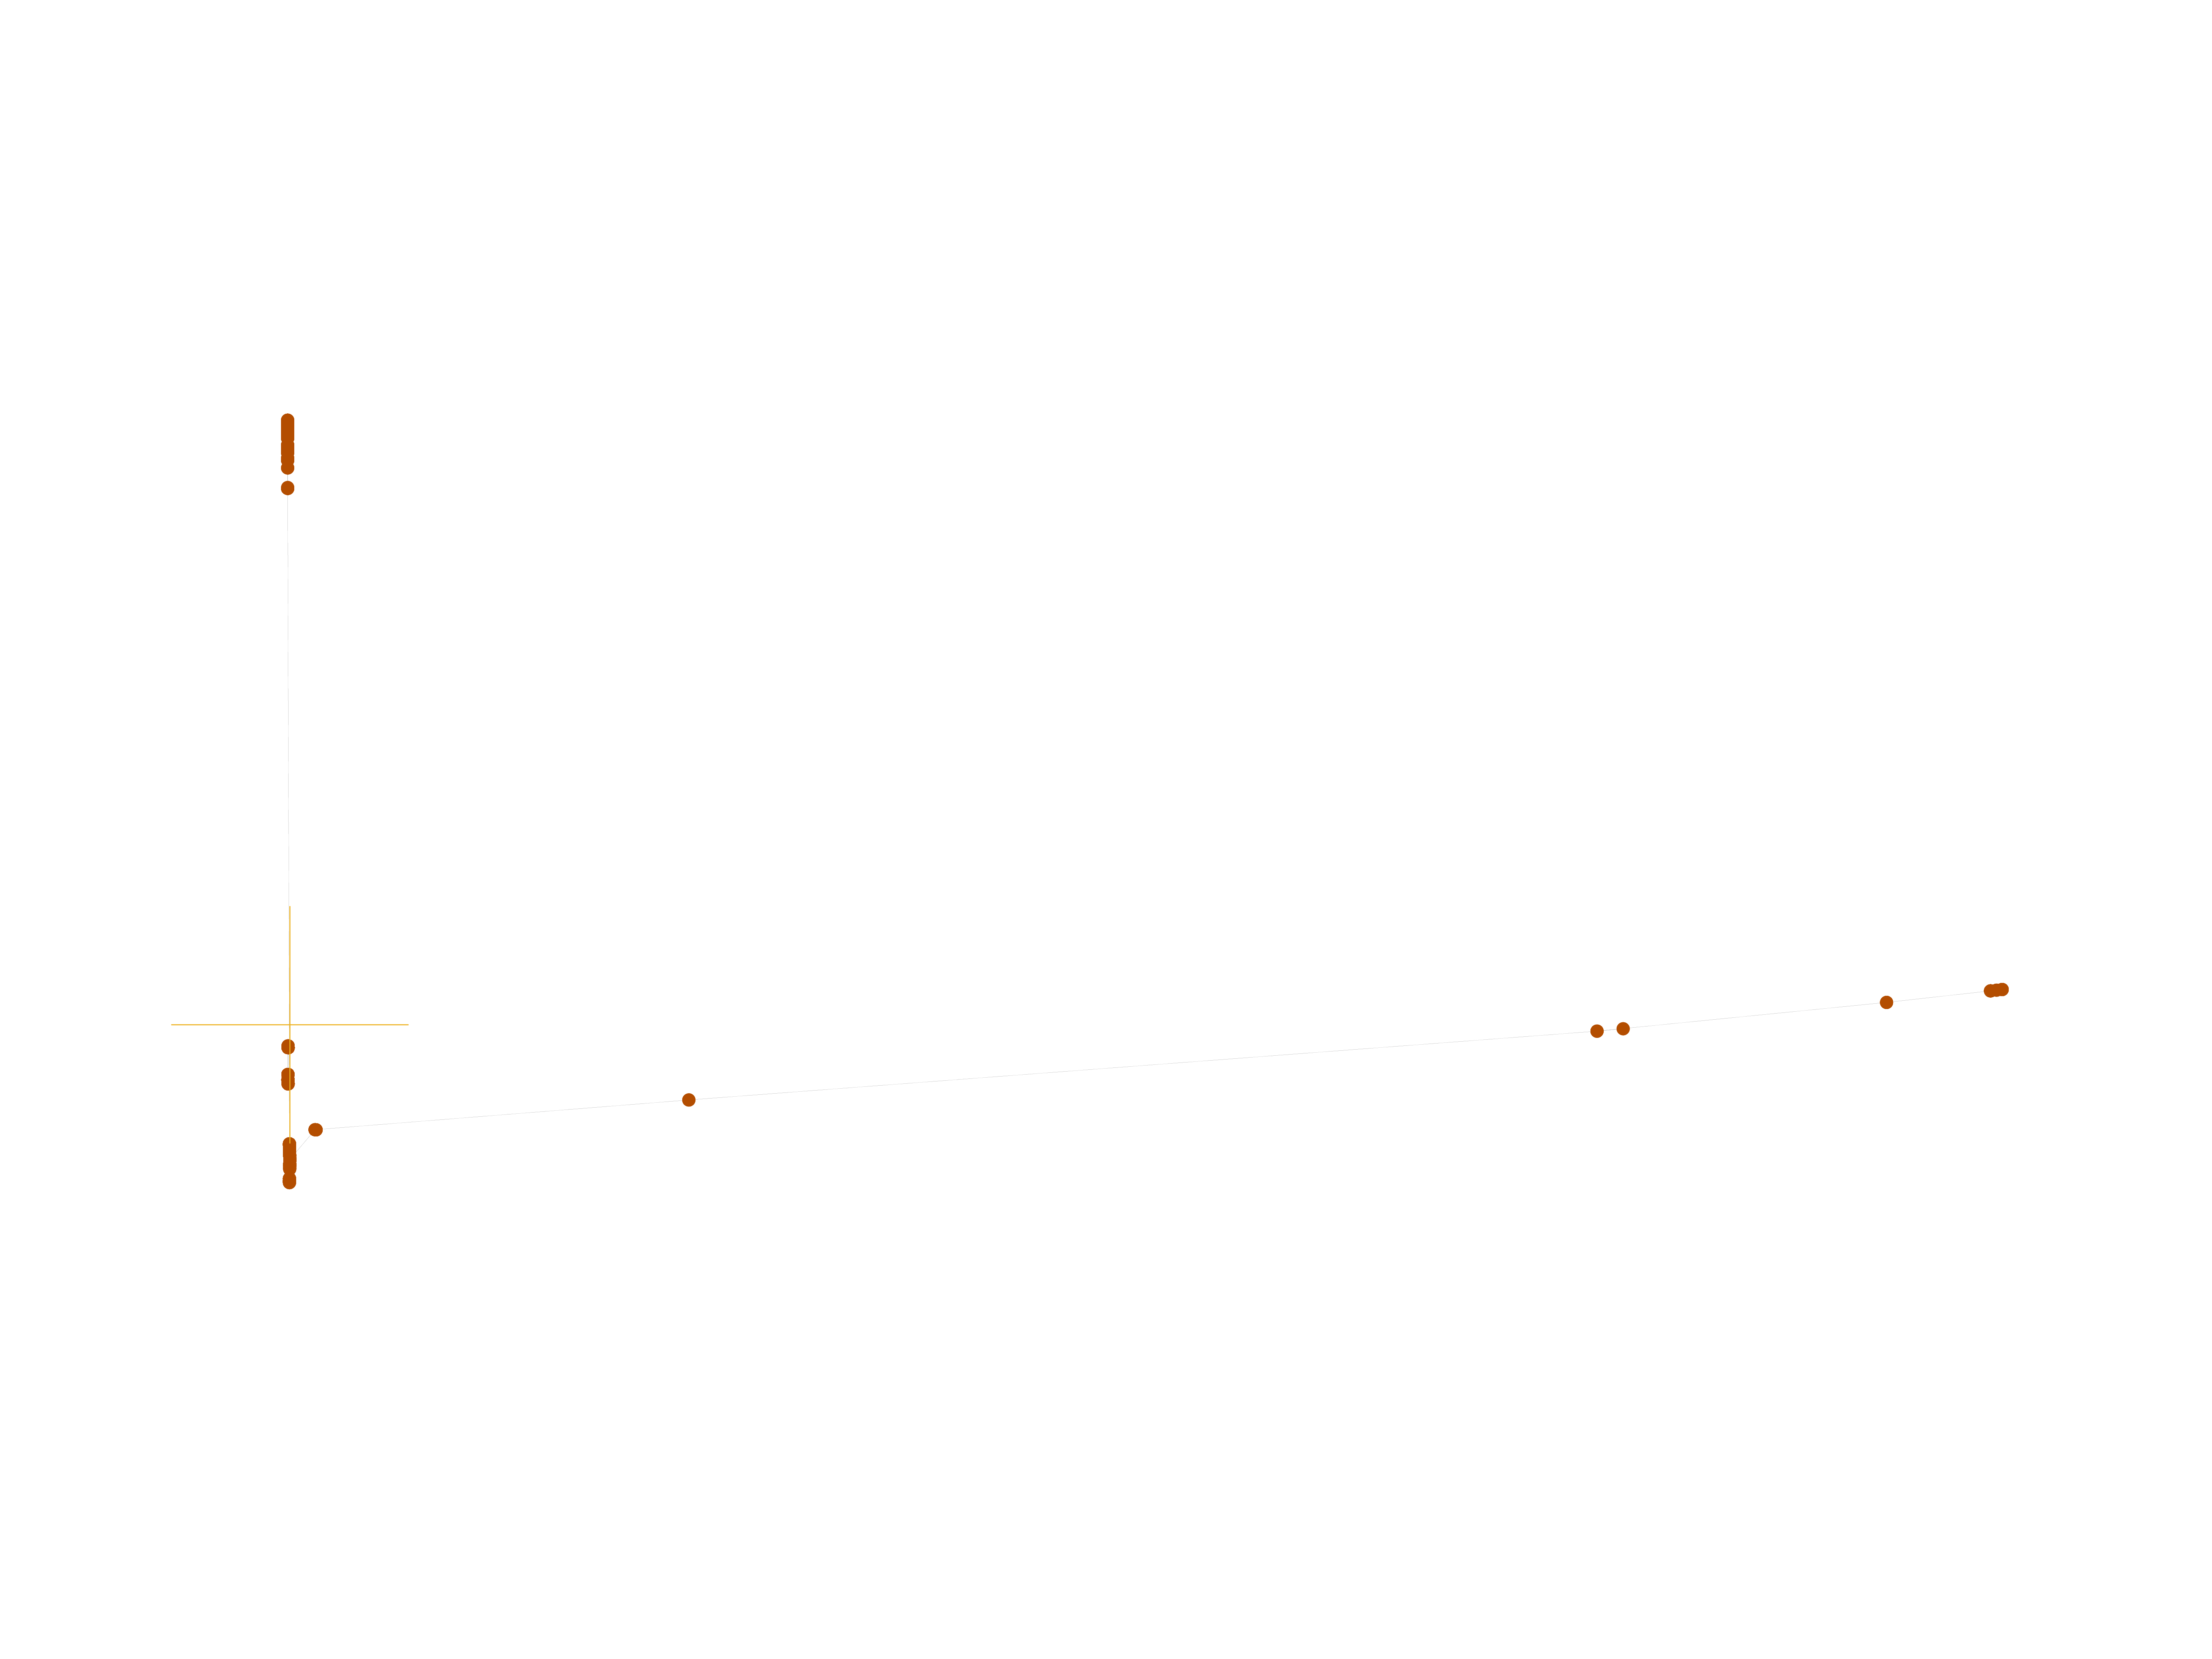
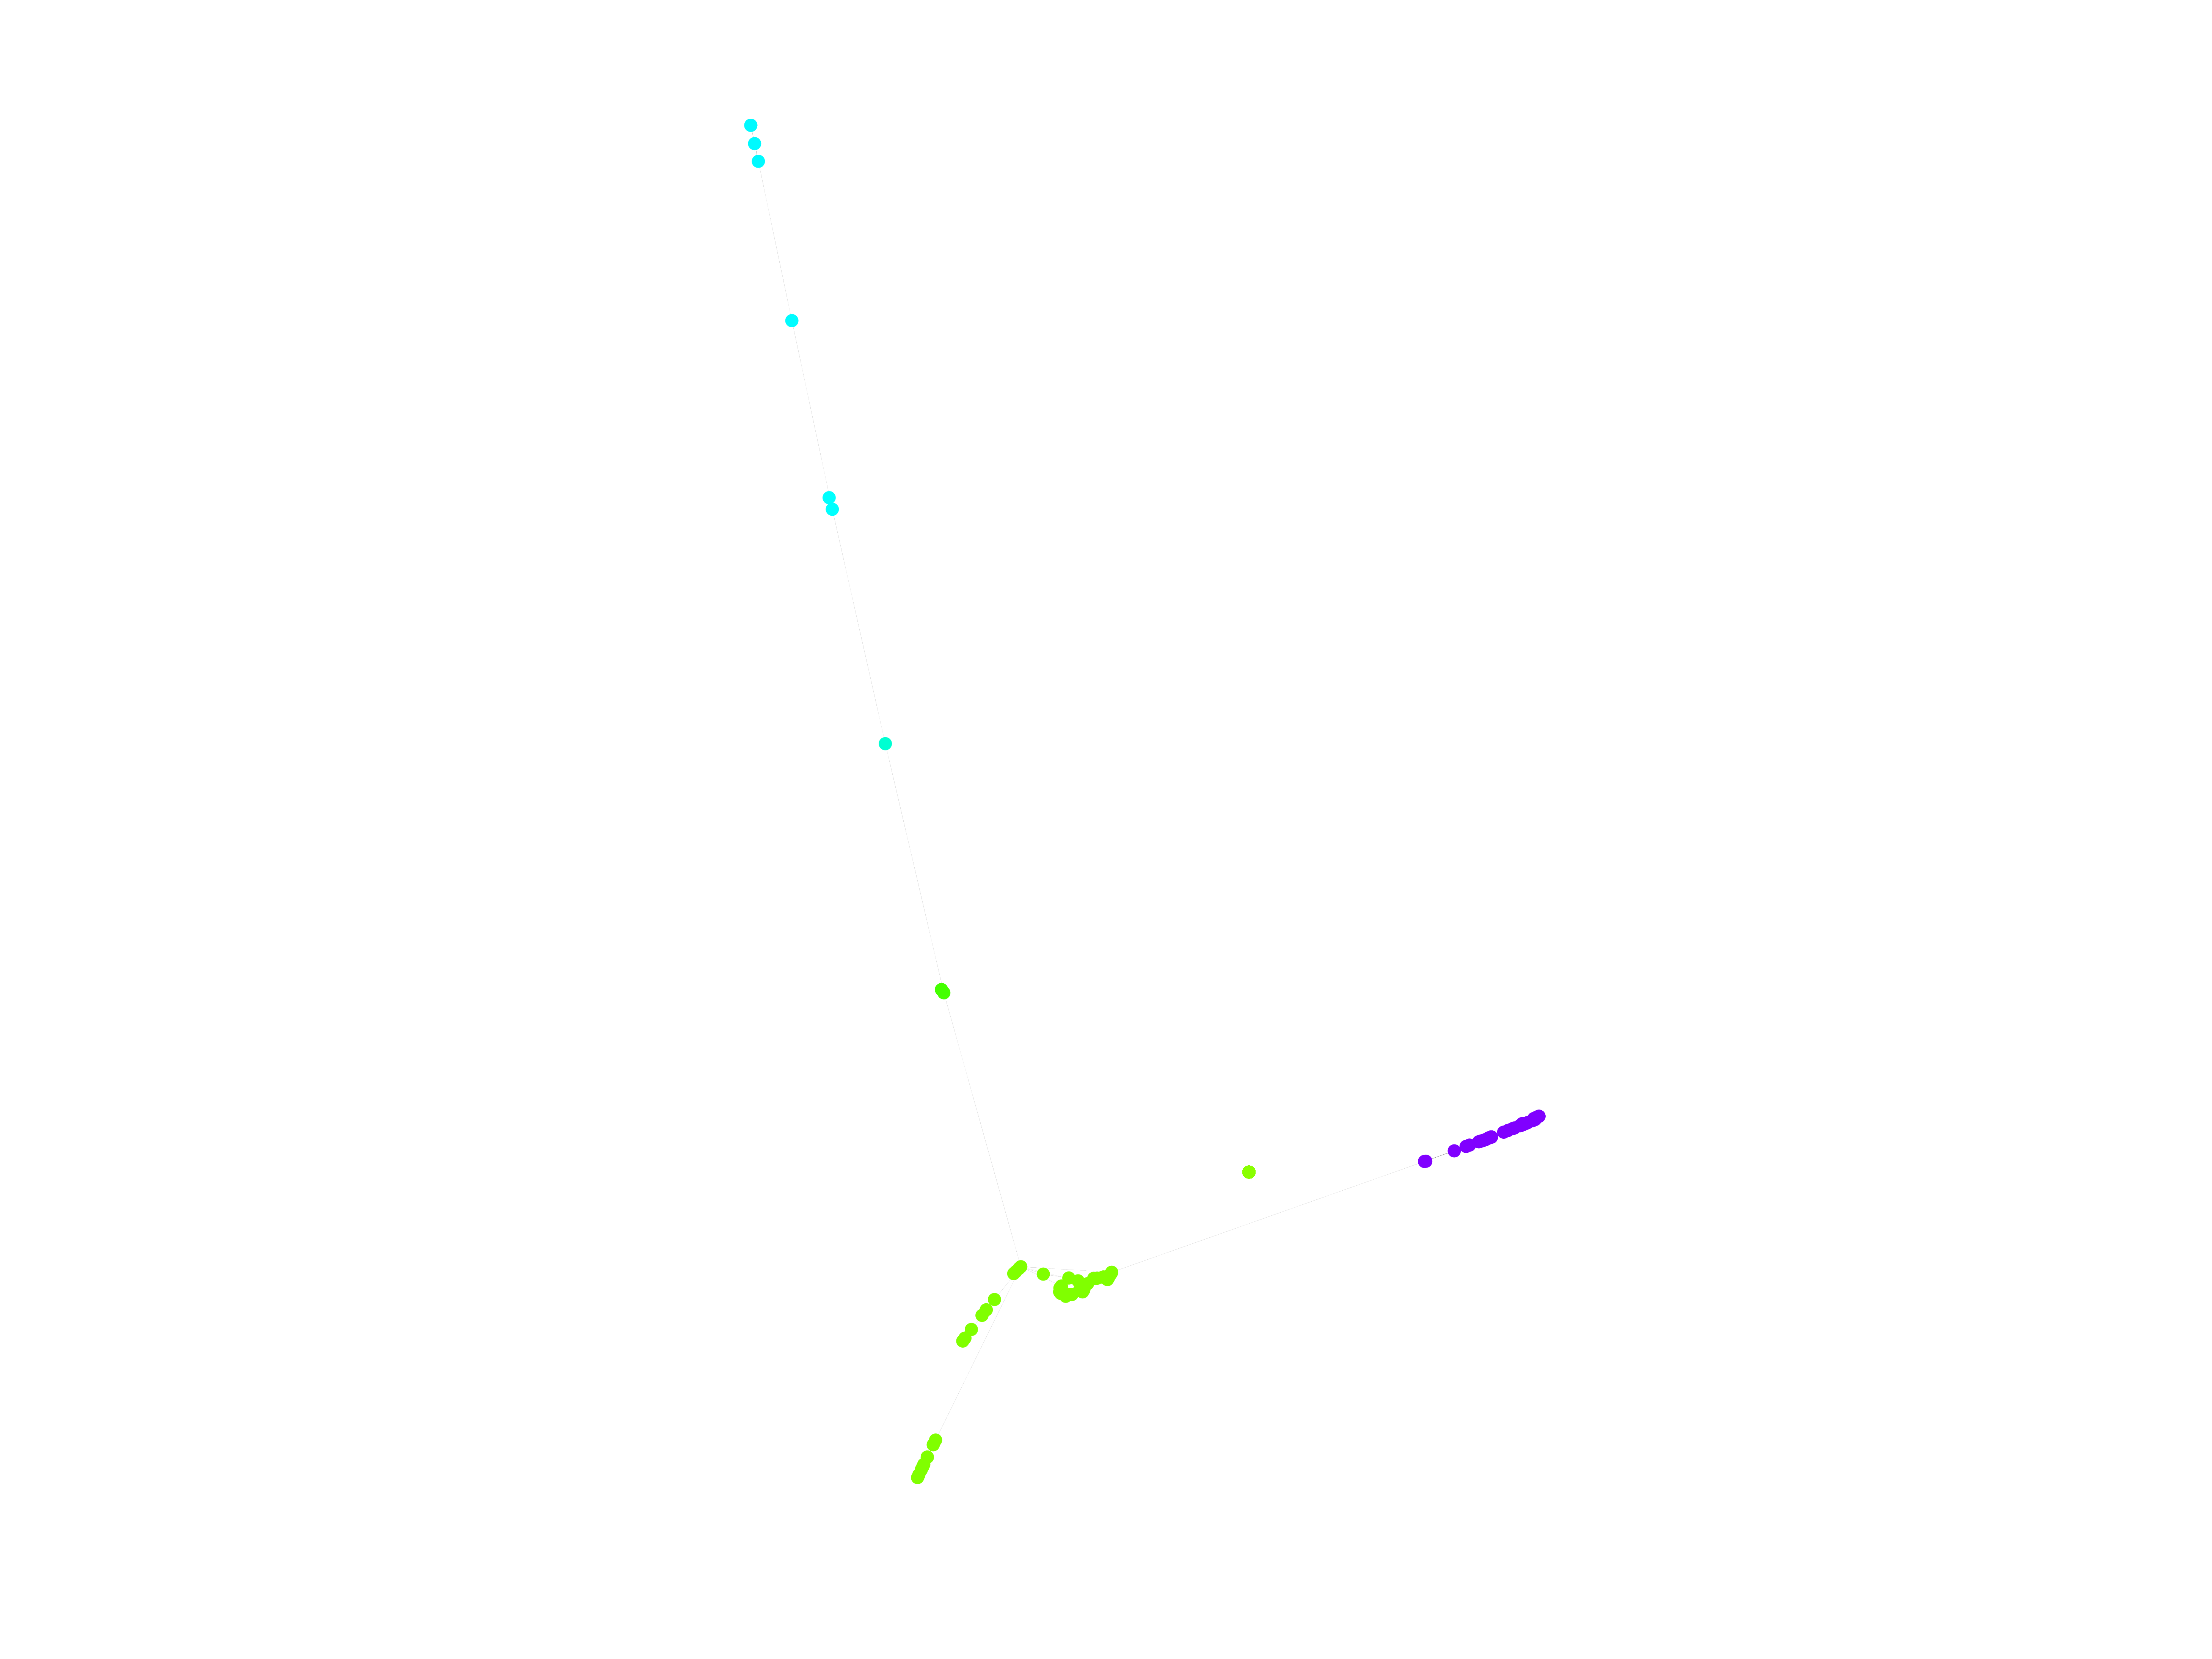
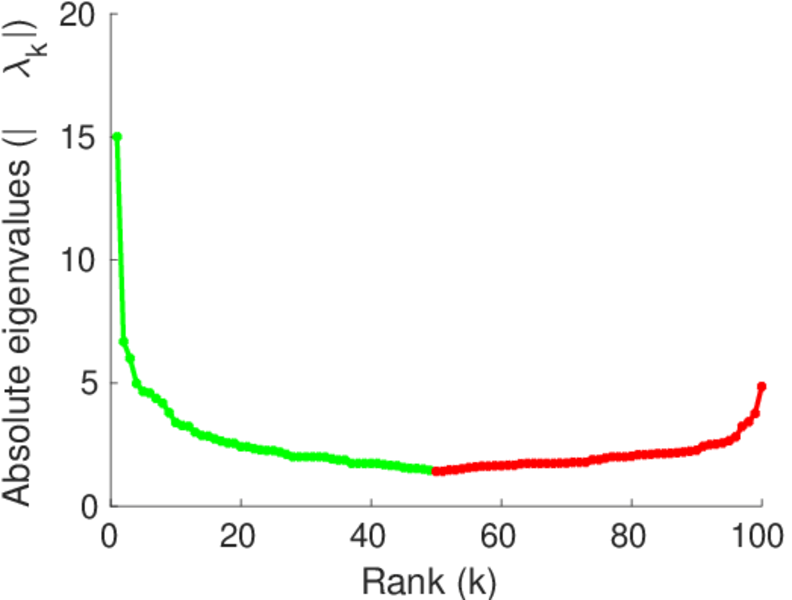
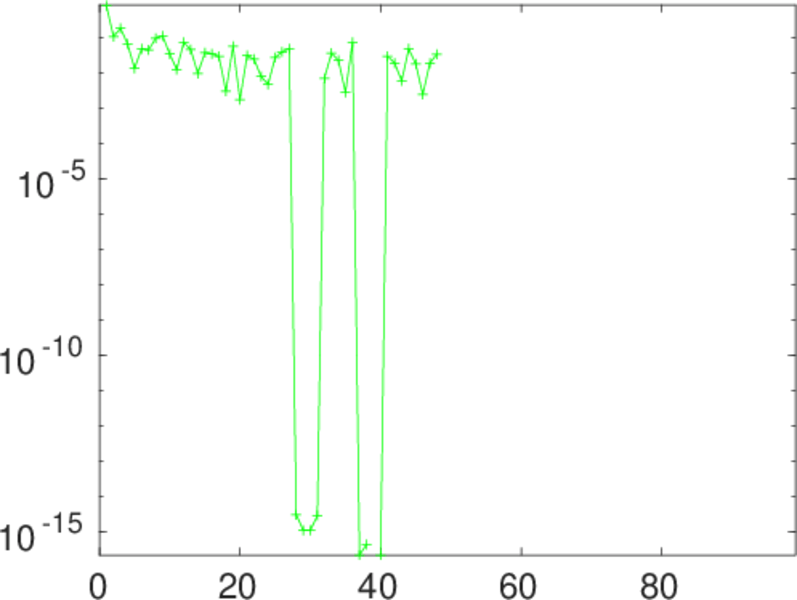
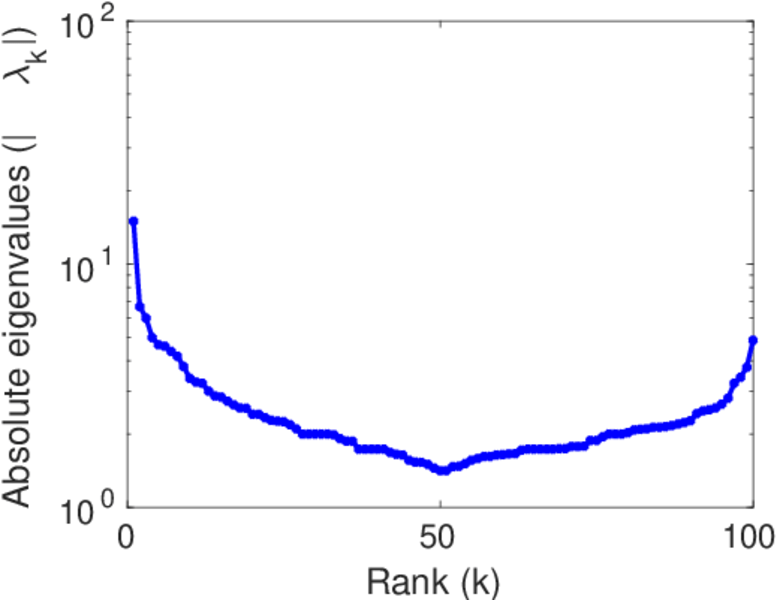
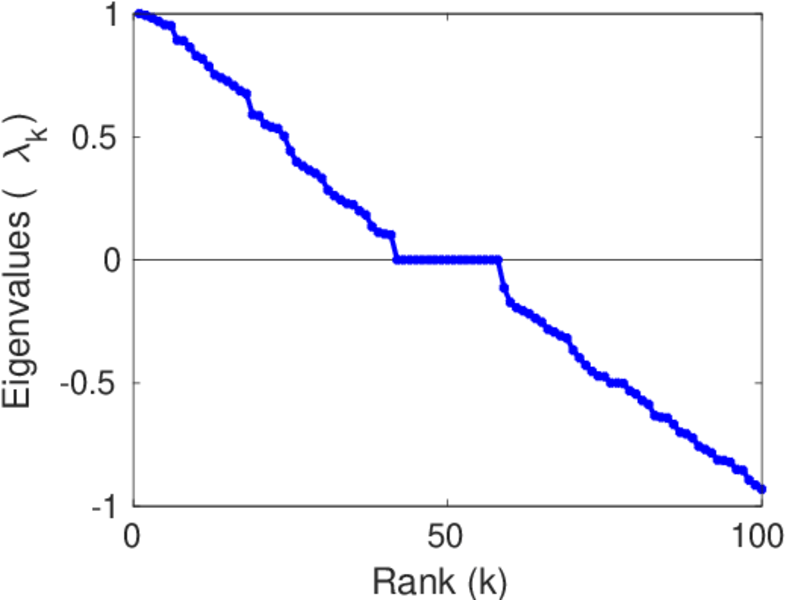
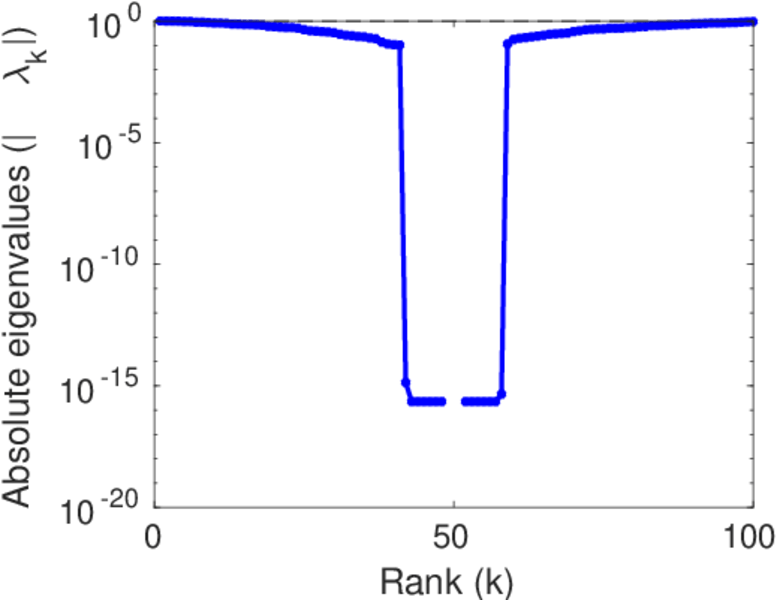
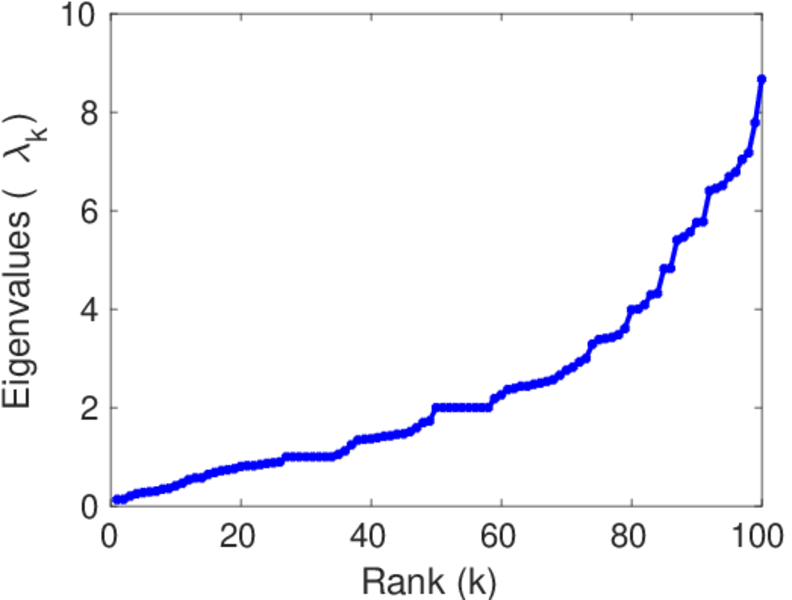
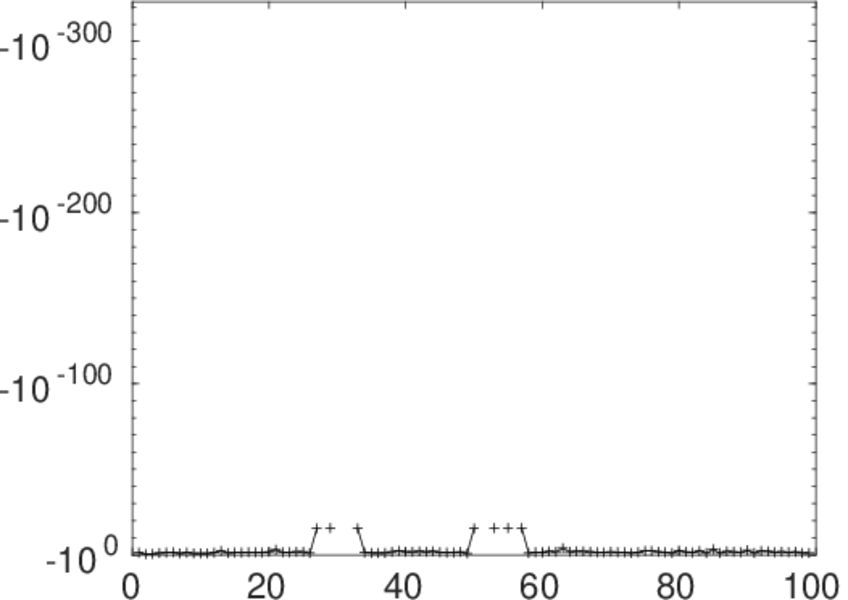
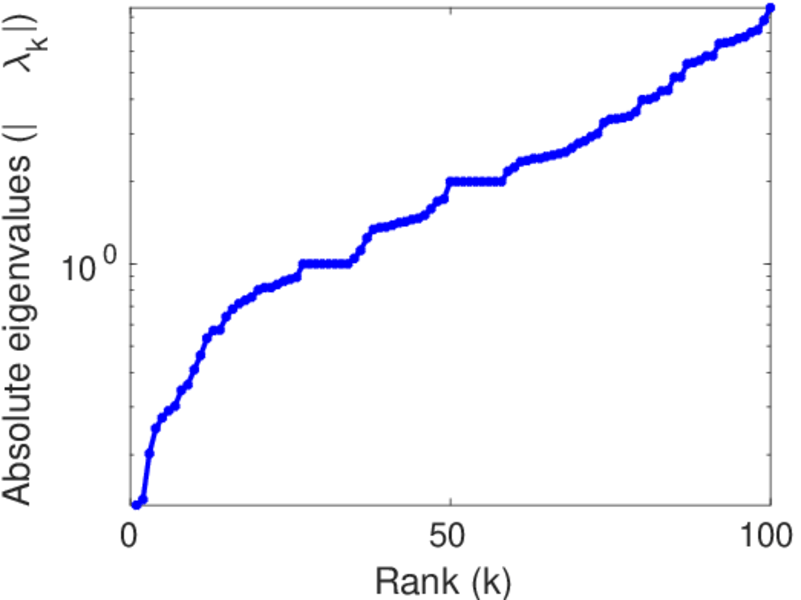
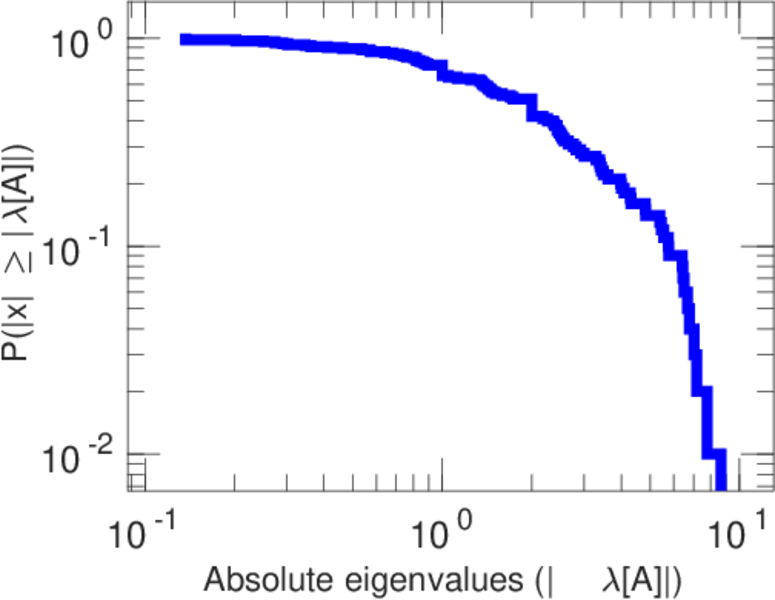
Matrix decompositions plots


Downloads
References
|
[1]
|
Jérôme Kunegis.
KONECT – The Koblenz Network Collection.
In Proc. Int. Conf. on World Wide Web Companion, pages
1343–1350, 2013.
[ http ]
|
|
[2]
|
Sören Auer, Christian Bizer, Georgi Kobilarov, Jens Lehmann, Richard Cyganiak,
and Zachary Ives.
DBpedia: A nucleus for a web of open data.
In Proc. Int. Semant. Web Conf., pages 722–735, 2008.
|
 KONECT ‣ Networks ‣
Buy Me a Coffee
KONECT ‣ Networks ‣
Buy Me a Coffee