Teams
The is the bipartite network of athletes and their teams, extracted from
DBpedia. The nodes in the network are individual athletes and individual teams.
An edge in the network connects an athlete with a team the athlete has played
in. The dataset was extracted from DBpedia and corresponds to the
<http://dbpedia.org/ontology/team> relationship type.
Metadata
Statistics
| Size | n = | 935,627
|
| Left size | n1 = | 901,166
|
| Right size | n2 = | 34,461
|
| Volume | m = | 1,366,466
|
| Wedge count | s = | 336,279,376
|
| Claw count | z = | 117,855,347,259
|
| Cross count | x = | 42,549,380,095,569
|
| Square count | q = | 10,778,376
|
| 4-Tour count | T4 = | 1,434,091,924
|
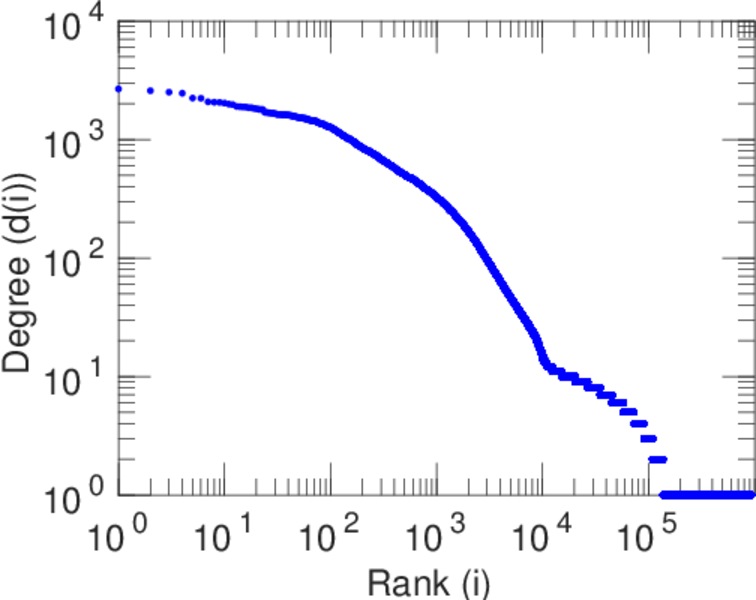
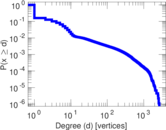
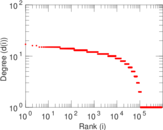
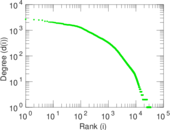
| Maximum degree | dmax = | 2,671
|
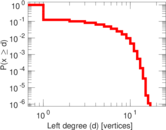
| Maximum left degree | d1max = | 17
|
| Maximum right degree | d2max = | 2,671
|
| Average degree | d = | 2.920 96
|
| Average left degree | d1 = | 1.516 33
|
| Average right degree | d2 = | 39.652 5
|
| Fill | p = | 4.400 14 × 10−5
|
| Size of LCC | N = | 876,025
|
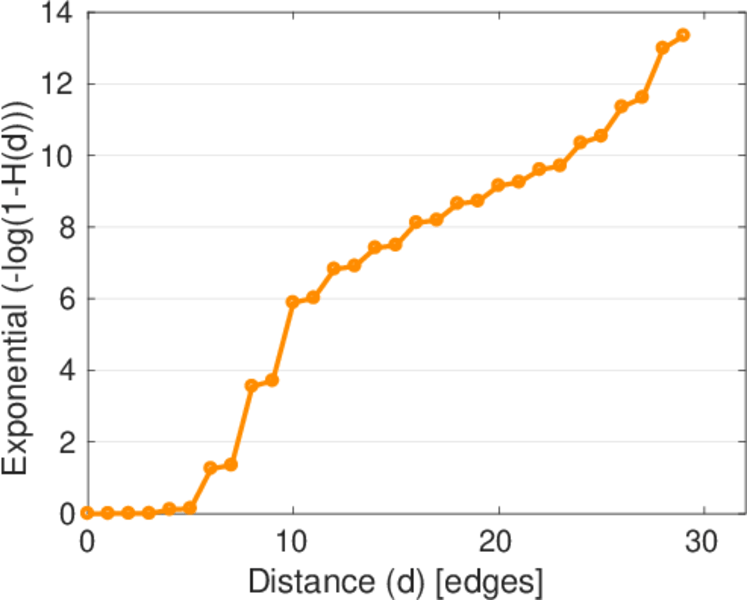
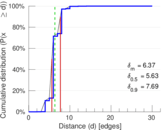
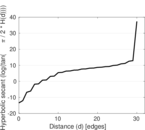
| Diameter | δ = | 41
|
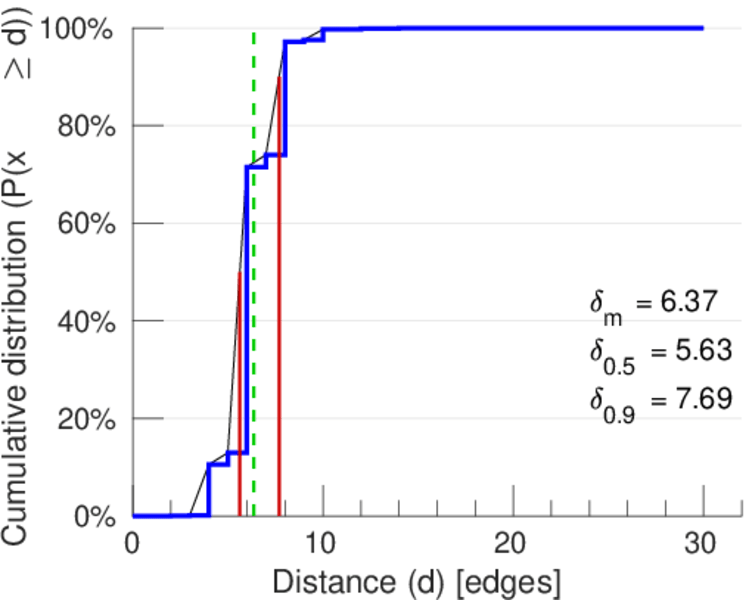
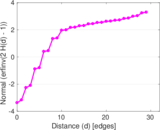
| 50-Percentile effective diameter | δ0.5 = | 5.632 65
|
| 90-Percentile effective diameter | δ0.9 = | 7.691 47
|
| Median distance | δM = | 6
|
| Mean distance | δm = | 6.370 73
|
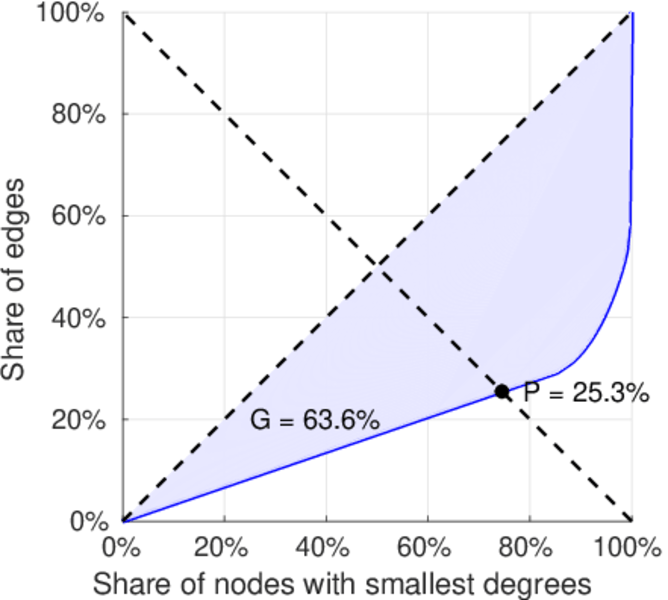
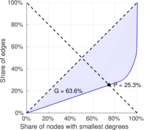
| Gini coefficient | G = | 0.645 816
|
| Balanced inequality ratio | P = | 0.247 298
|
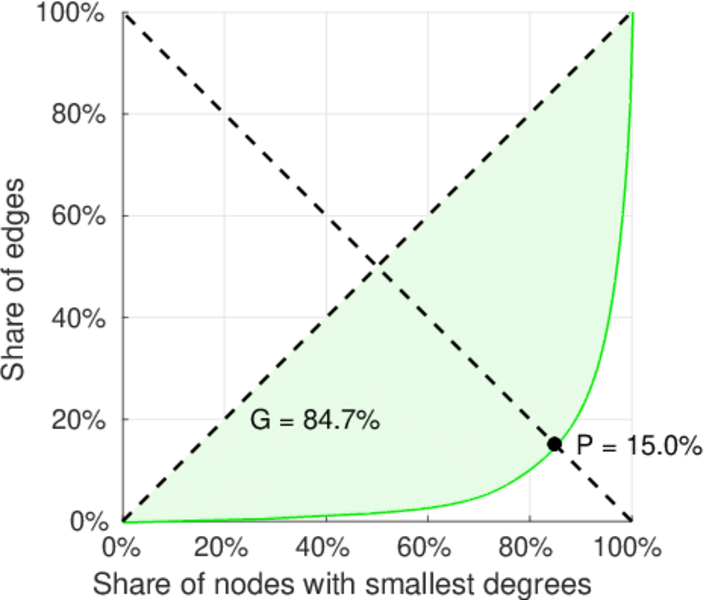
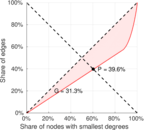
| Left balanced inequality ratio | P1 = | 0.395 676
|
| Right balanced inequality ratio | P2 = | 0.149 957
|
| Relative edge distribution entropy | Her = | 0.853 592
|
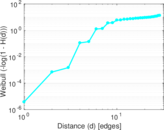
| Tail power law exponent | γt = | 1.771 00
|
| Tail power law exponent with p | γ3 = | 1.771 00
|
| p-value | p = | 0.000 00
|
| Left tail power law exponent with p | γ3,1 = | 8.991 00
|
| Left p-value | p1 = | 0.000 00
|
| Right tail power law exponent with p | γ3,2 = | 1.771 00
|
| Right p-value | p2 = | 0.000 00
|
| Degree assortativity | ρ = | +0.050 656 0
|
| Degree assortativity p-value | pρ = | 0.000 00
|
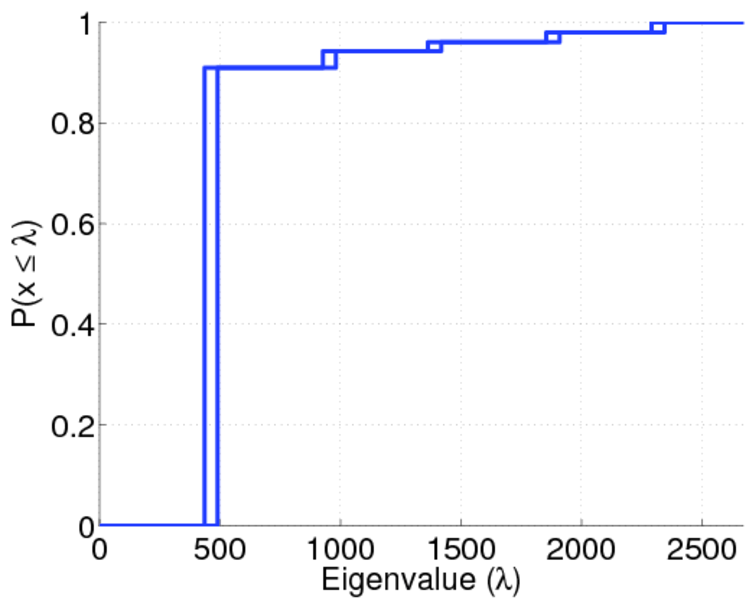
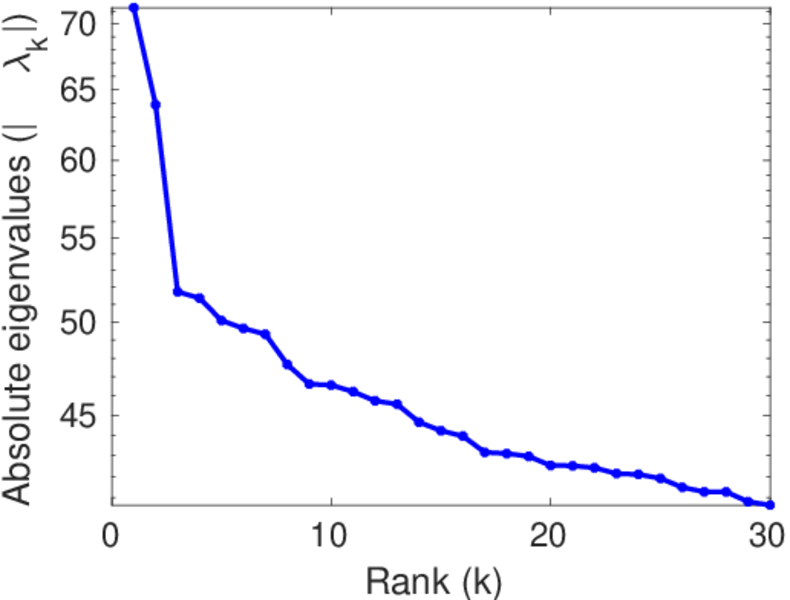
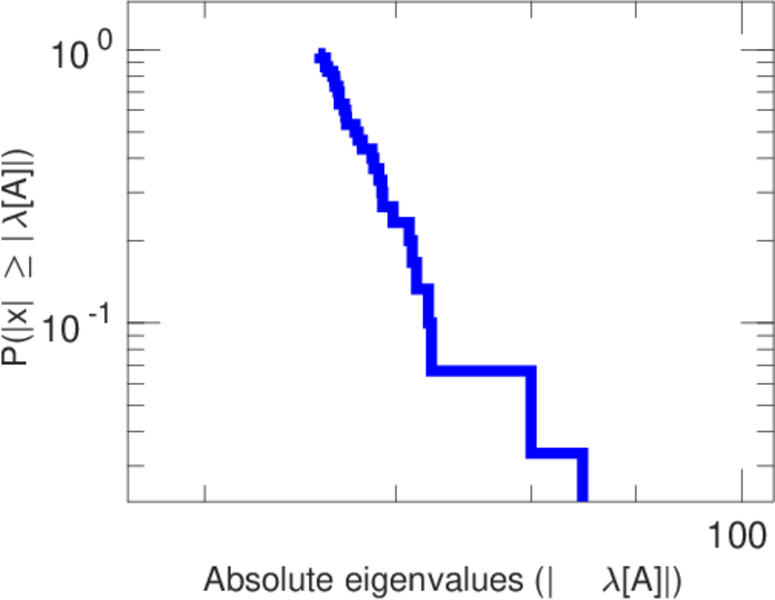
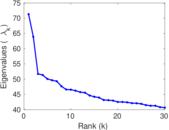
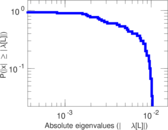
| Spectral norm | α = | 71.312 4
|
| Algebraic connectivity | a = | 0.000 368 766
|
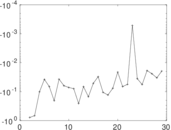
| Spectral separation | |λ1[A] / λ2[A]| = | 1.115 96
|
| Controllability | C = | 868,811
|
| Relative controllability | Cr = | 0.928 623
|
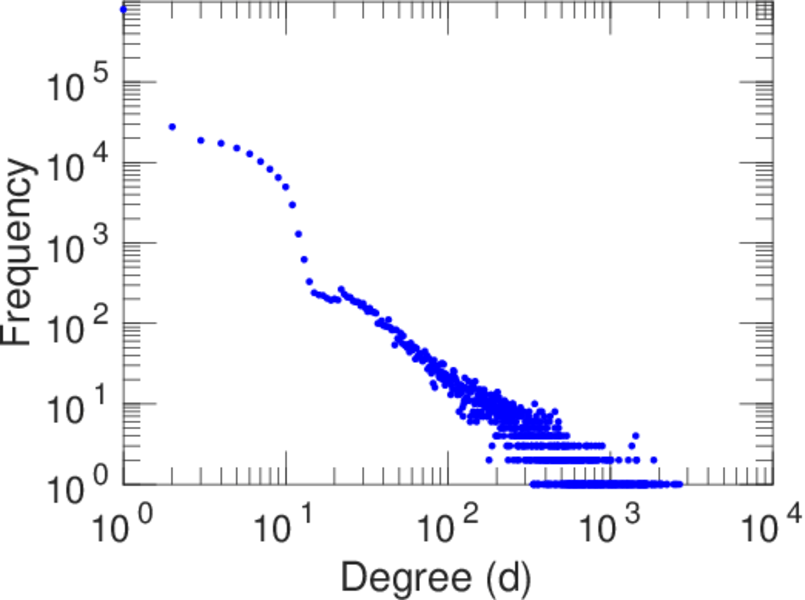
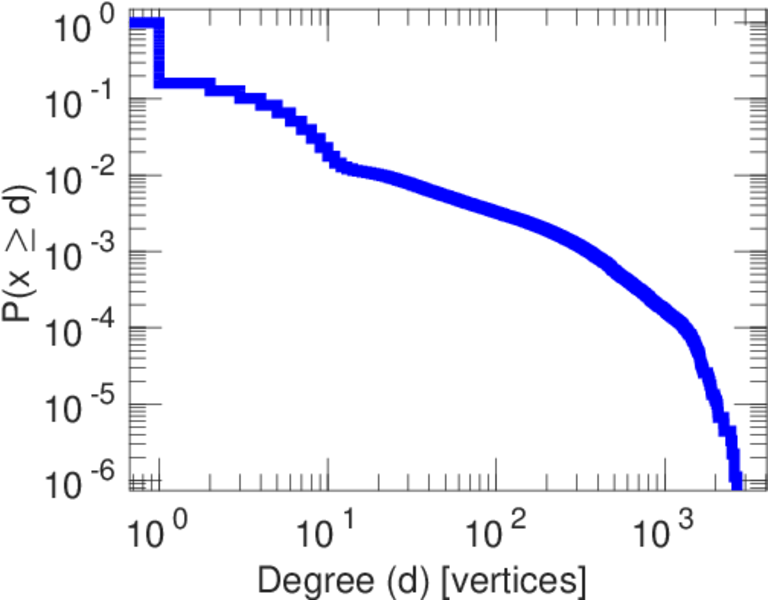
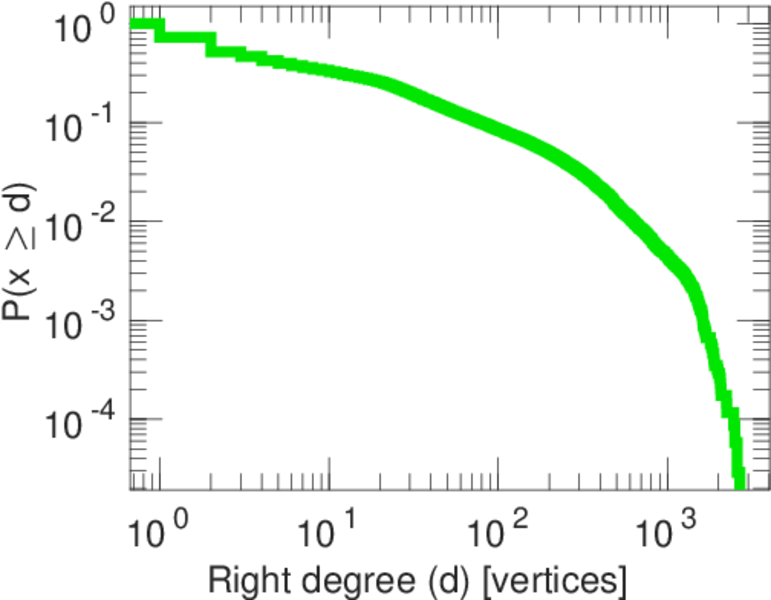
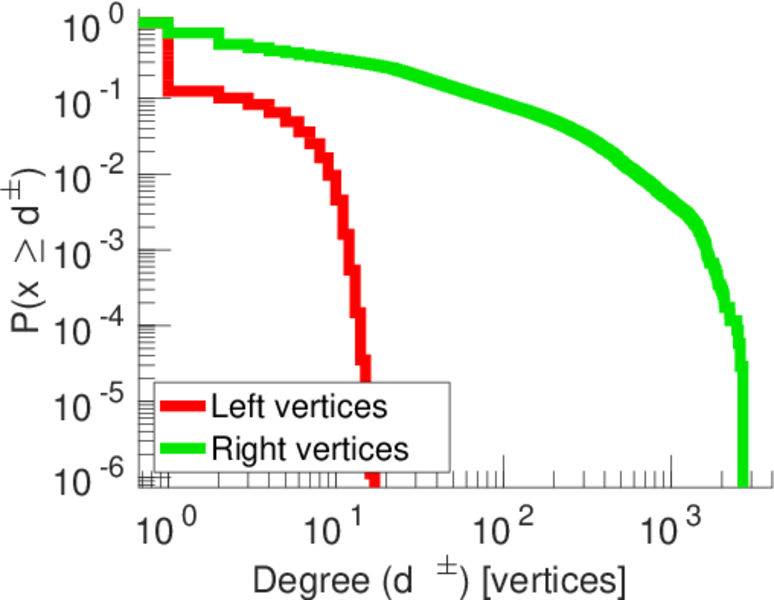
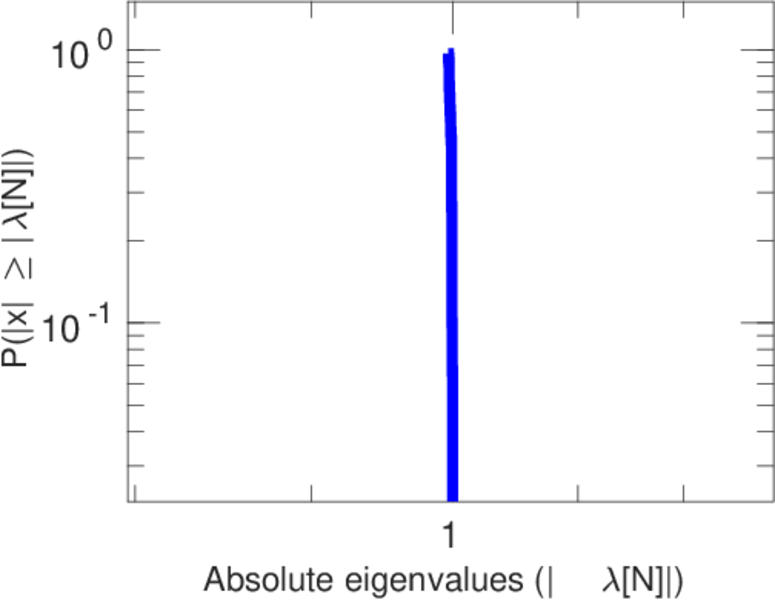
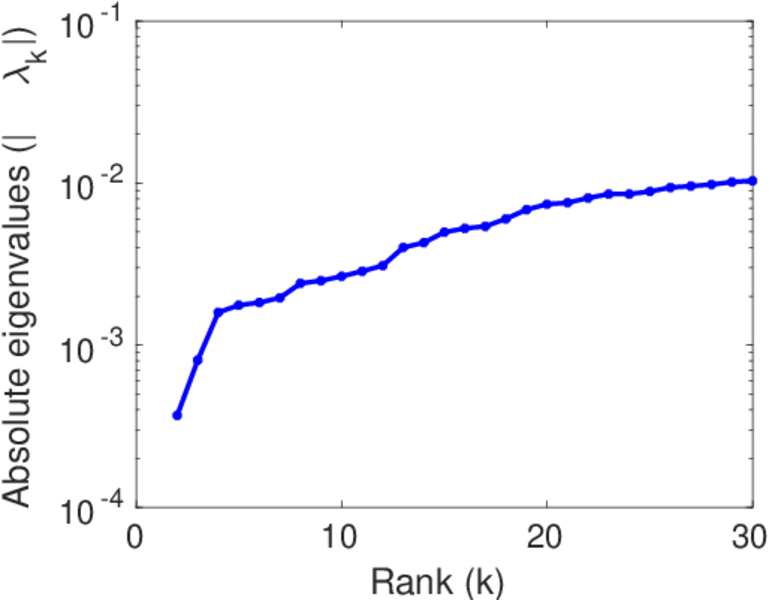
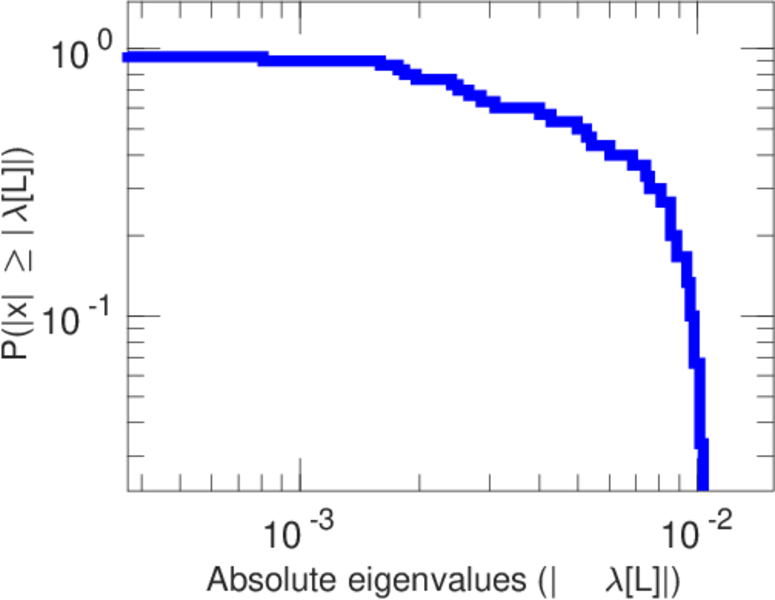
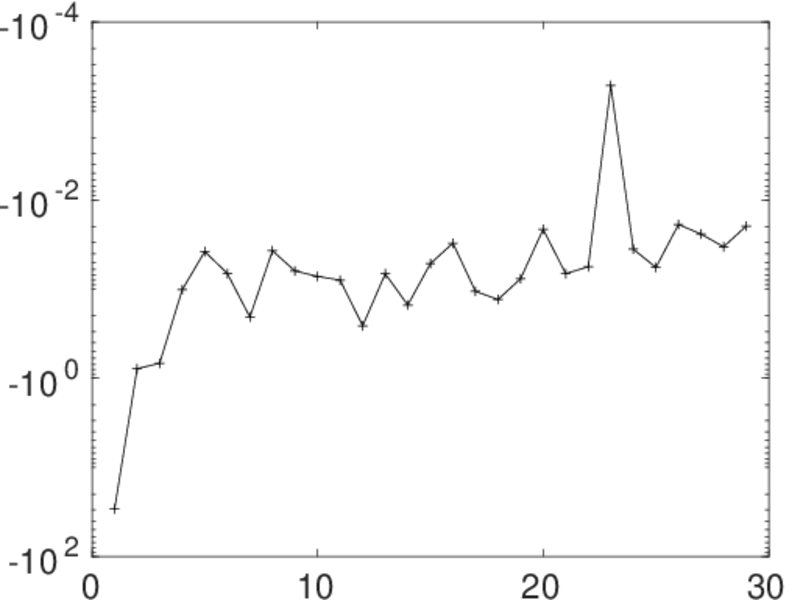
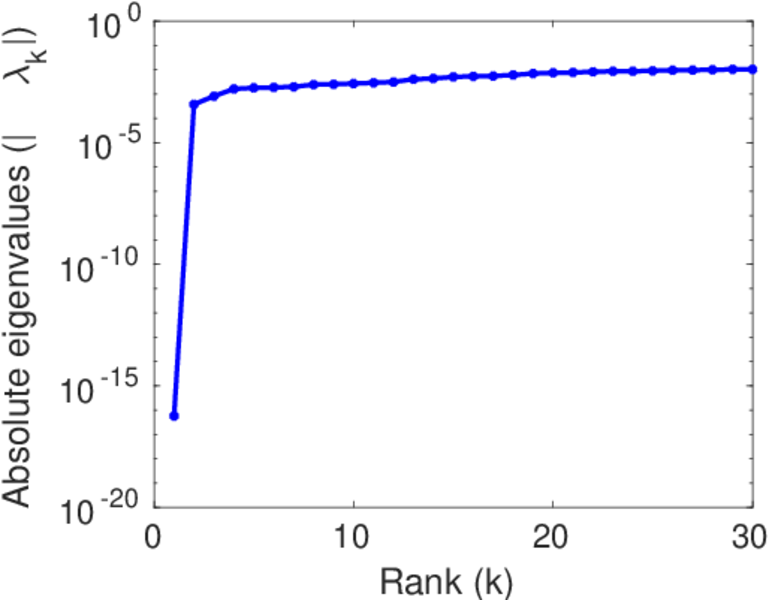
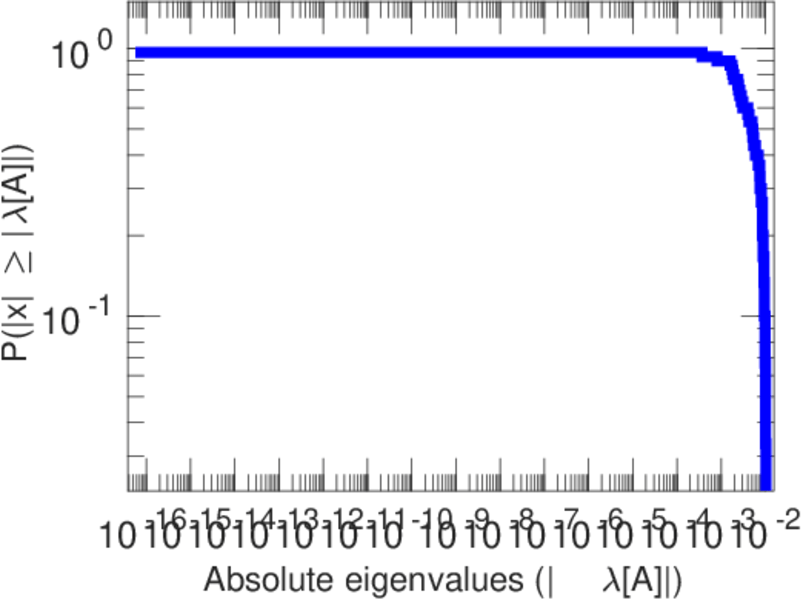
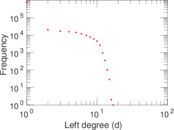
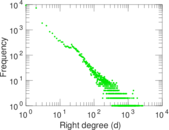
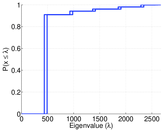
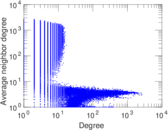
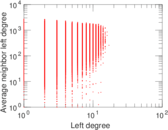
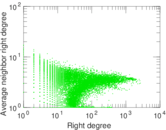
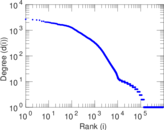
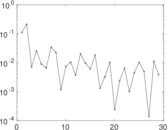
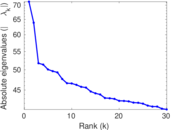
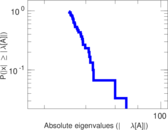
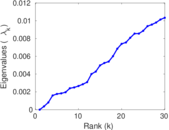
Plots


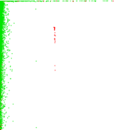
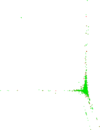


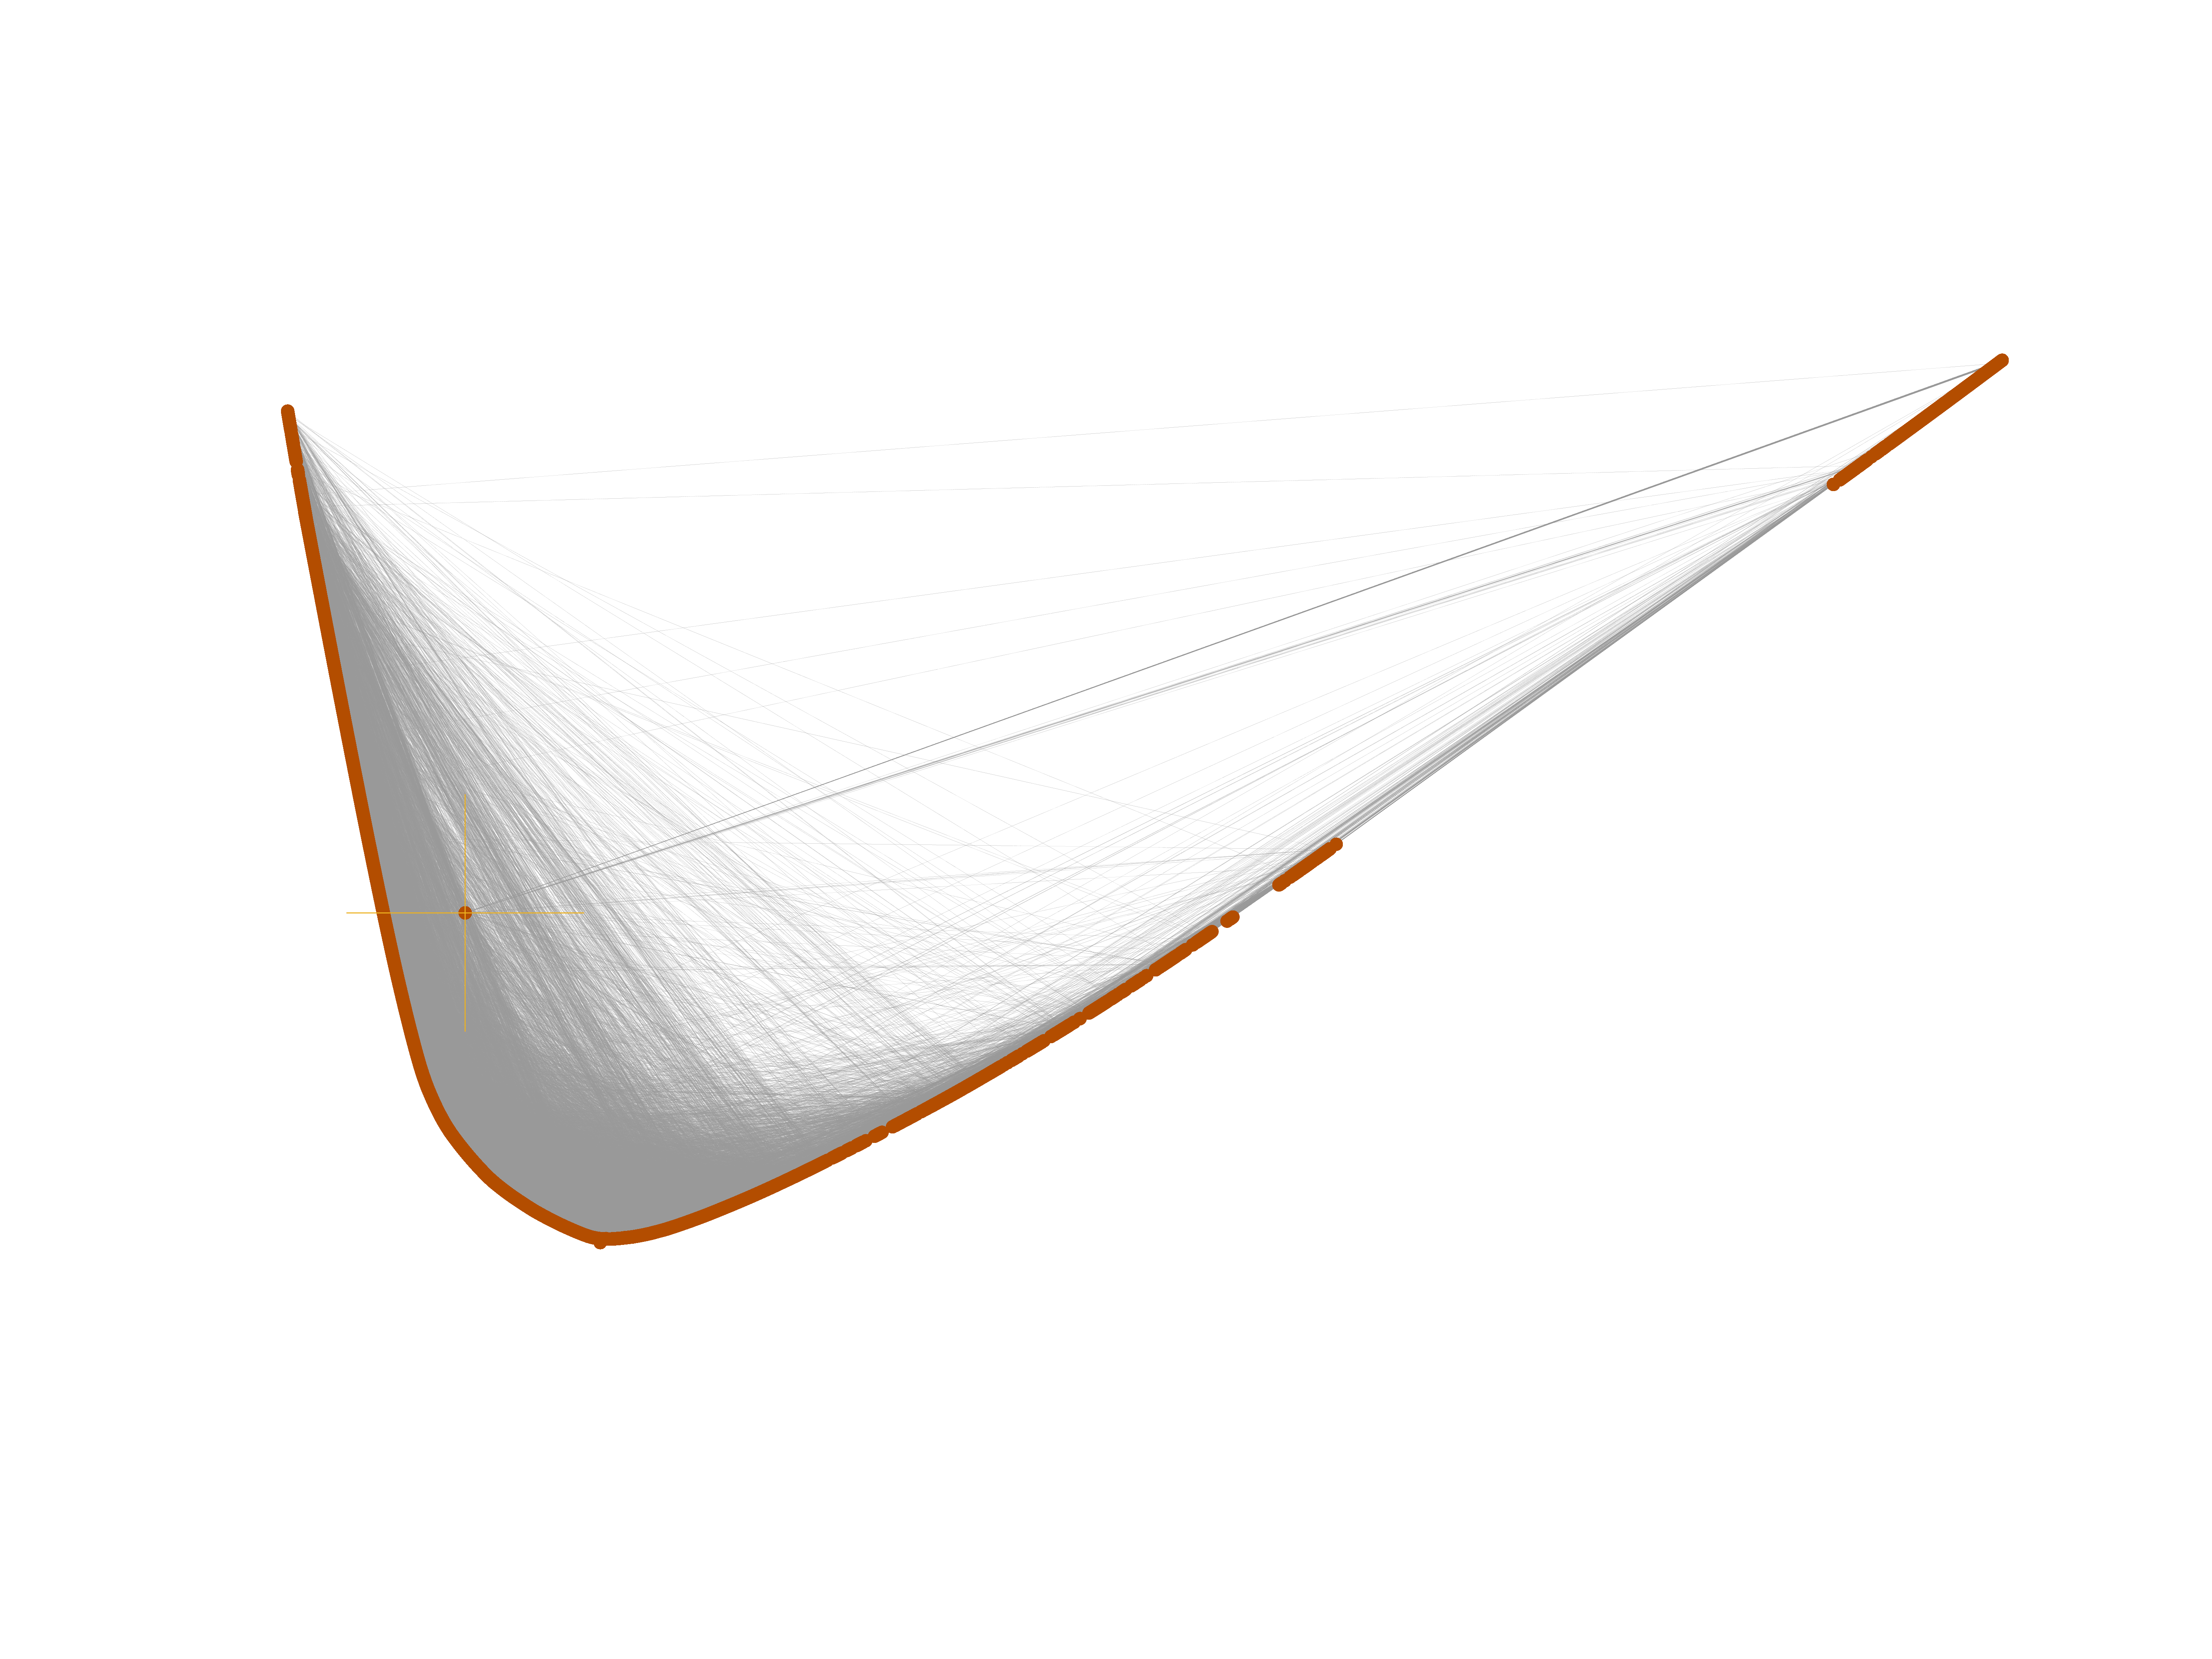
Matrix decompositions plots


Downloads
References
|
[1]
|
Jérôme Kunegis.
KONECT – The Koblenz Network Collection.
In Proc. Int. Conf. on World Wide Web Companion, pages
1343–1350, 2013.
[ http ]
|
|
[2]
|
Sören Auer, Christian Bizer, Georgi Kobilarov, Jens Lehmann, Richard Cyganiak,
and Zachary Ives.
DBpedia: A nucleus for a web of open data.
In Proc. Int. Semant. Web Conf., pages 722–735, 2008.
|
 KONECT ‣ Networks ‣
Buy Me a Coffee
KONECT ‣ Networks ‣
Buy Me a Coffee