Astrophysics
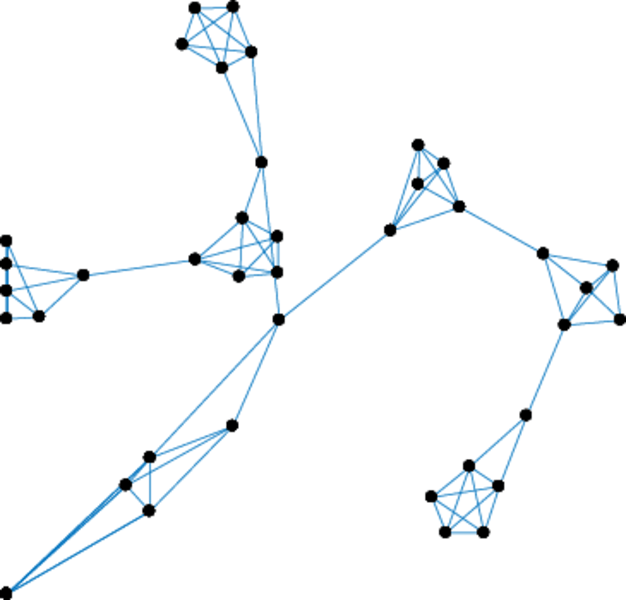
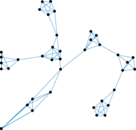
This is the co-authorship network from the "astrophysics" section (astro-ph) of
arXiv. Nodes are authors and an edge denotes a collaboration.
Metadata
Statistics
| Size | n = | 16,046
|
| Volume | m = | 121,251
|
| Loop count | l = | 0
|
| Wedge count | s = | 5,325,457
|
| Claw count | z = | 163,827,498
|
| Cross count | x = | 6,615,074,549
|
| Triangle count | t = | 756,019
|
| Square count | q = | 21,648,652
|
| 4-Tour count | T4 = | 194,733,546
|
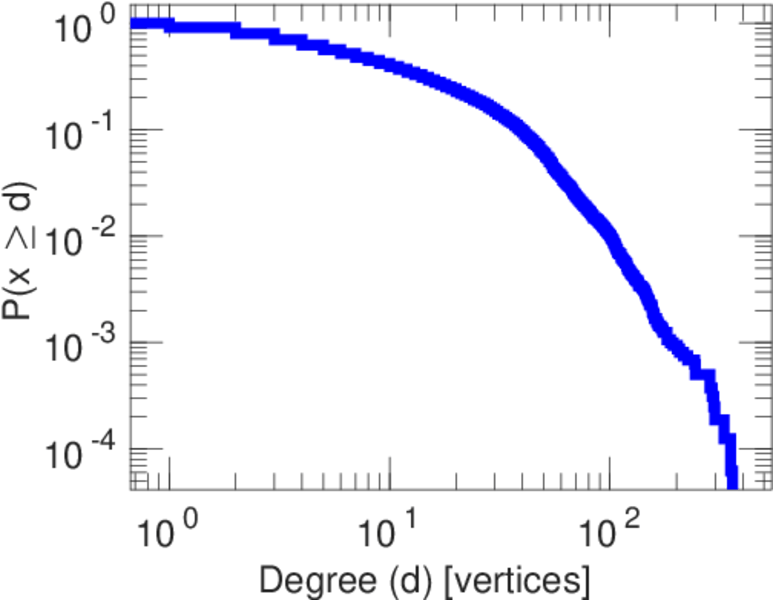
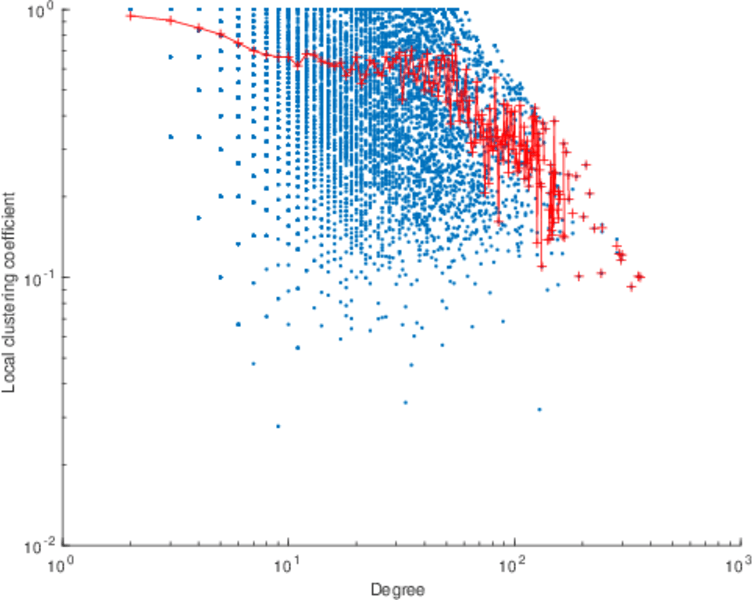
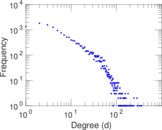
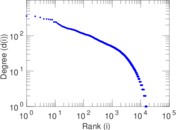
| Maximum degree | dmax = | 360
|
| Average degree | d = | 15.112 9
|
| Fill | p = | 0.000 941 909
|
| Size of LCC | N = | 14,845
|
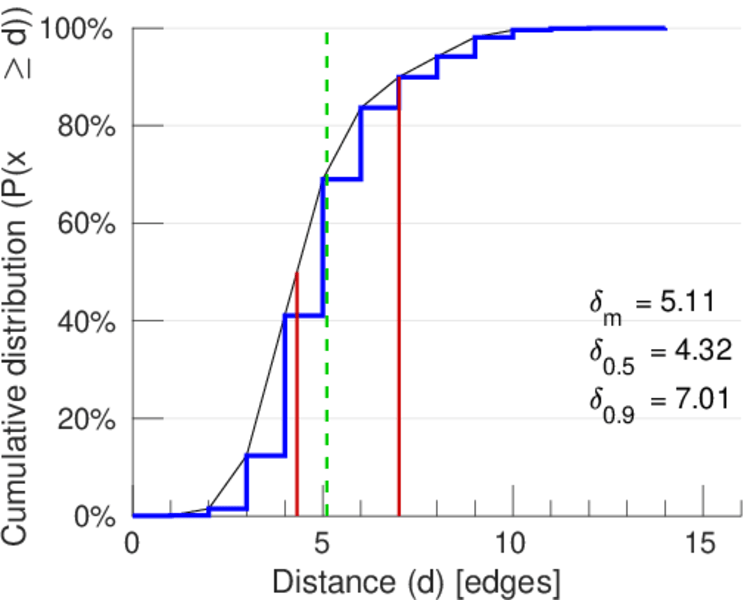
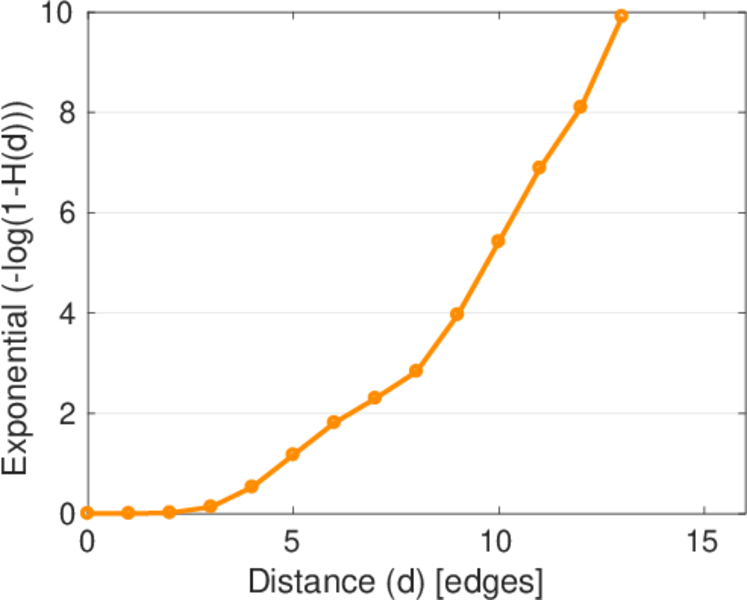
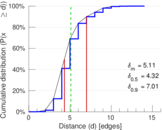
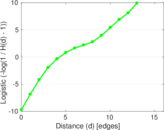
| Diameter | δ = | 14
|
| 50-Percentile effective diameter | δ0.5 = | 4.321 41
|
| 90-Percentile effective diameter | δ0.9 = | 7.011 94
|
| Median distance | δM = | 5
|
| Mean distance | δm = | 5.108 49
|
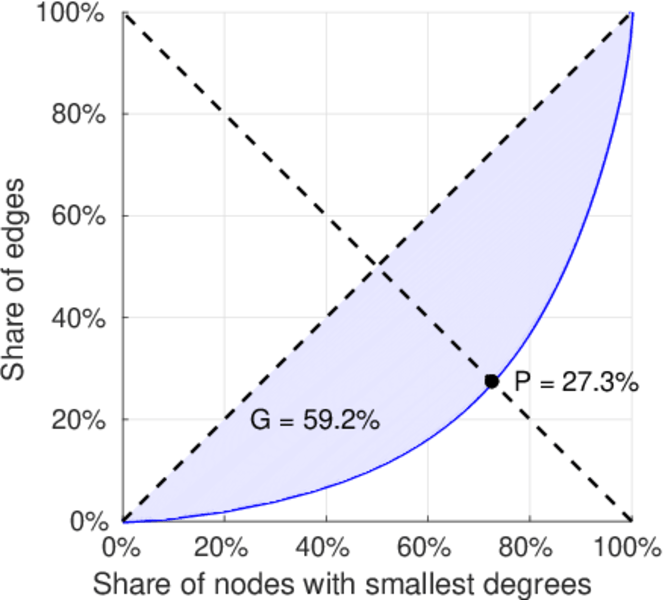
| Gini coefficient | G = | 0.591 788
|
| Balanced inequality ratio | P = | 0.273 350
|
| Relative edge distribution entropy | Her = | 0.934 837
|
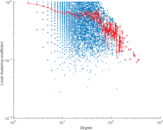
| Power law exponent | γ = | 1.494 83
|
| Tail power law exponent | γt = | 3.751 00
|
| Tail power law exponent with p | γ3 = | 3.751 00
|
| p-value | p = | 0.103 000
|
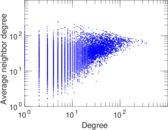
| Degree assortativity | ρ = | +0.235 462
|
| Degree assortativity p-value | pρ = | 0.000 00
|
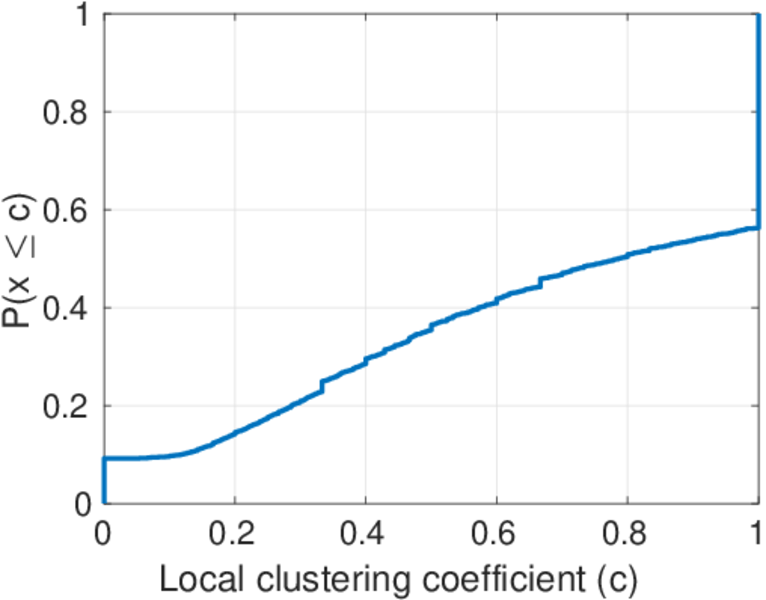
| Clustering coefficient | c = | 0.425 890
|
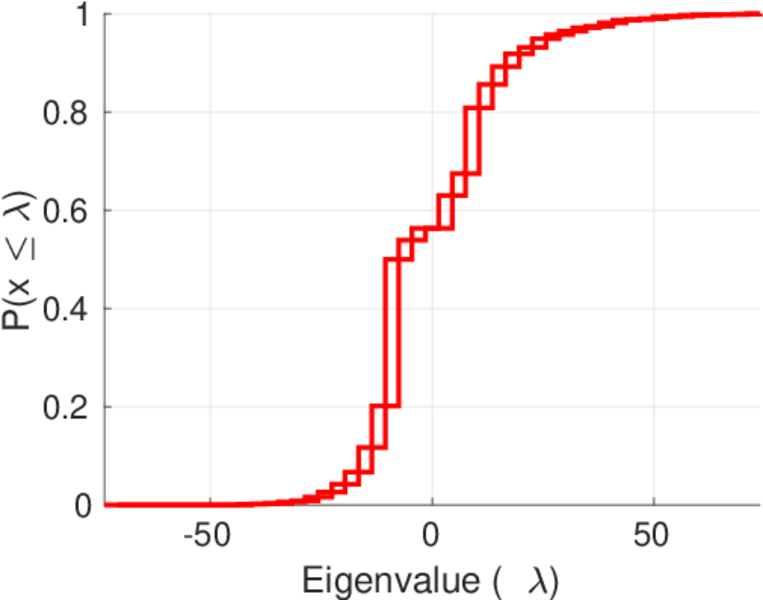
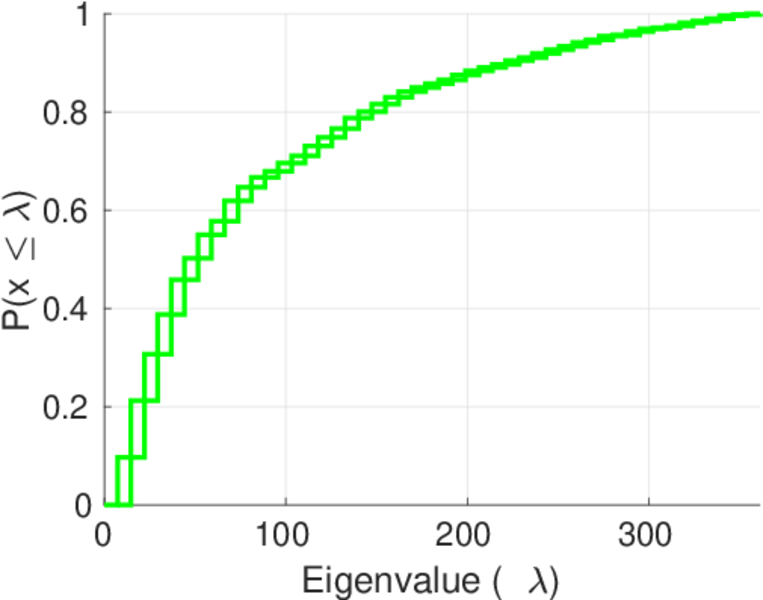
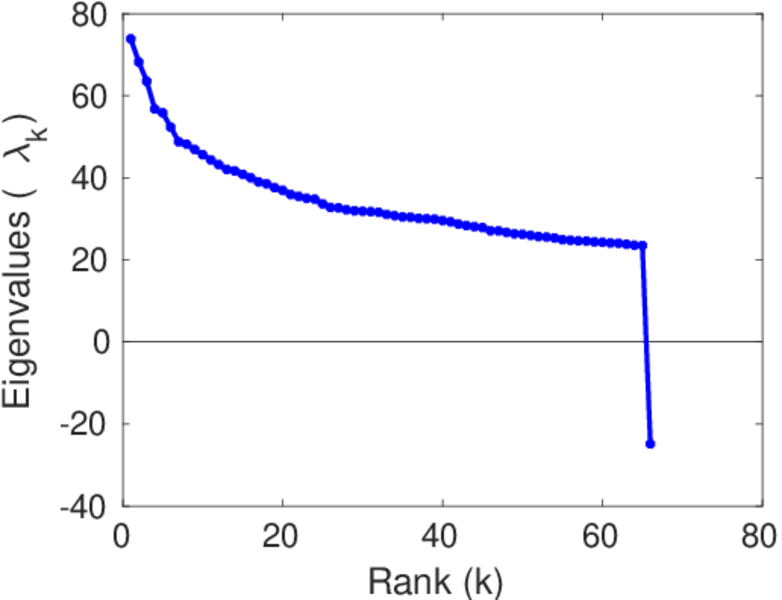
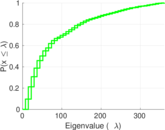
| Spectral norm | α = | 73.886 8
|
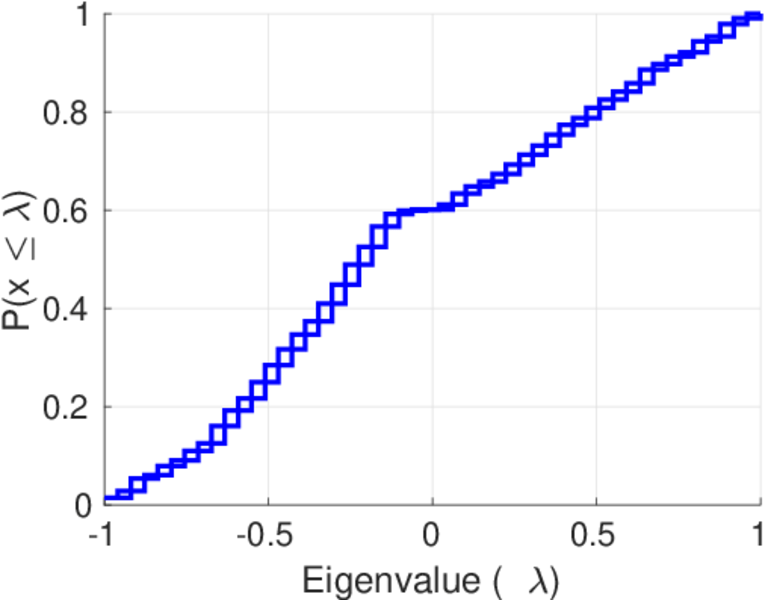
| Algebraic connectivity | a = | 0.030 183 6
|
| Spectral separation | |λ1[A] / λ2[A]| = | 1.082 72
|
| Non-bipartivity | bA = | 0.663 931
|
| Normalized non-bipartivity | bN = | 0.088 359 2
|
| Algebraic non-bipartivity | χ = | 0.144 581
|
| Spectral bipartite frustration | bK = | 0.002 242 24
|
| Controllability | C = | 569
|
| Relative controllability | Cr = | 0.035 460 6
|
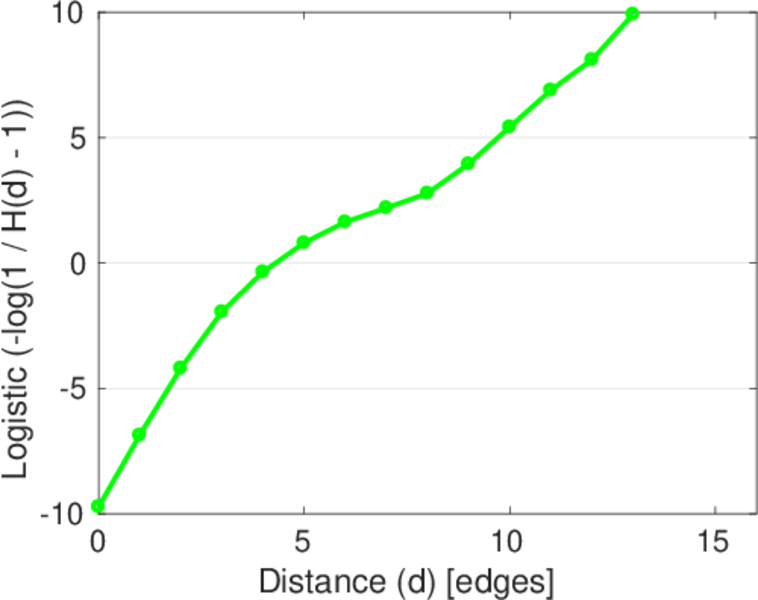
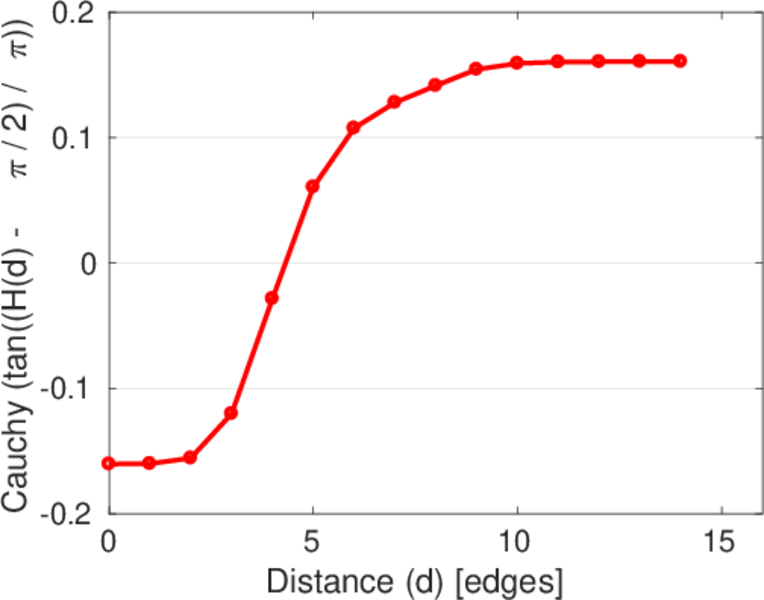
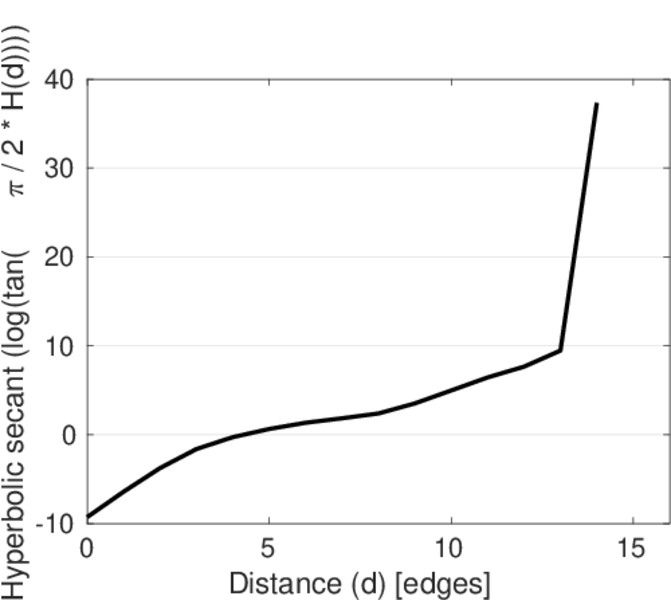
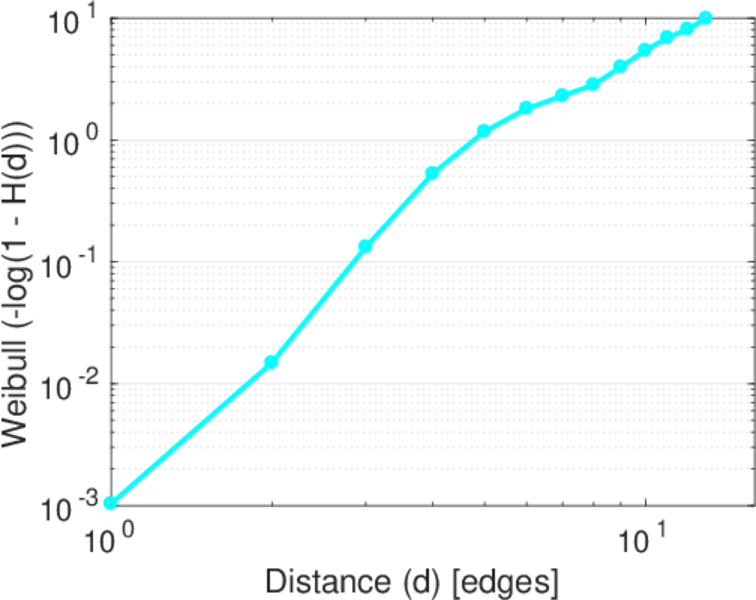
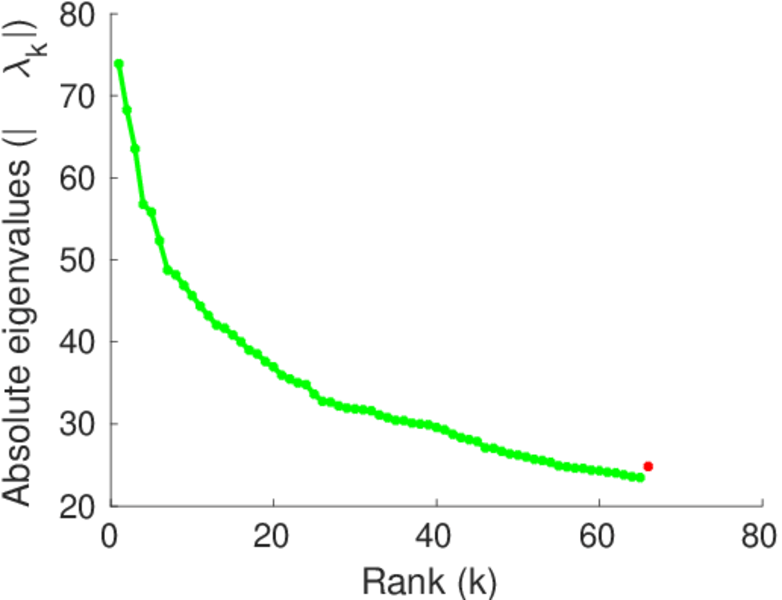
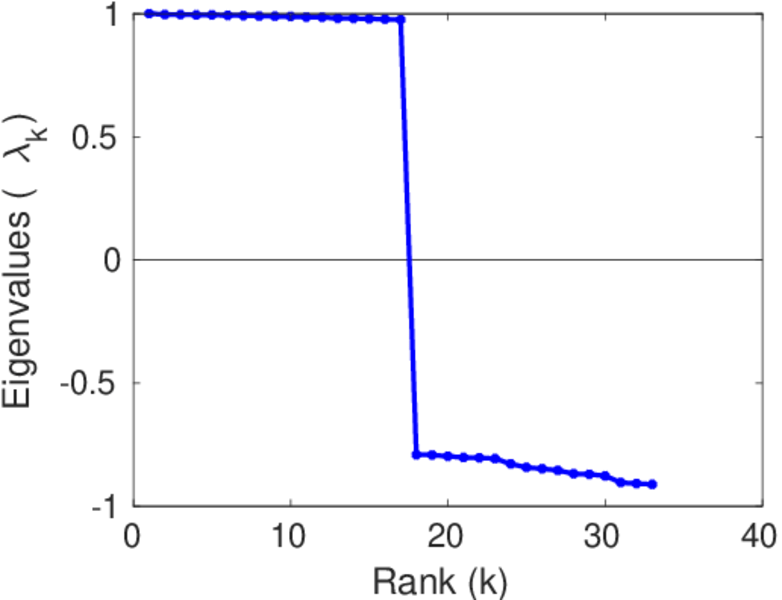
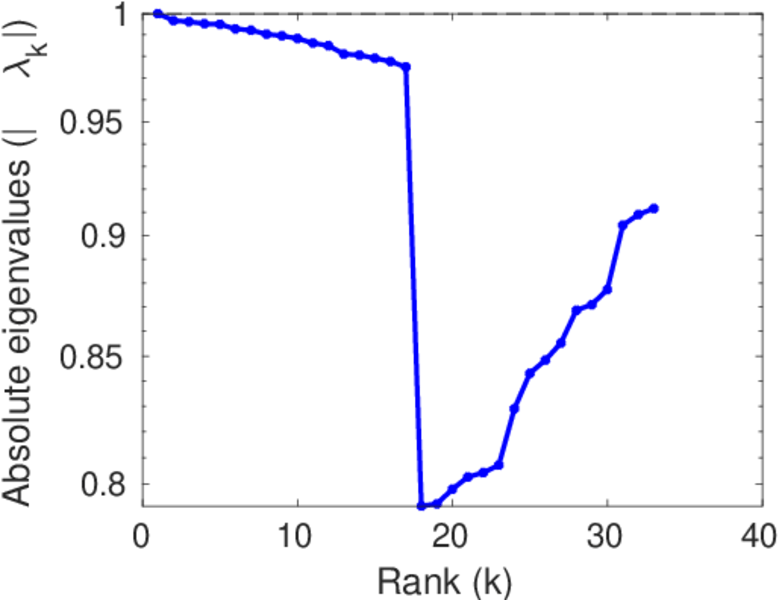
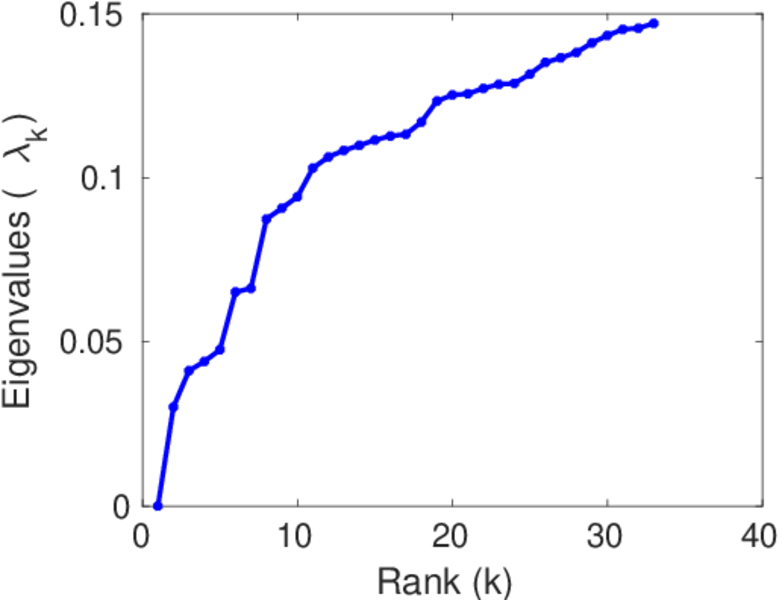
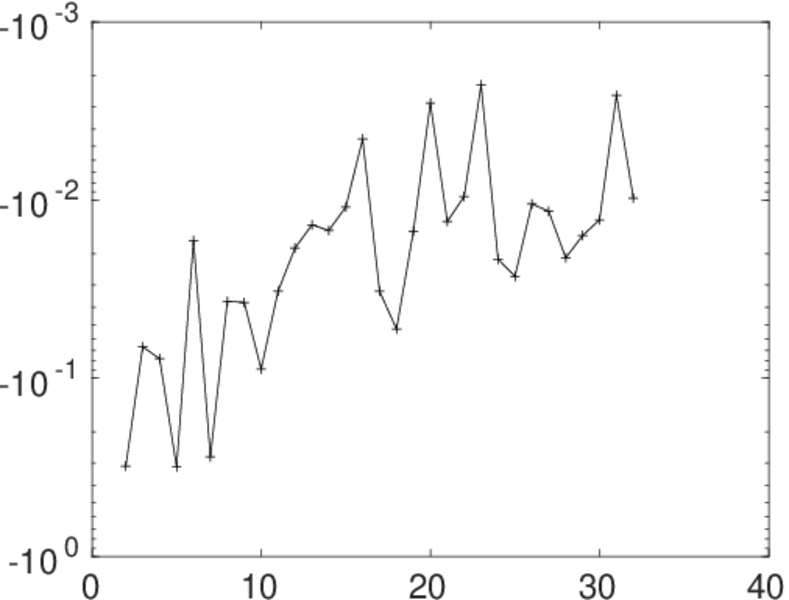
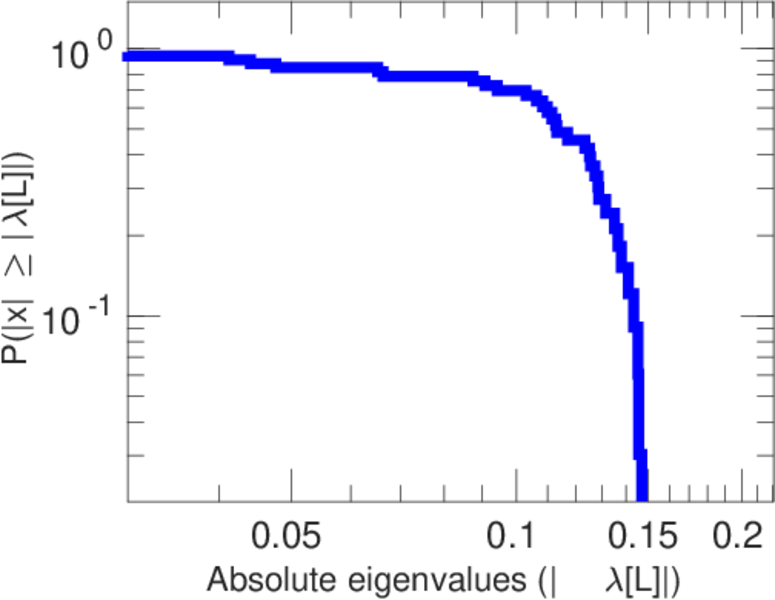
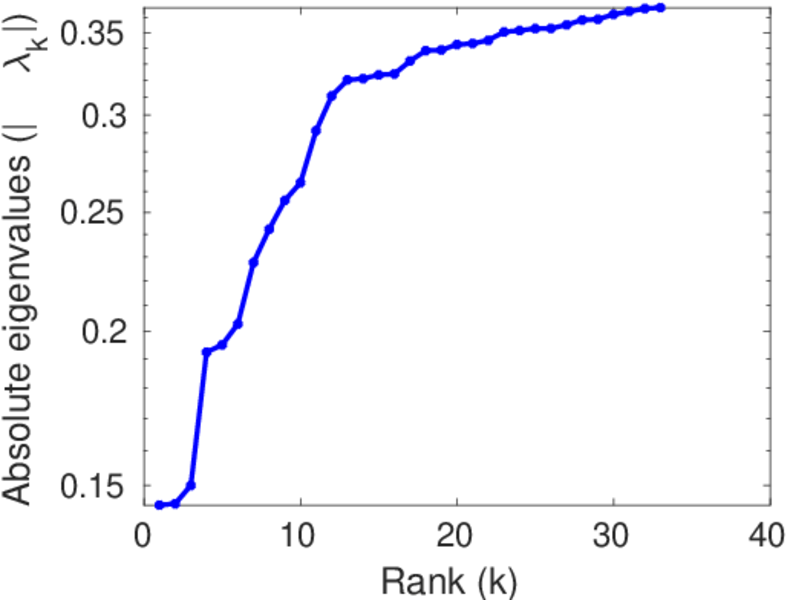
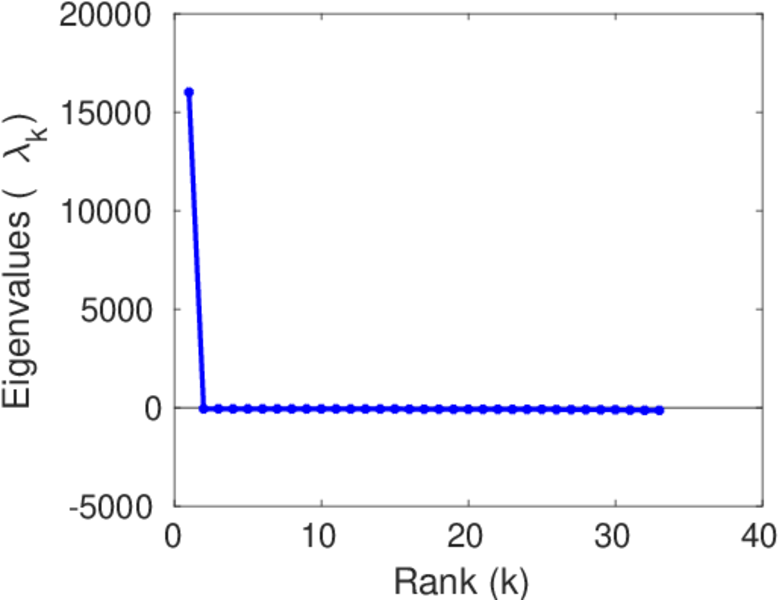
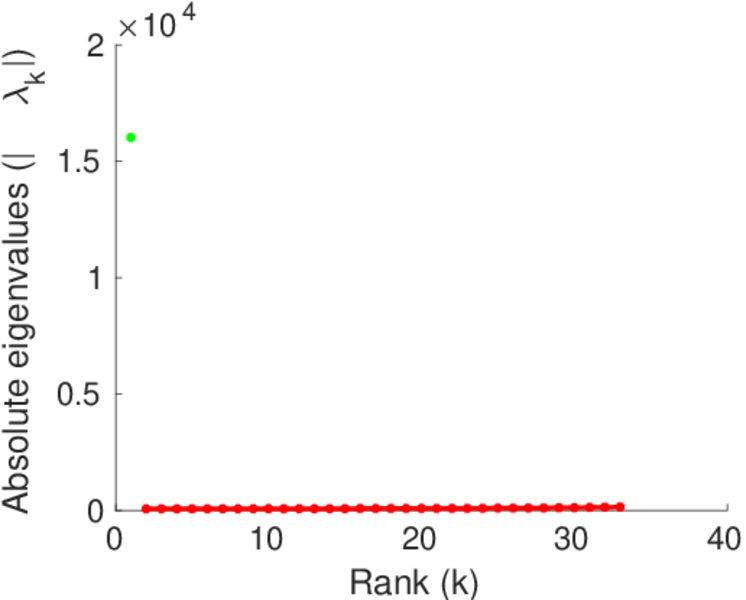
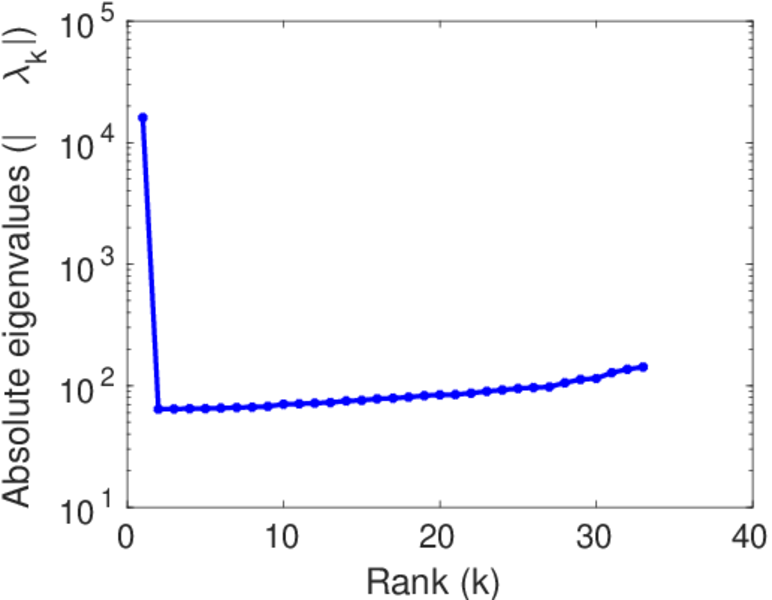
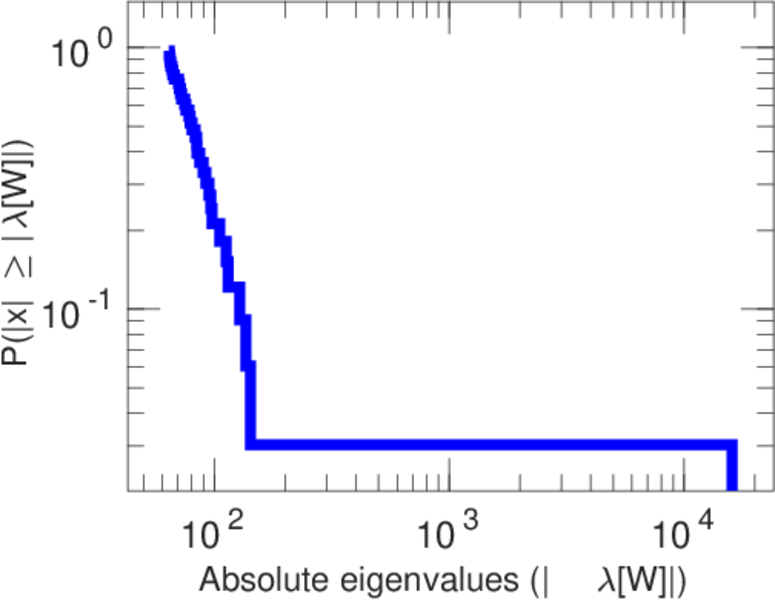
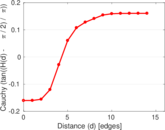
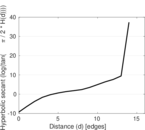
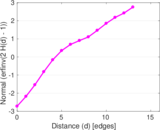
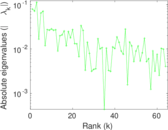
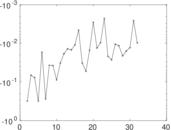
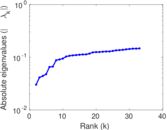
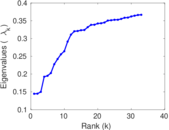
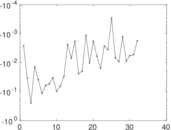
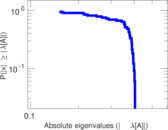
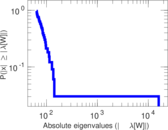
Plots


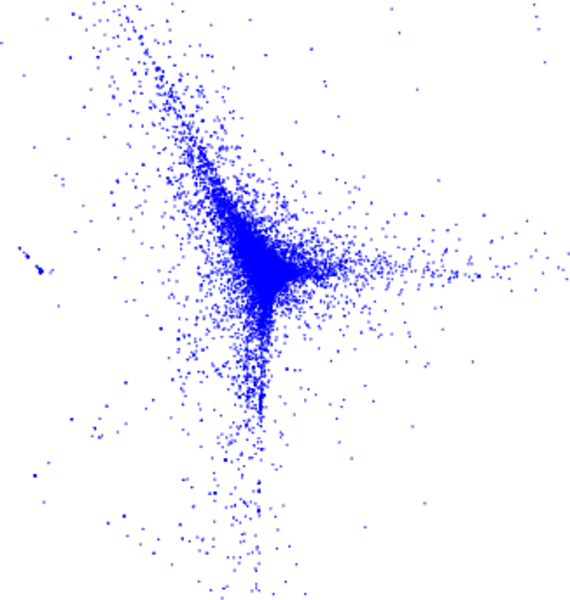
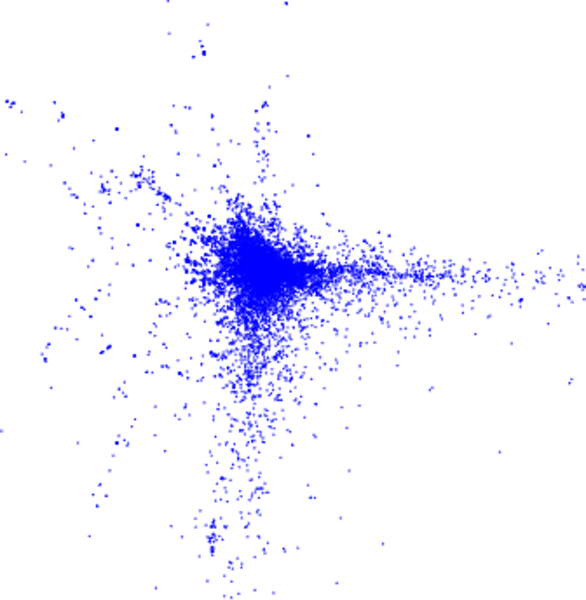
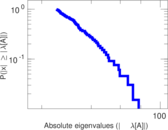
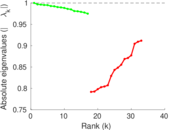
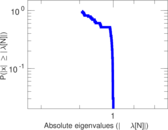
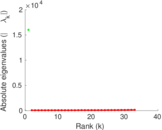
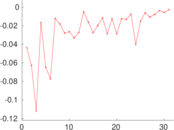
Matrix decompositions plots


Downloads
References
|
[1]
|
Jérôme Kunegis.
KONECT – The Koblenz Network Collection.
In Proc. Int. Conf. on World Wide Web Companion, pages
1343–1350, 2013.
[ http ]
|
|
[2]
|
Mark E. J. Newman.
The structure of scientific collaboration networks.
Proc. Natl. Acad. Sci. U.S.A., 98(2):404–409, 2001.
|
 KONECT ‣ Networks ‣
Buy Me a Coffee
KONECT ‣ Networks ‣
Buy Me a Coffee