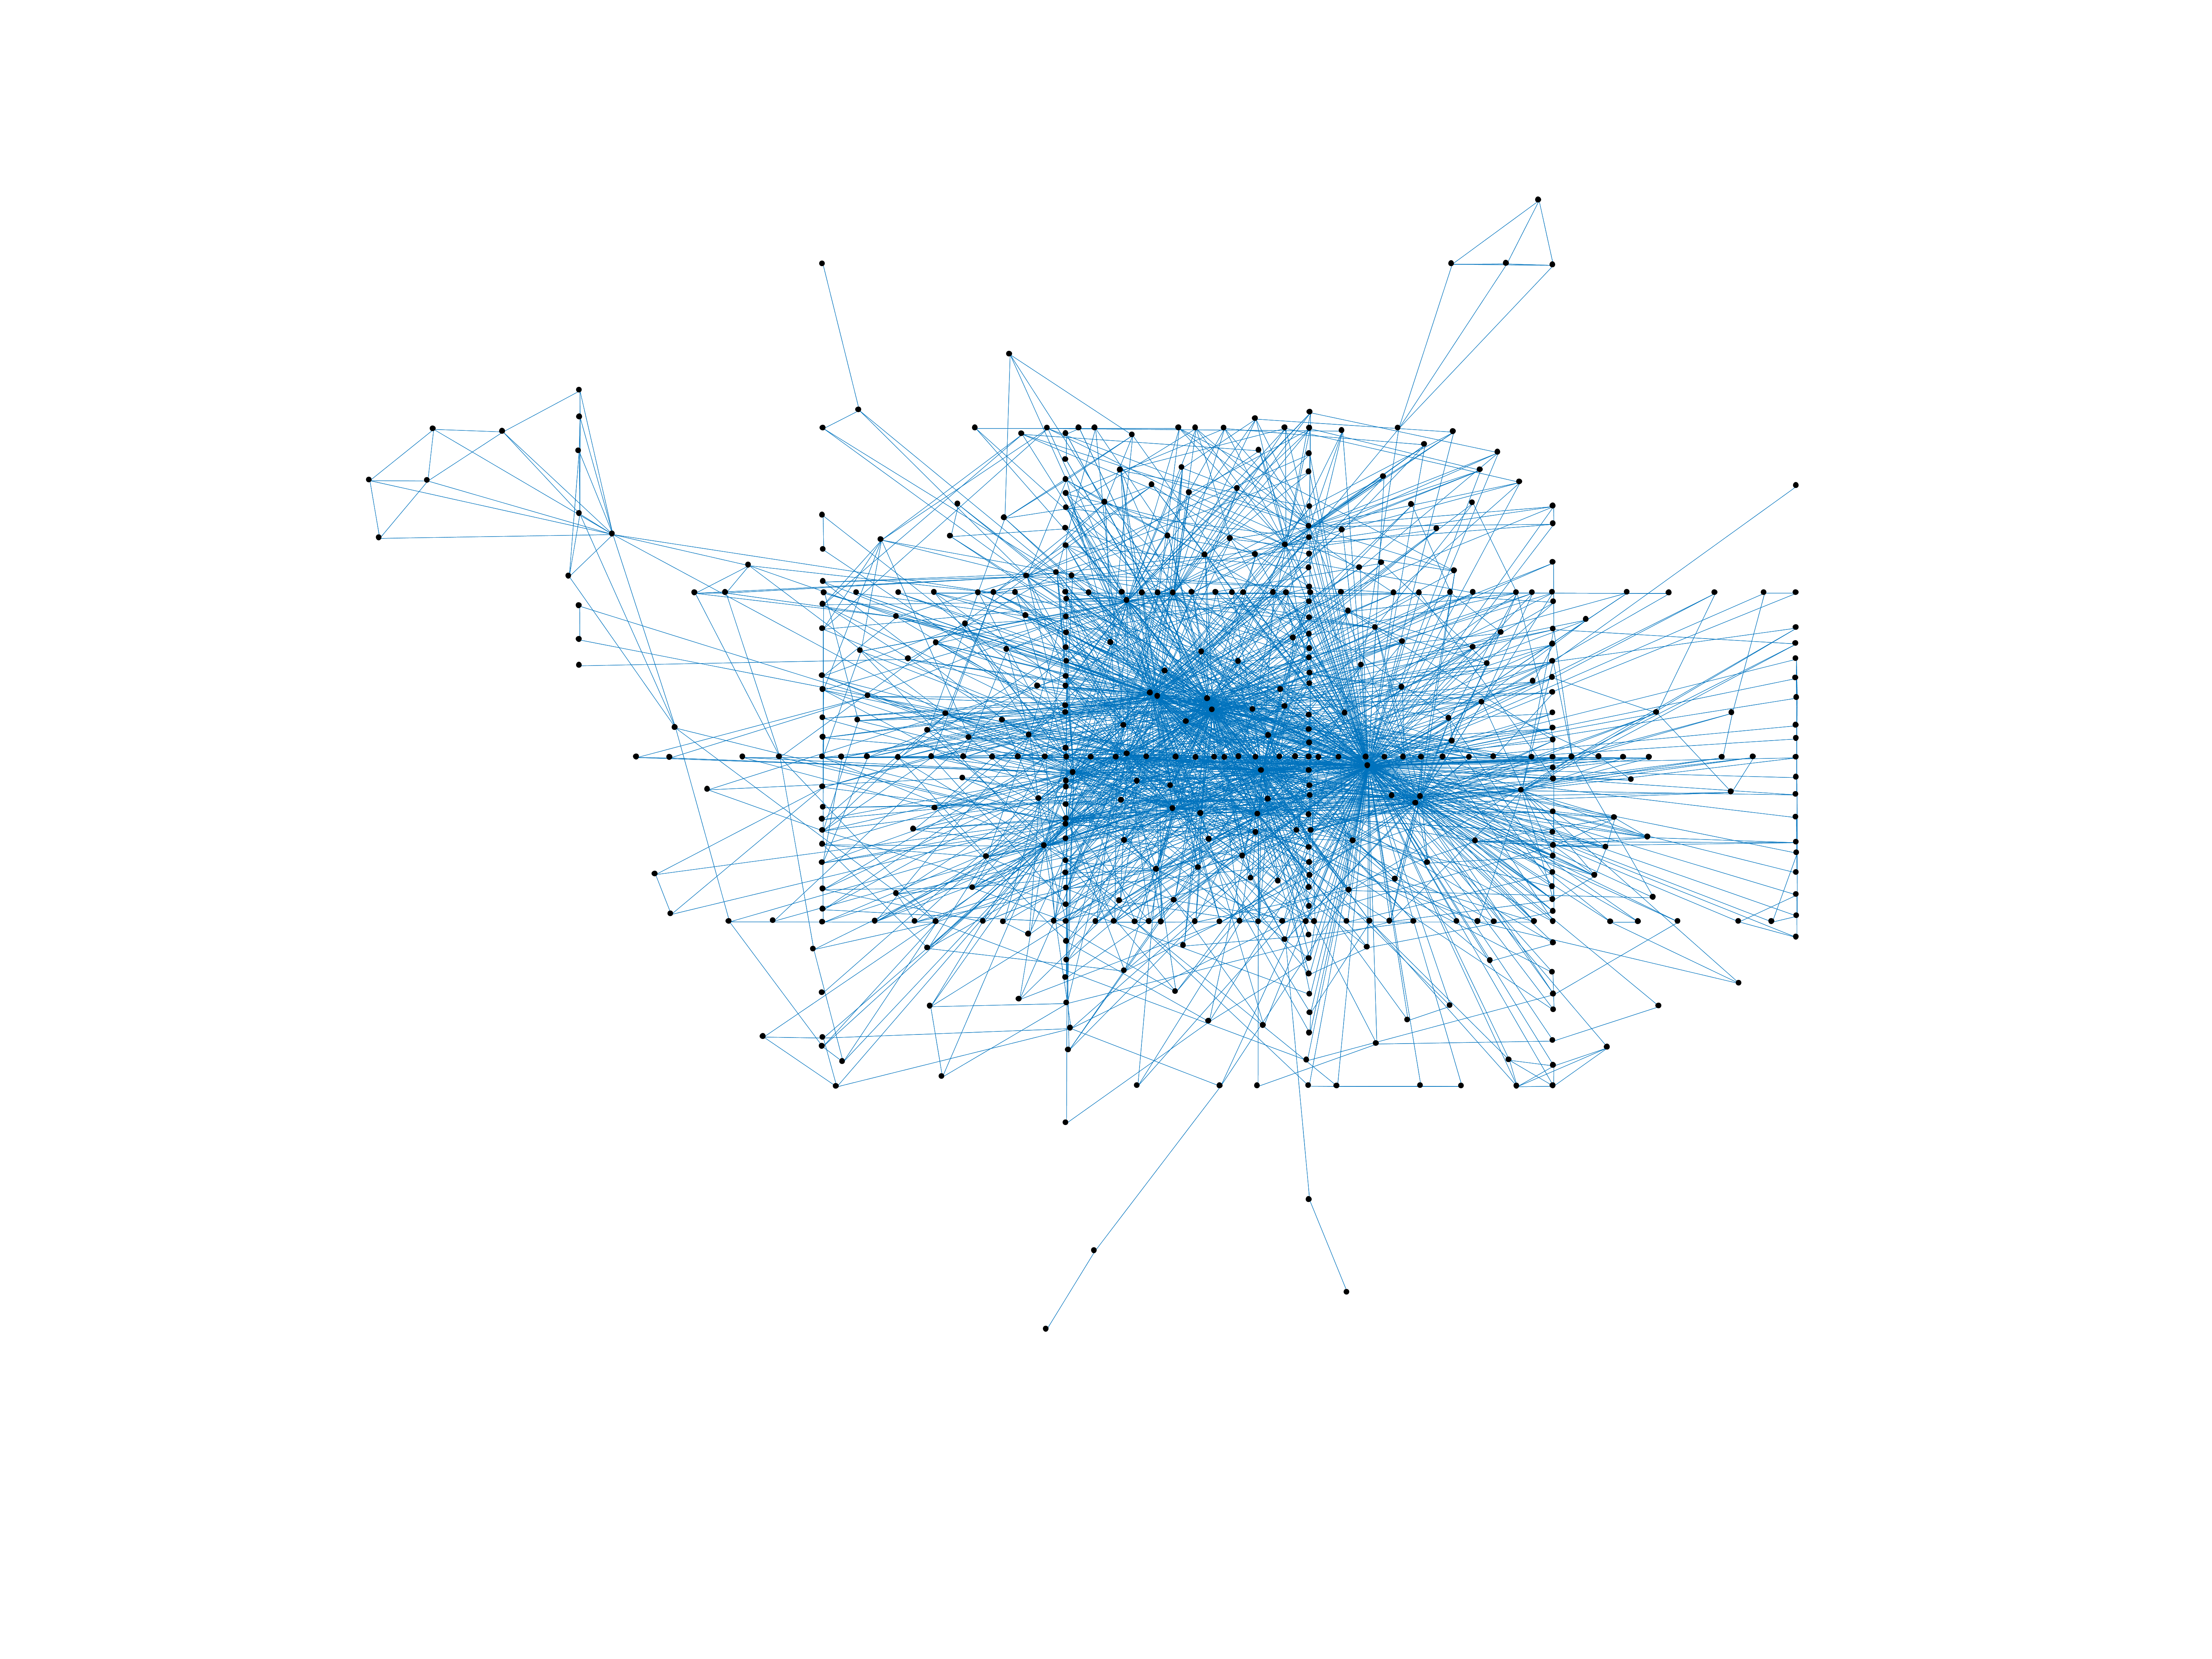
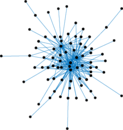
Caenorhabditis elegans (metabolic)
This is the metabolic network of Caenorhabditis elegans. We acquired
the network from the DIMACS10 project, which acquired it from Alex Arena's
website, which took it from the article by Jeong et al., which is based on data
from the WIT database. To cite the paper by Jeong and colleagues, which
analyses 43 such networks: "This integrated pathway–genome database predicts
the existence of a given metabolic pathway on the basis of the annotated genome
of an organism combined with firmly established data from the biochemical
literature. As 18 of the 43 genomes deposited in the database are not yet
fully sequenced, and a substantial portion of the identified open
reading frames are functionally unassigned, the list of enzymes, and
consequently the list of substrates and reactions, will certainly be
expanded in the future. Nevertheless, this publicly available database
represents our best approximation for the metabolic pathways in 43 organisms
and provides sufficient data for their unambiguous statistical analysis.
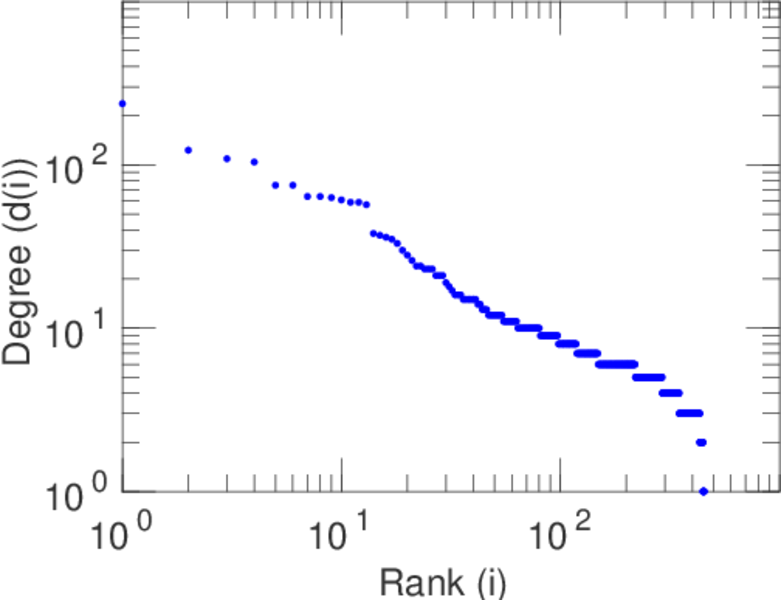
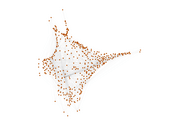
[...] We first established a graph theoretic representation of the
biochemical reactions taking place in a given metabolic network. In this
representation, a metabolic network is built up of nodes, the substrates, that
are connected to one another through links, which are the actual
metabolic reactions. The physical entity of the link is the temporary
educt–educt complex itself, in which enzymes provide the catalytic
scaffolds for the reactions yielding products, which in turn can become
educts for subsequent reactions."
Metadata
Statistics
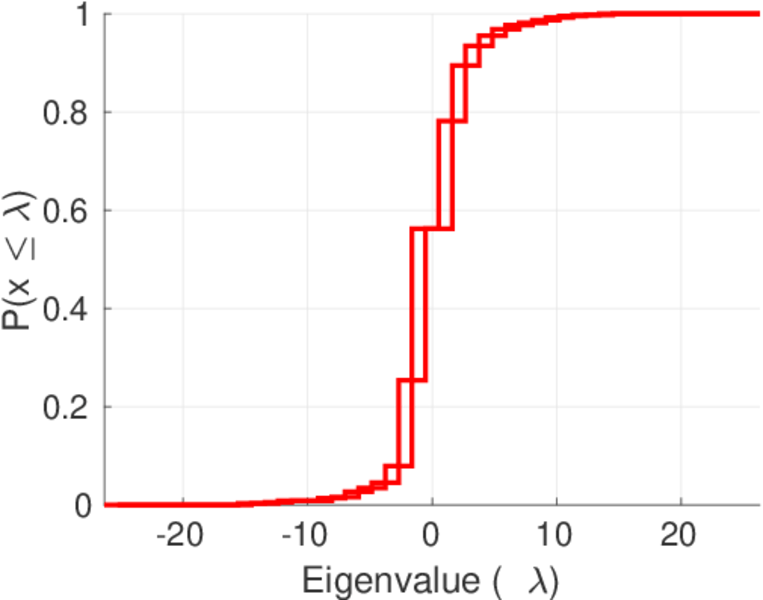
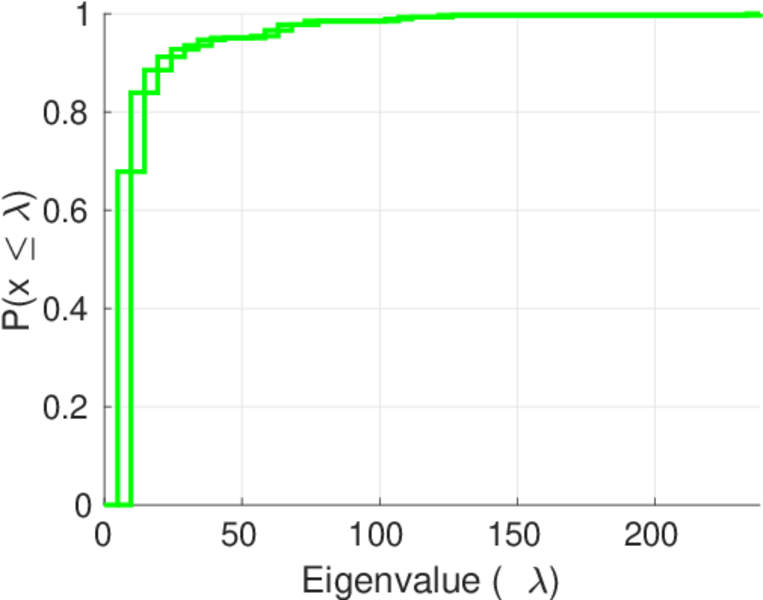
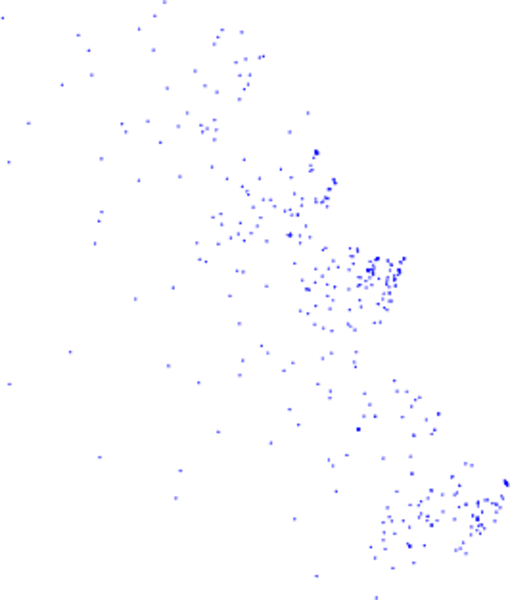
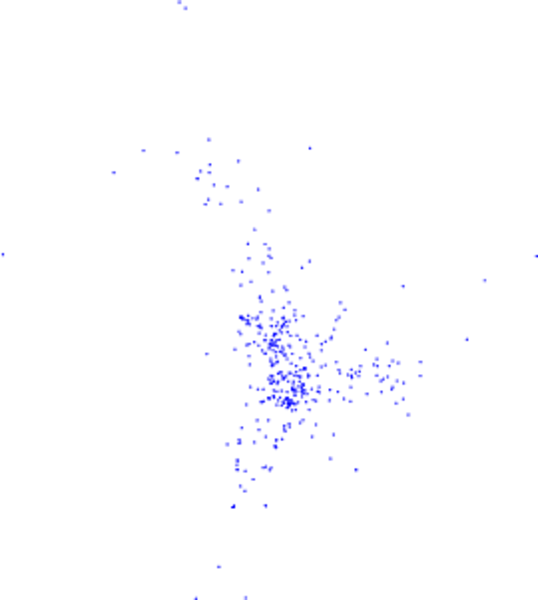
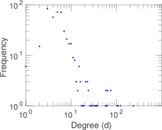
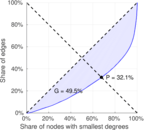
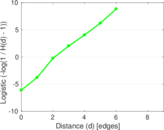
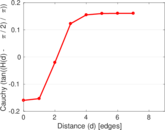
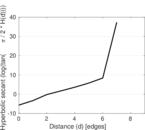
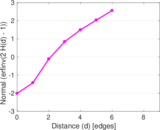
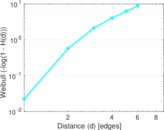
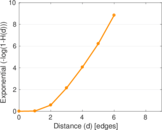
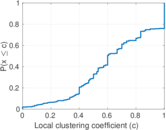
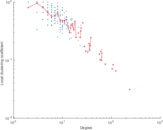
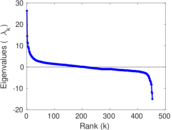
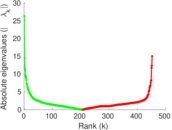
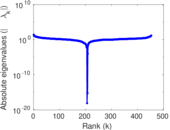
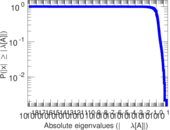
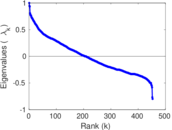
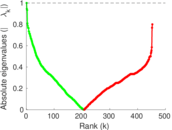
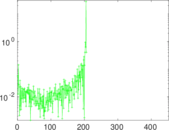
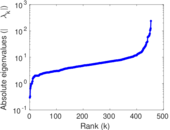
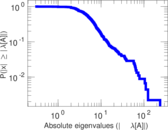
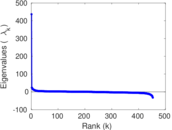
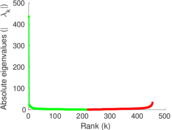
Plots


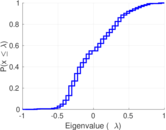


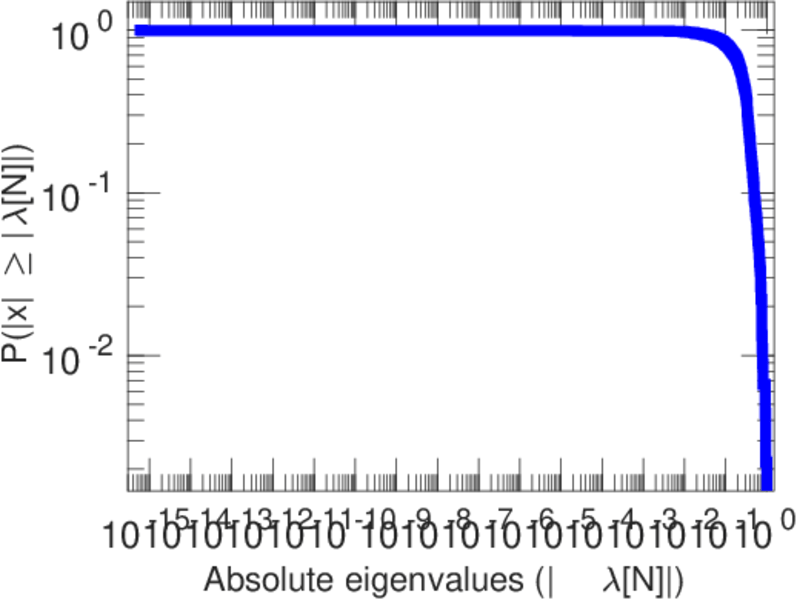
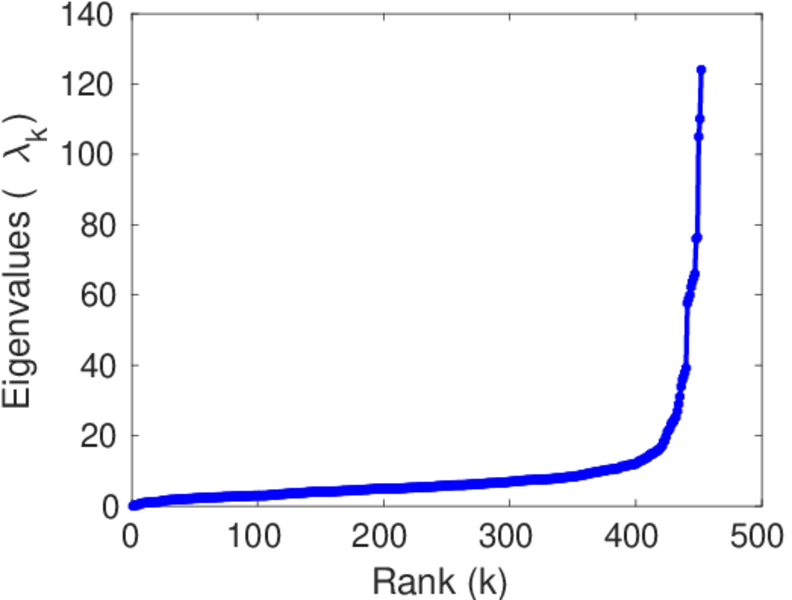
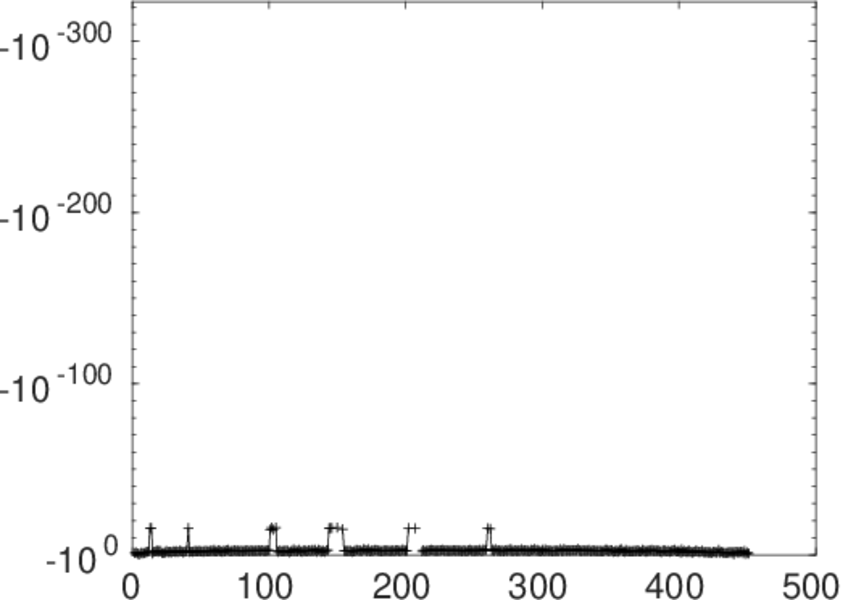
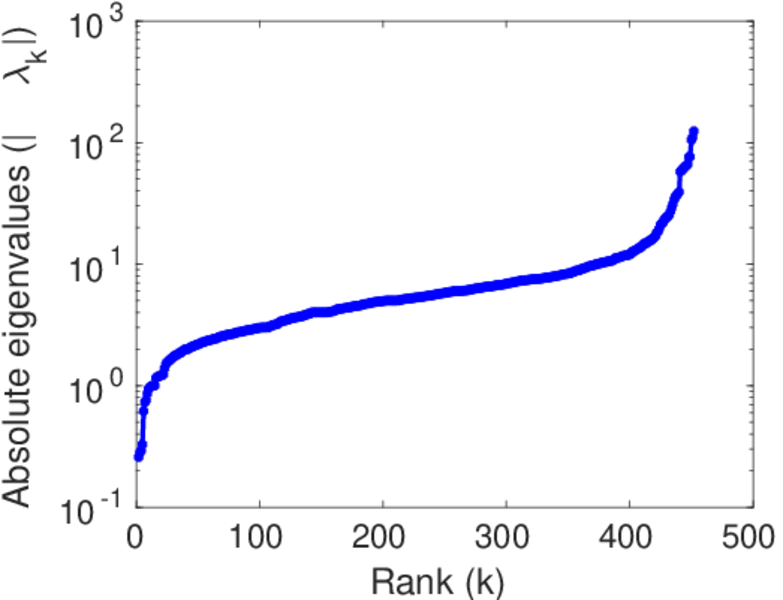
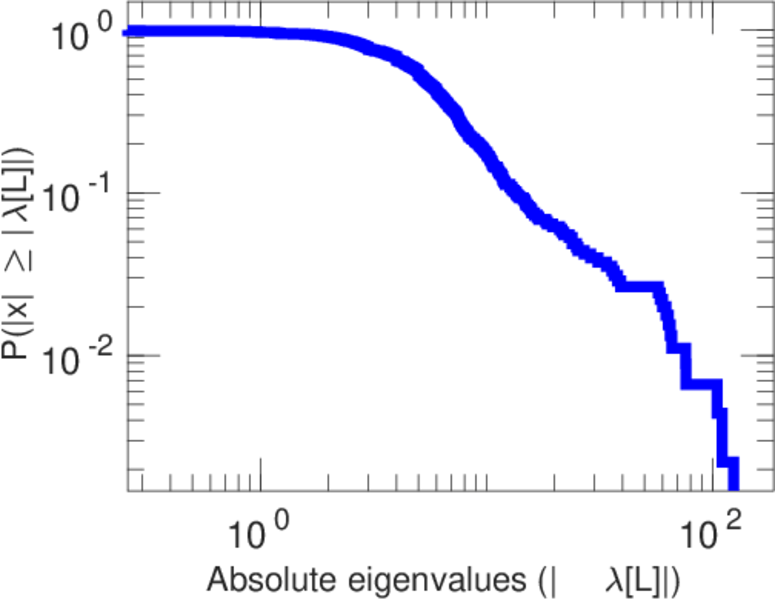
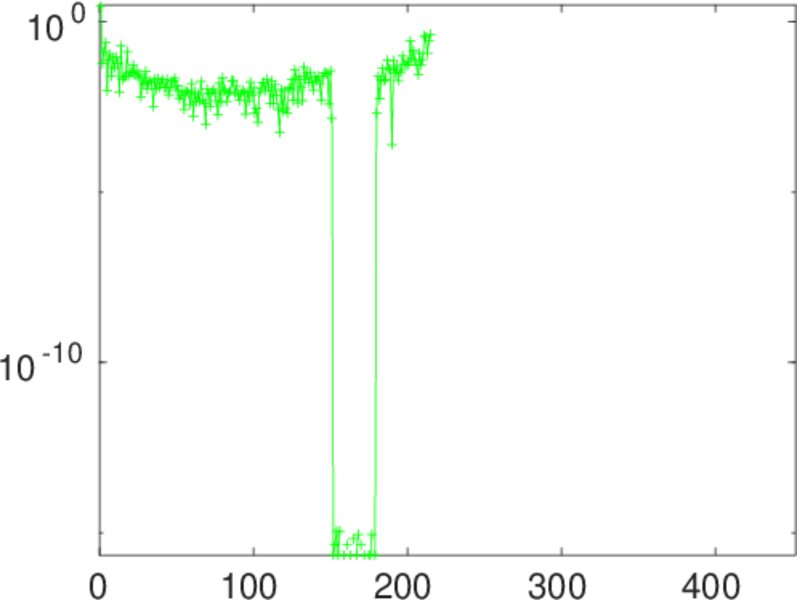
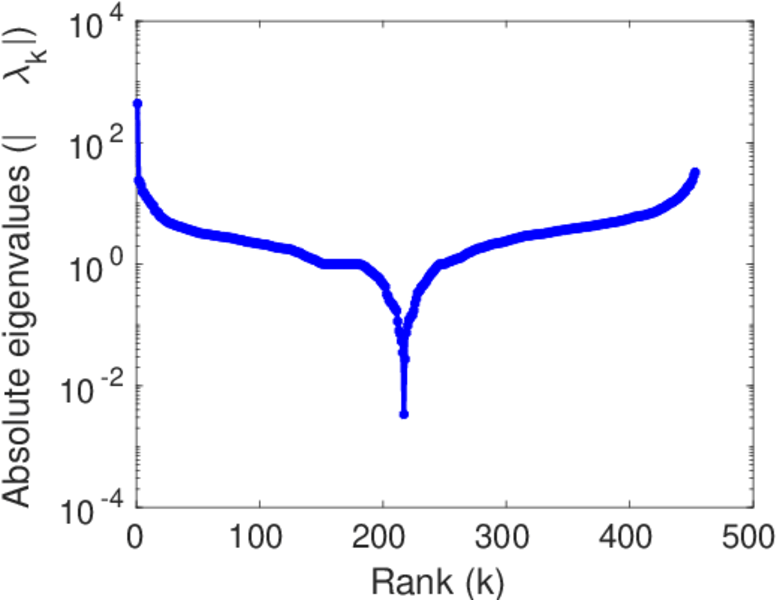
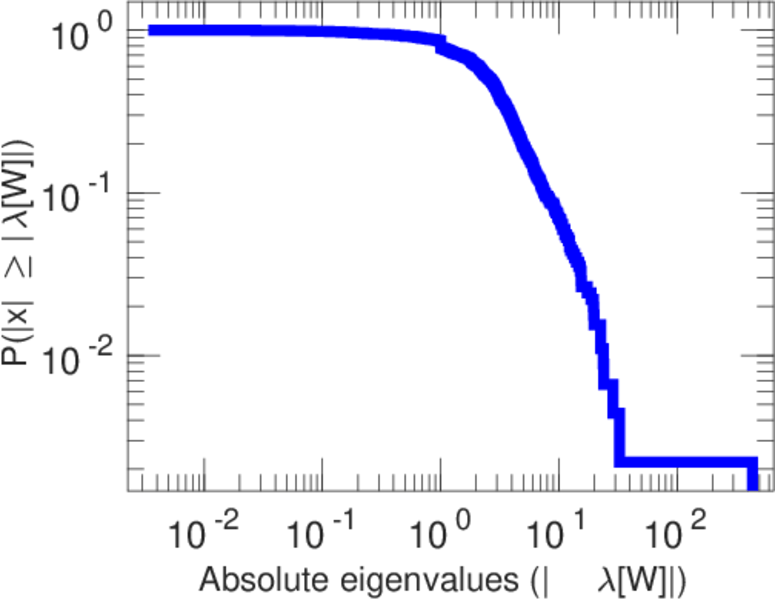
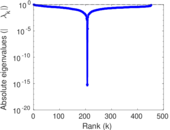
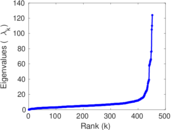
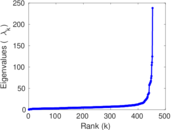
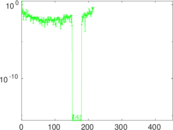
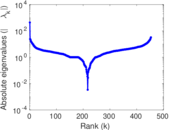
Matrix decompositions plots


Downloads
References
|
[1]
|
Jérôme Kunegis.
KONECT – The Koblenz Network Collection.
In Proc. Int. Conf. on World Wide Web Companion, pages
1343–1350, 2013.
[ http ]
|
|
[2]
|
Jordi Duch and Alex Arenas.
Community detection in complex networks using extremal optimization.
Phys. Rev. E, 72(2):027104, 2005.
|
|
[3]
|
Hawoong Jeong, Bálint Tombor, Réka Albert, Zoltan N. Oltvai, and
Albert-László Barabási.
The large-scale organization of metabolic networks.
Nature, 407:651–654, 2000.
|
|
[4]
|
Ross Overbeek, Niels Larsen, Gordon D. Pusch, Mark D'Souza, Evgeni Selkov Jr.,
Nikos Kyrpides, Michael Fonstein, Natalia Maltsev, and Evgeni Selkov.
WIT: Integrated system for high-throughput genome sequence analysis
and metabolic reconstruction.
Nucleic Acids Res., 28(1):123–125, 2000.
|
 KONECT ‣ Networks ‣
Buy Me a Coffee
KONECT ‣ Networks ‣
Buy Me a Coffee