Condensed matter (2003)
These are scientific collaboration in the area of Condensed Matter (physics).
It contains co-authorships from papers uploaded to arXiv in the "condensed
matter" section, in the time range 1995 to 2003.
Metadata
Statistics
| Size | n = | 30,460
|
| Volume | m = | 120,029
|
| Loop count | l = | 0
|
| Wedge count | s = | 2,489,239
|
| Claw count | z = | 42,828,081
|
| Cross count | x = | 976,339,458
|
| Triangle count | t = | 232,994
|
| Square count | q = | 2,200,663
|
| 4-Tour count | T4 = | 27,802,318
|
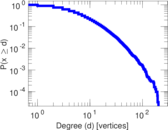
| Maximum degree | dmax = | 202
|
| Average degree | d = | 7.881 09
|
| Fill | p = | 0.000 258 744
|
| Size of LCC | N = | 27,519
|
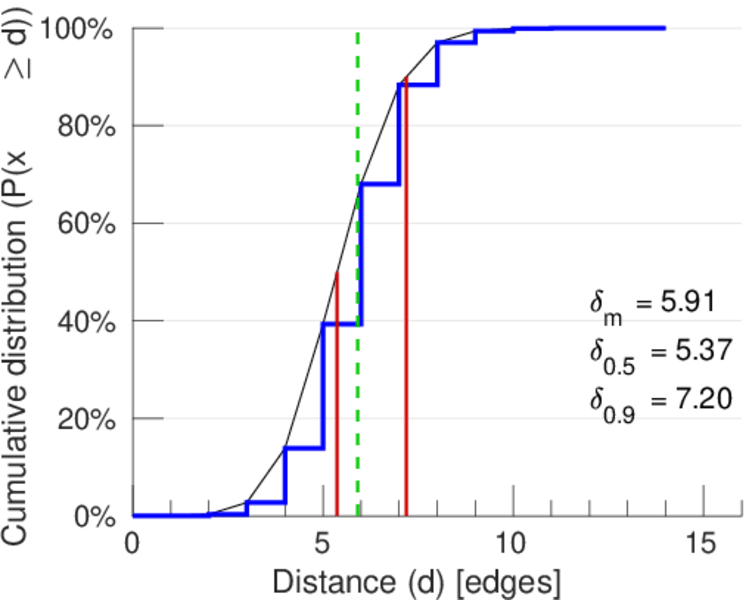
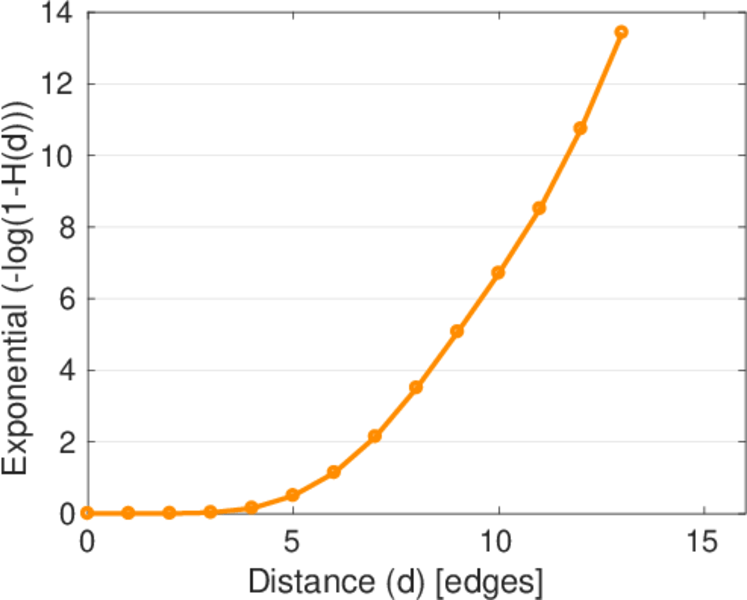
| Diameter | δ = | 16
|
| 50-Percentile effective diameter | δ0.5 = | 5.372 28
|
| 90-Percentile effective diameter | δ0.9 = | 7.195 30
|
| Median distance | δM = | 6
|
| Mean distance | δm = | 5.911 84
|
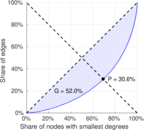
| Gini coefficient | G = | 0.519 927
|
| Balanced inequality ratio | P = | 0.305 909
|
| Relative edge distribution entropy | Her = | 0.950 974
|
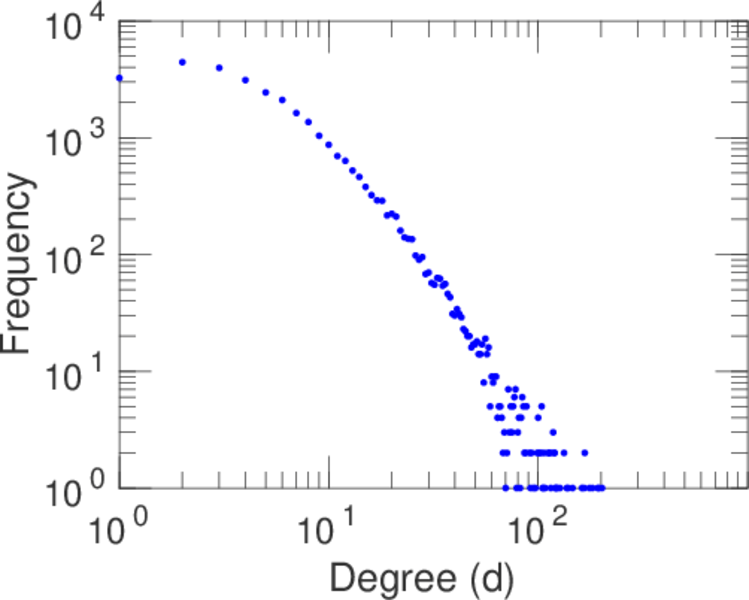
| Power law exponent | γ = | 1.631 95
|
| Tail power law exponent | γt = | 3.621 00
|
| Tail power law exponent with p | γ3 = | 3.621 00
|
| p-value | p = | 0.061 000 0
|
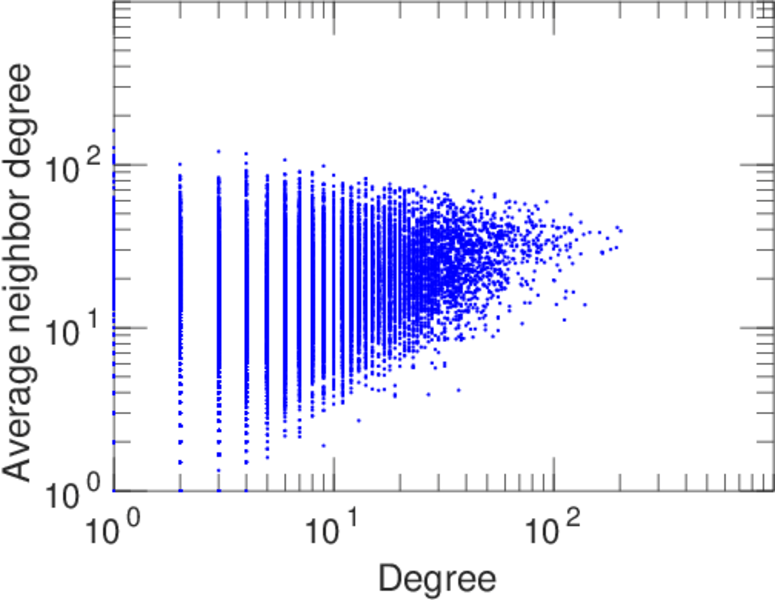
| Degree assortativity | ρ = | +0.178 214
|
| Degree assortativity p-value | pρ = | 0.000 00
|
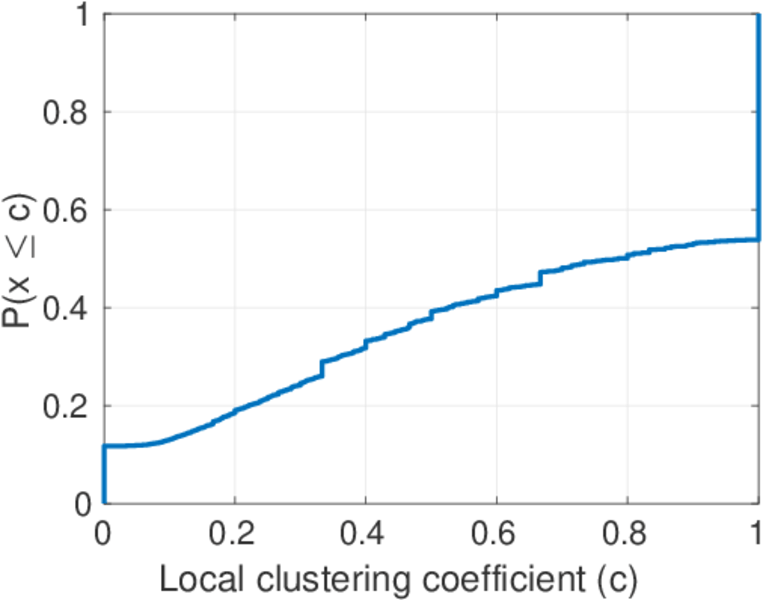
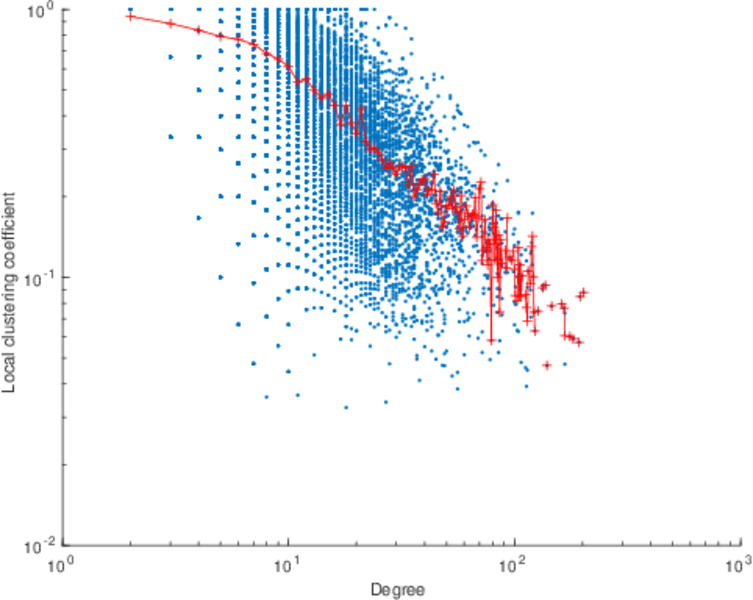
| Clustering coefficient | c = | 0.280 801
|
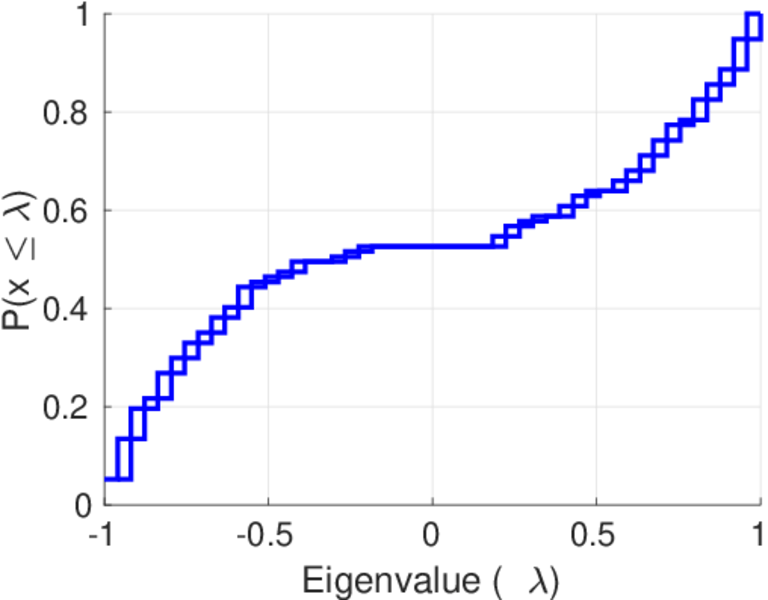
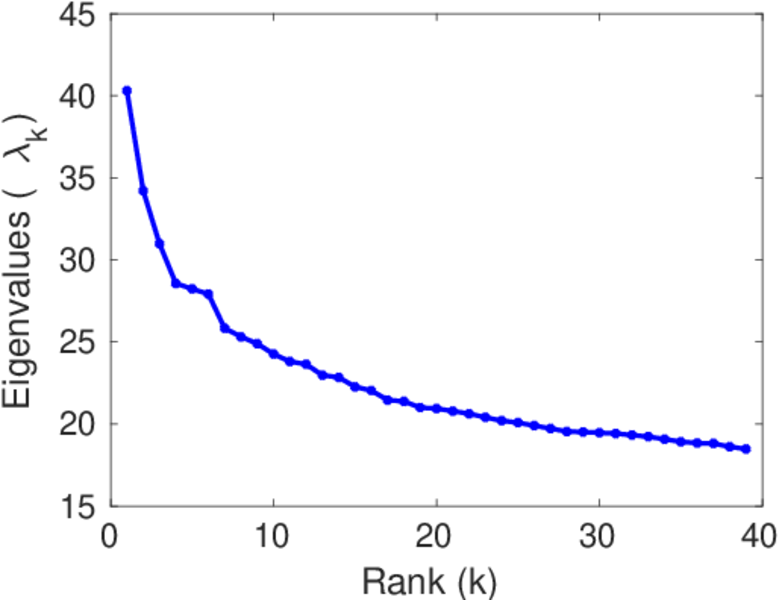
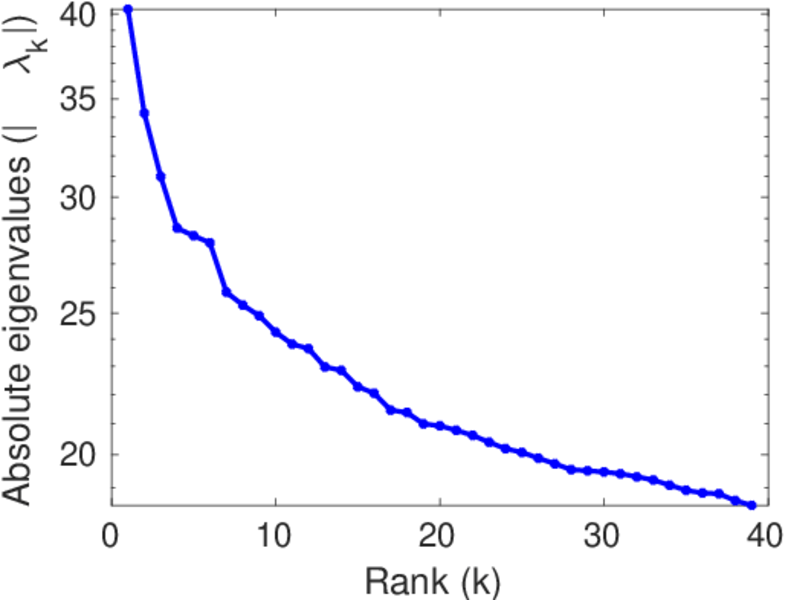
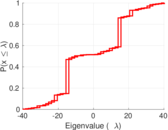
| Spectral norm | α = | 40.309 7
|
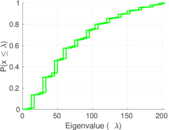
| Algebraic connectivity | a = | 0.027 584 2
|
| Spectral separation | |λ1[A] / λ2[A]| = | 1.177 90
|
| Non-bipartivity | bA = | 0.607 353
|
| Normalized non-bipartivity | bN = | 0.075 005 1
|
| Algebraic non-bipartivity | χ = | 0.128 075
|
| Spectral bipartite frustration | bK = | 0.003 792 04
|
| Controllability | C = | 2,026
|
| Relative controllability | Cr = | 0.066 513 5
|
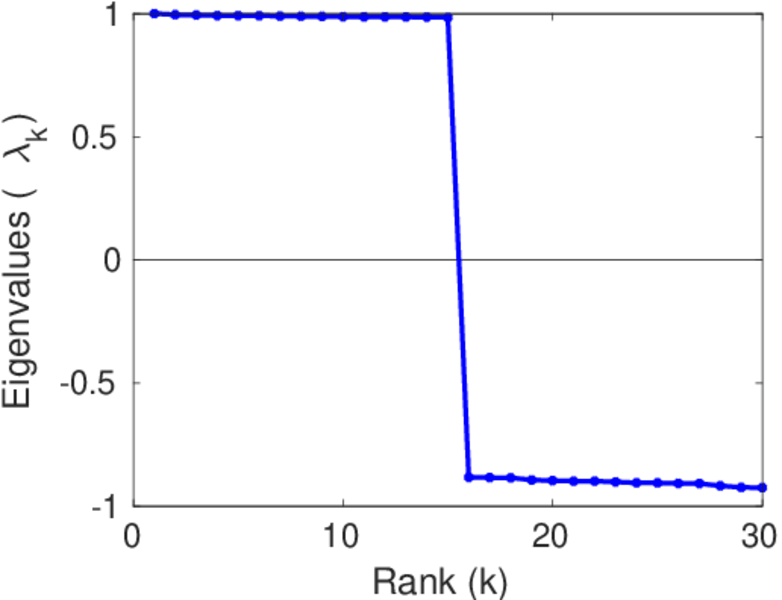
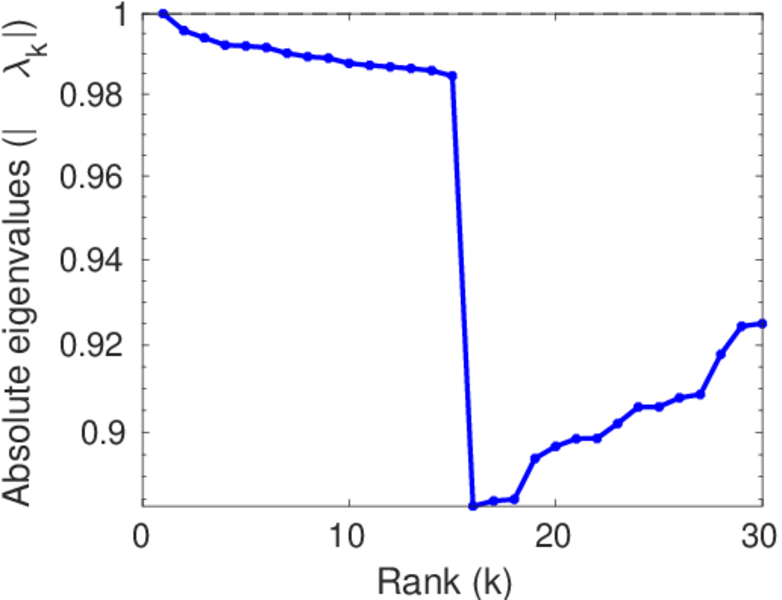
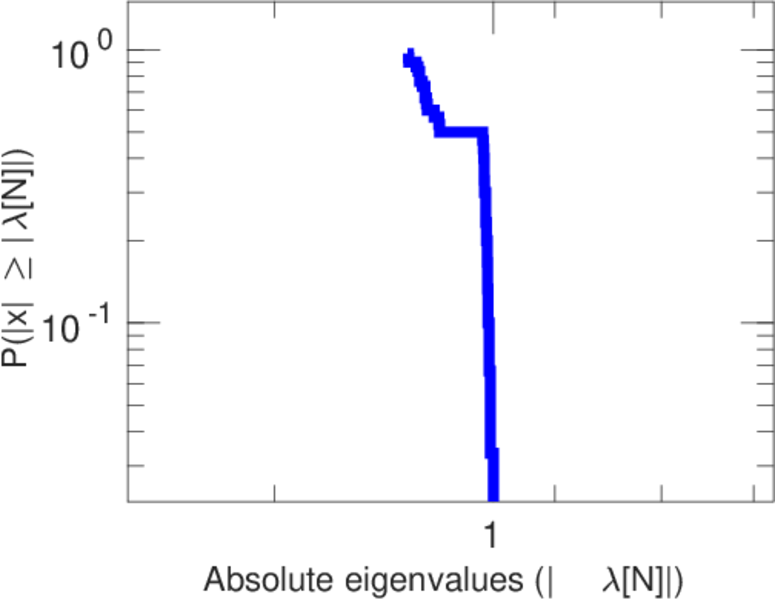
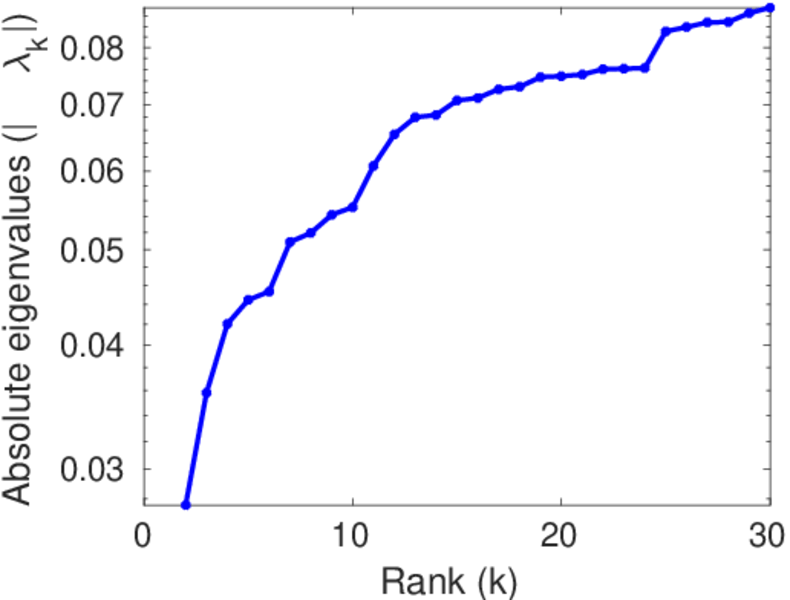
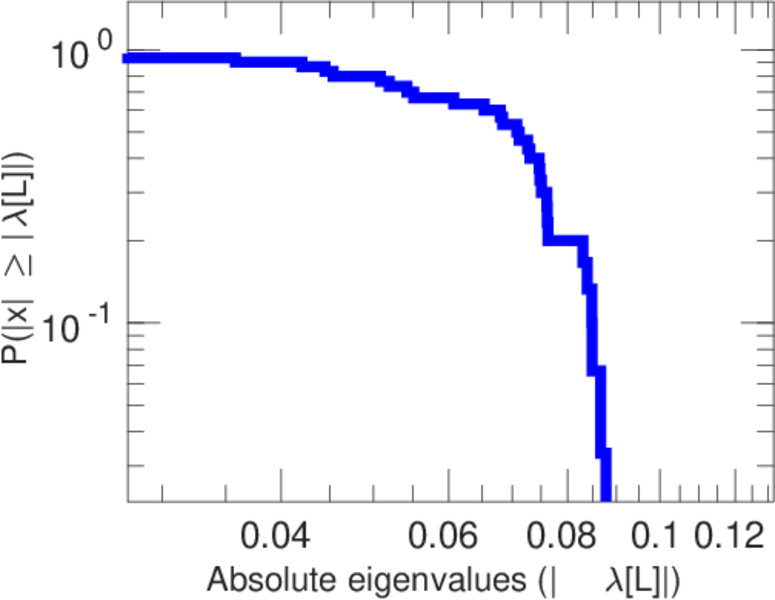
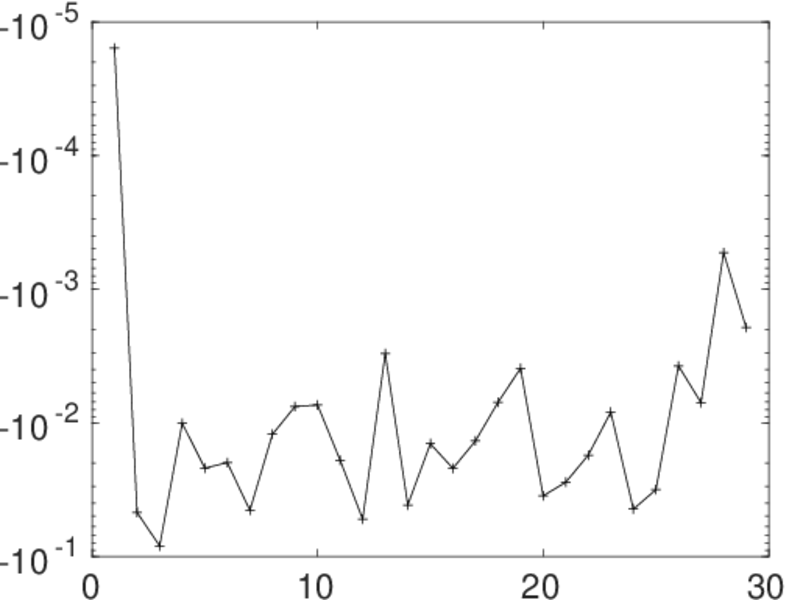
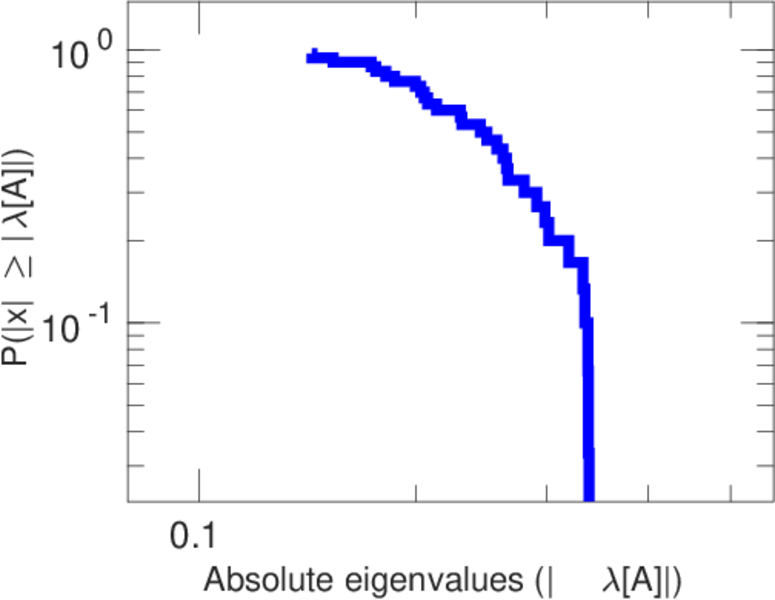
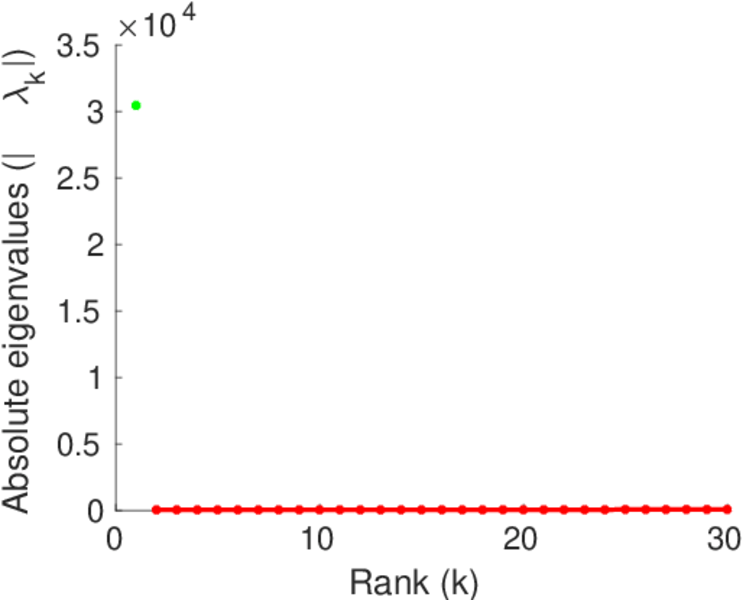
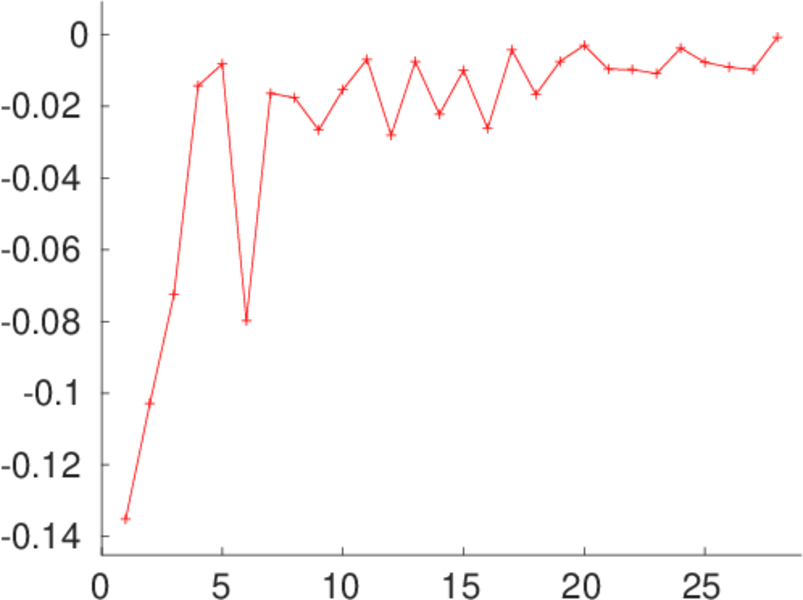
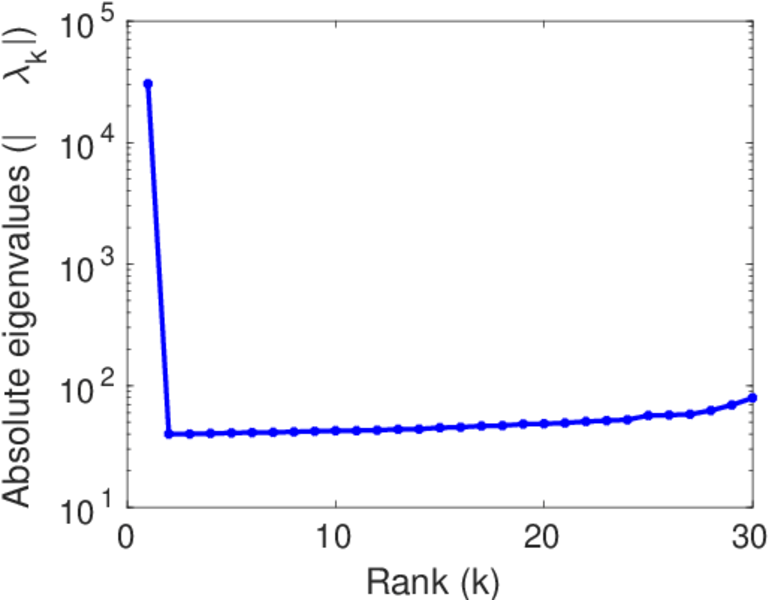
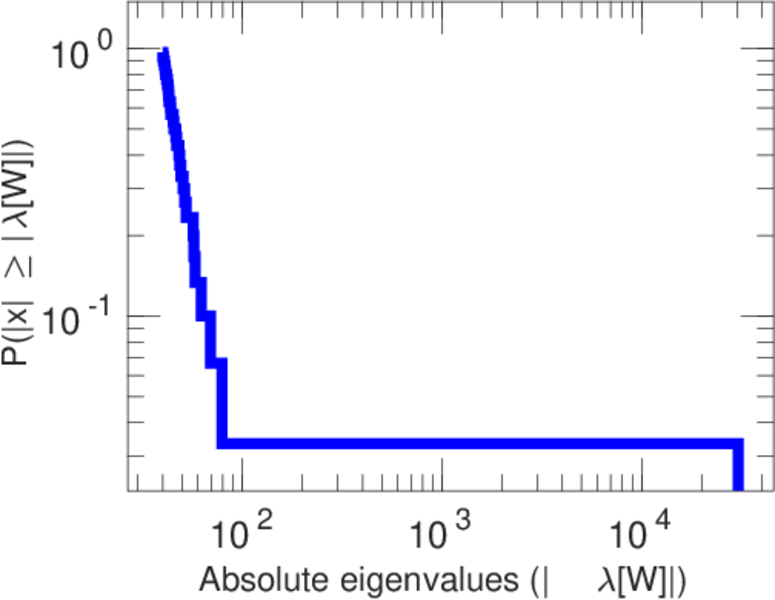
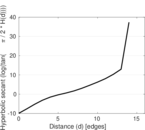
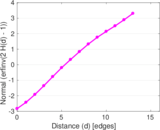
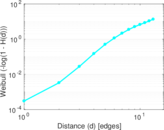
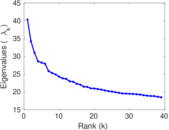
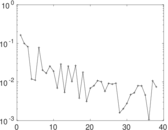
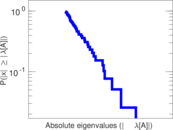
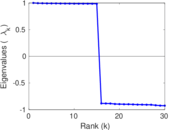
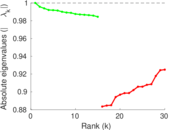
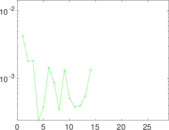
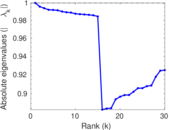
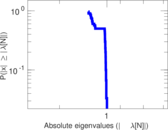
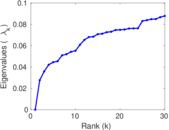
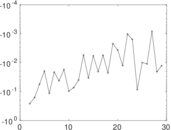
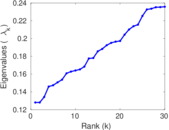
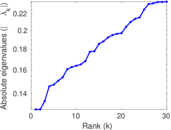
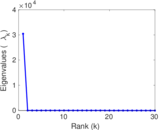
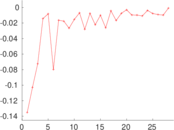
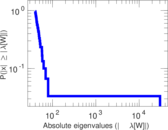
Plots


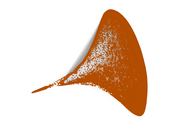
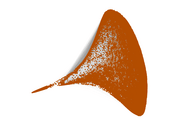


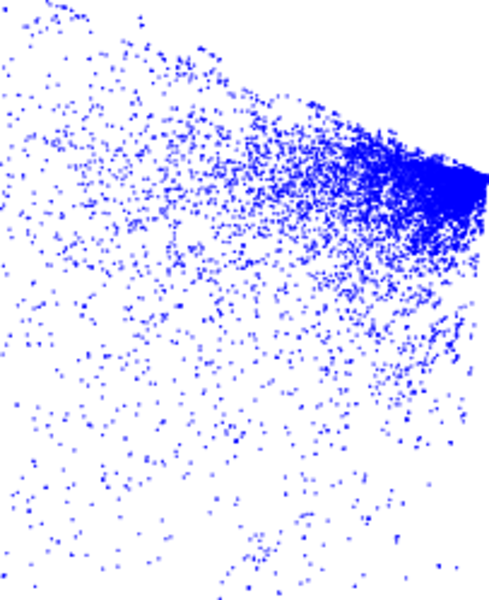
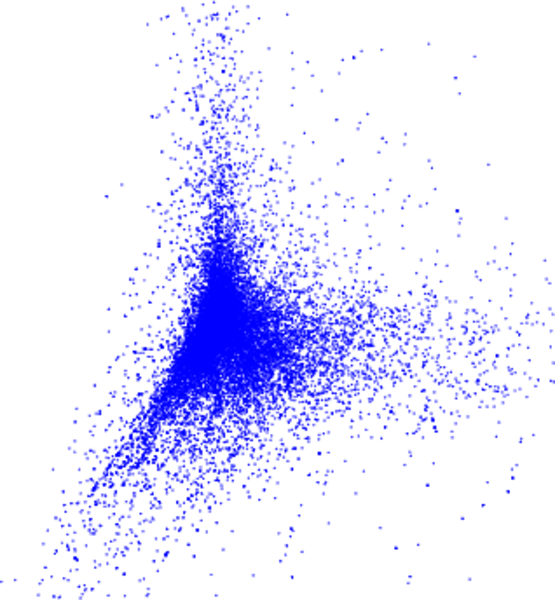
Matrix decompositions plots


Downloads
References
|
[1]
|
Jérôme Kunegis.
KONECT – The Koblenz Network Collection.
In Proc. Int. Conf. on World Wide Web Companion, pages
1343–1350, 2013.
[ http ]
|
|
[2]
|
Mark E. J. Newman.
The structure of scientific collaboration networks.
Proc. Natl. Acad. Sci. U.S.A., 98(2):404–409, 2001.
|
|
[3]
|
Jordi Duch and Alex Arenas.
Community detection in complex networks using extremal optimization.
Phys. Rev. E, 72(2):027104, 2005.
|
 KONECT ‣ Networks ‣
Buy Me a Coffee
KONECT ‣ Networks ‣
Buy Me a Coffee