Condensed matter (2005)
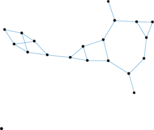
These are co-authorships between authors of papers uploaded to the "condensed
matter" section of arXiv. As noted from the dataset source: "[...] the
original graph contains two edges with weight inf[ormation], these were removed
before making the graph unweighted."
Metadata
Statistics
| Size | n = | 39,577
|
| Volume | m = | 175,691
|
| Loop count | l = | 0
|
| Wedge count | s = | 4,629,240
|
| Claw count | z = | 106,646,864
|
| Cross count | x = | 3,241,514,847
|
| Triangle count | t = | 378,059
|
| Square count | q = | 4,325,174
|
| 4-Tour count | T4 = | 53,469,734
|
| Maximum degree | dmax = | 278
|
| Average degree | d = | 8.878 44
|
| Fill | p = | 0.000 224 339
|
| Size of LCC | N = | 36,458
|
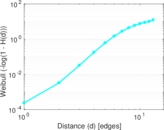
| Diameter | δ = | 18
|
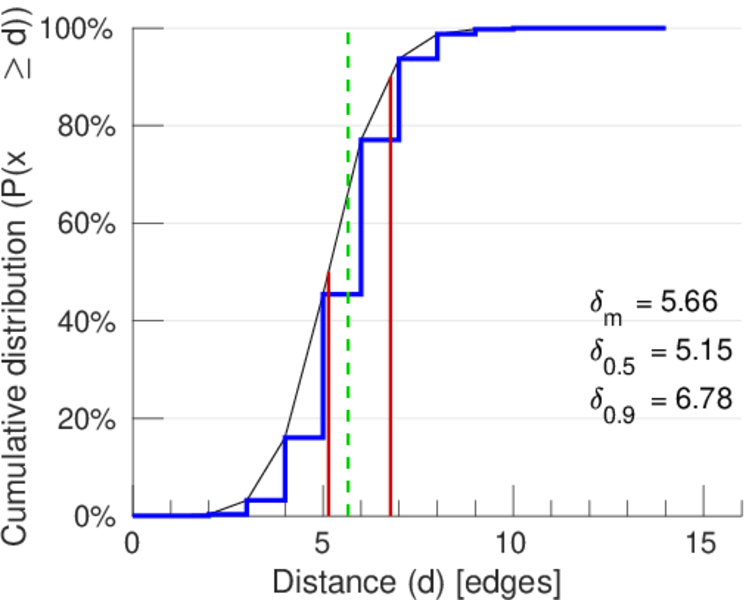
| 50-Percentile effective diameter | δ0.5 = | 5.145 42
|
| 90-Percentile effective diameter | δ0.9 = | 6.777 24
|
| Median distance | δM = | 6
|
| Mean distance | δm = | 5.658 82
|
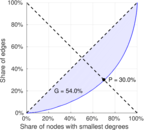
| Gini coefficient | G = | 0.540 149
|
| Balanced inequality ratio | P = | 0.299 617
|
| Relative edge distribution entropy | Her = | 0.947 144
|
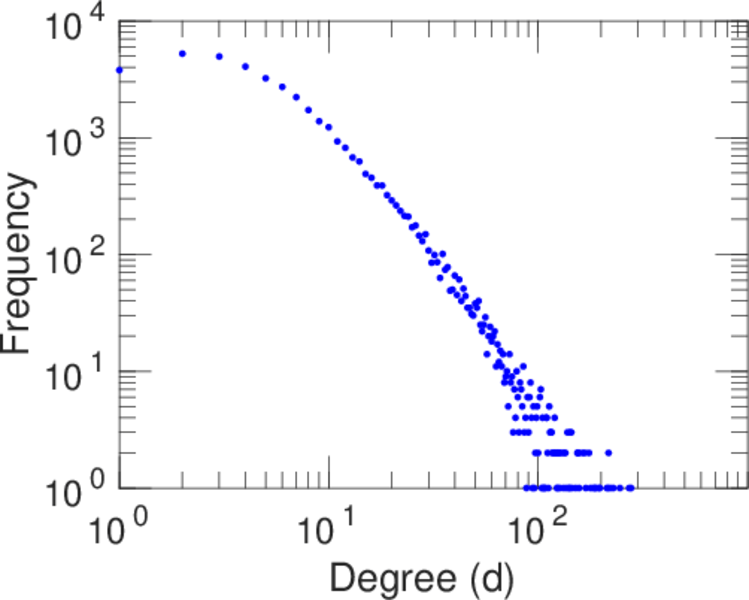
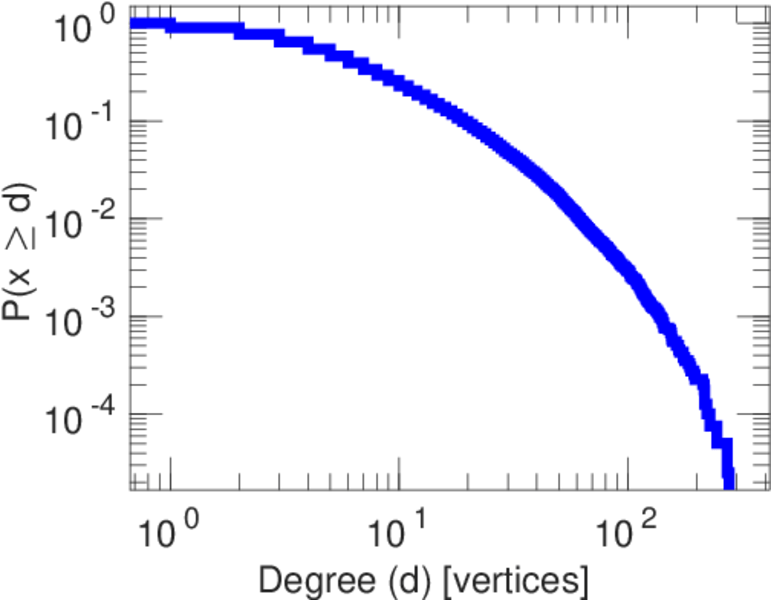
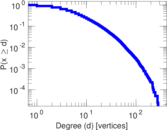
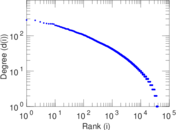
| Power law exponent | γ = | 1.602 16
|
| Tail power law exponent | γt = | 3.651 00
|
| Tail power law exponent with p | γ3 = | 3.651 00
|
| p-value | p = | 0.147 000
|
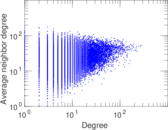
| Degree assortativity | ρ = | +0.186 327
|
| Degree assortativity p-value | pρ = | 0.000 00
|
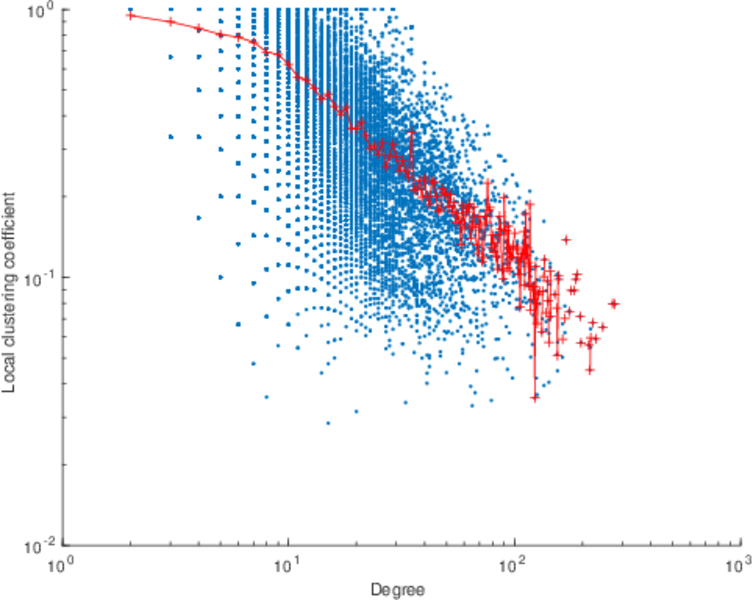
| Clustering coefficient | c = | 0.245 003
|
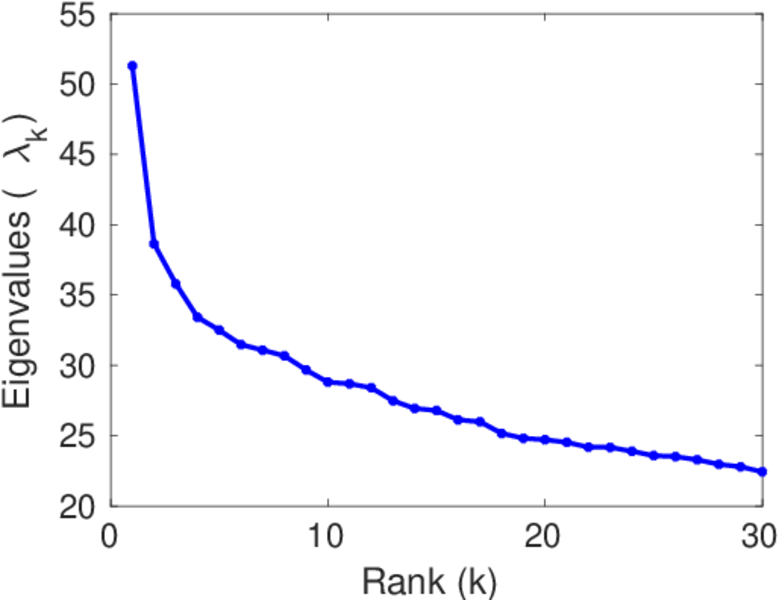
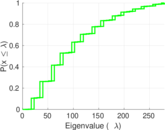
| Spectral norm | α = | 51.285 7
|
| Algebraic connectivity | a = | 0.019 318 5
|
| Spectral separation | |λ1[A] / λ2[A]| = | 1.327 44
|
| Non-bipartivity | bA = | 0.641 674
|
| Normalized non-bipartivity | bN = | 0.050 332 4
|
| Algebraic non-bipartivity | χ = | 0.088 251 8
|
| Spectral bipartite frustration | bK = | 0.002 341 91
|
| Controllability | C = | 2,467
|
| Relative controllability | Cr = | 0.062 334 2
|
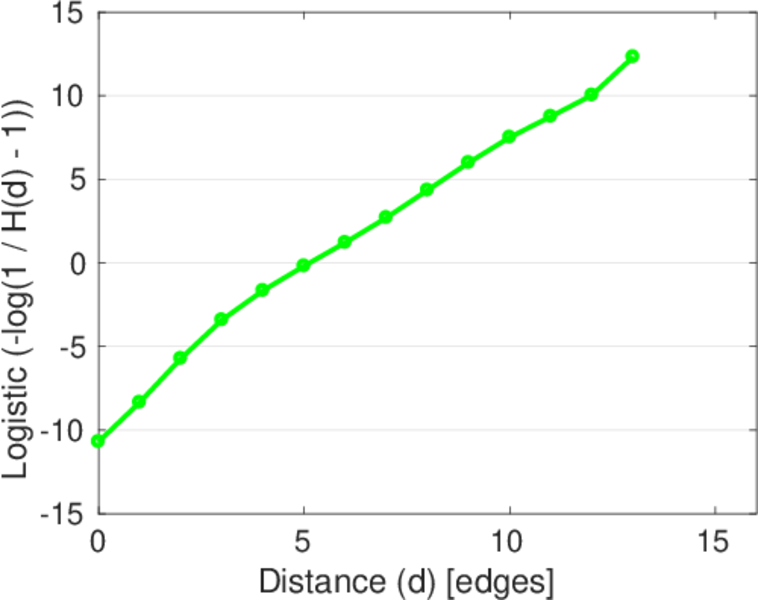
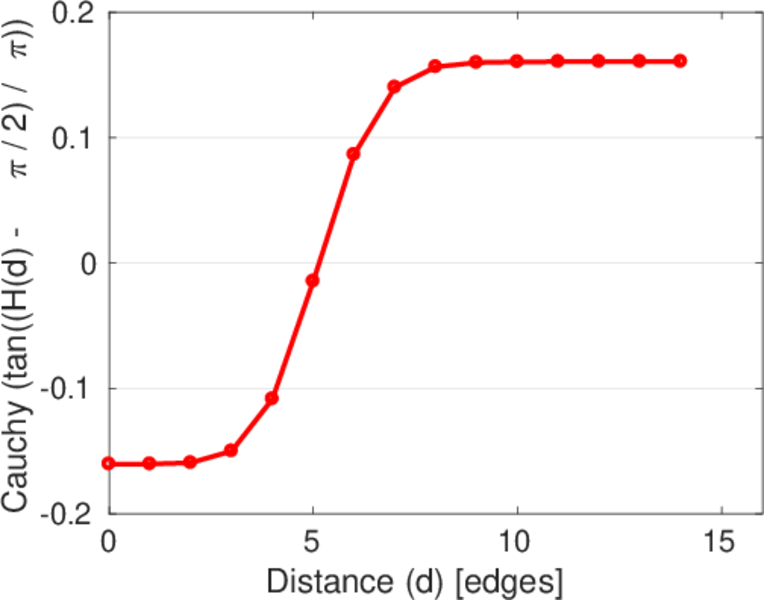
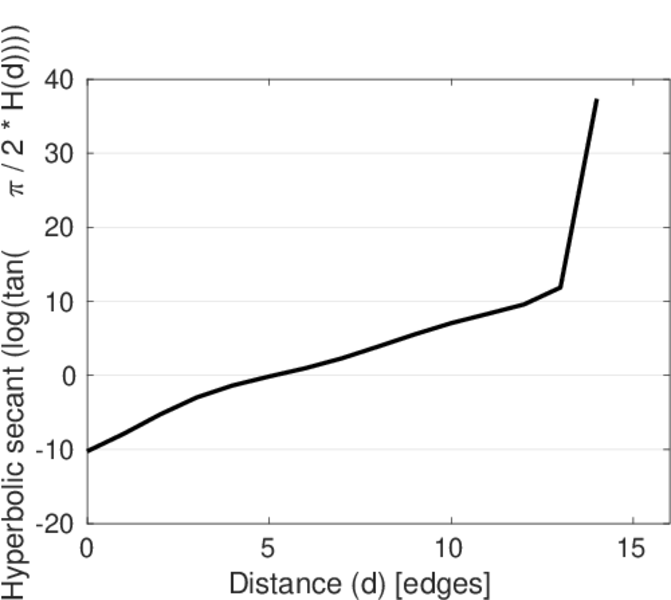
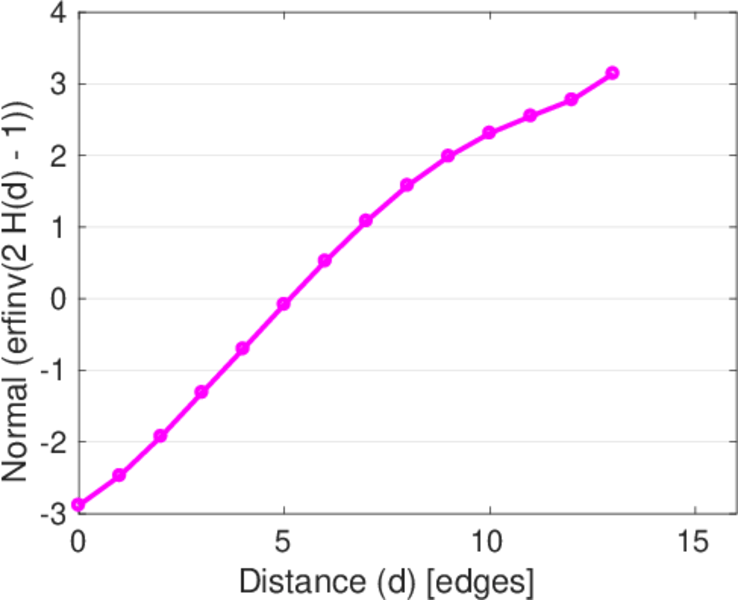
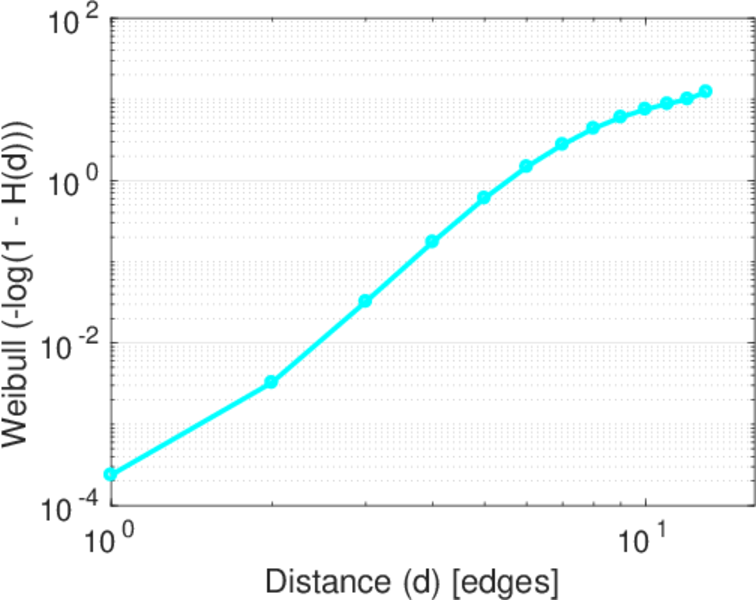
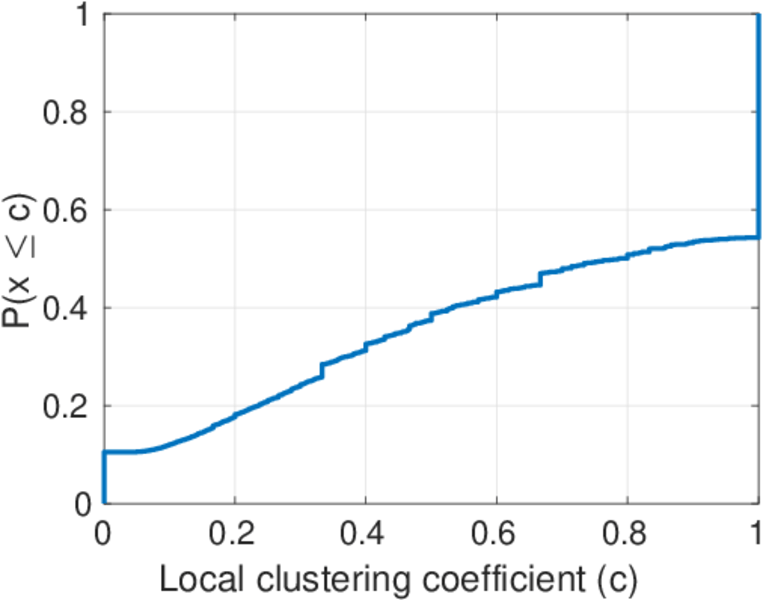
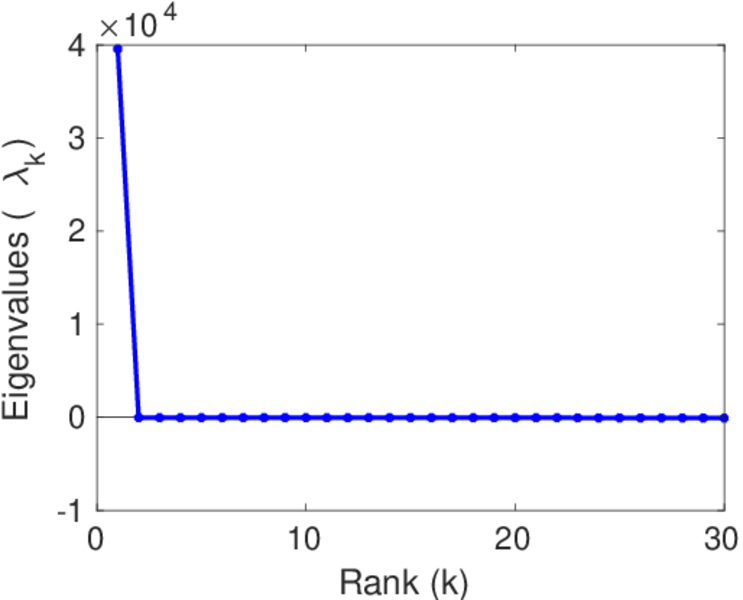
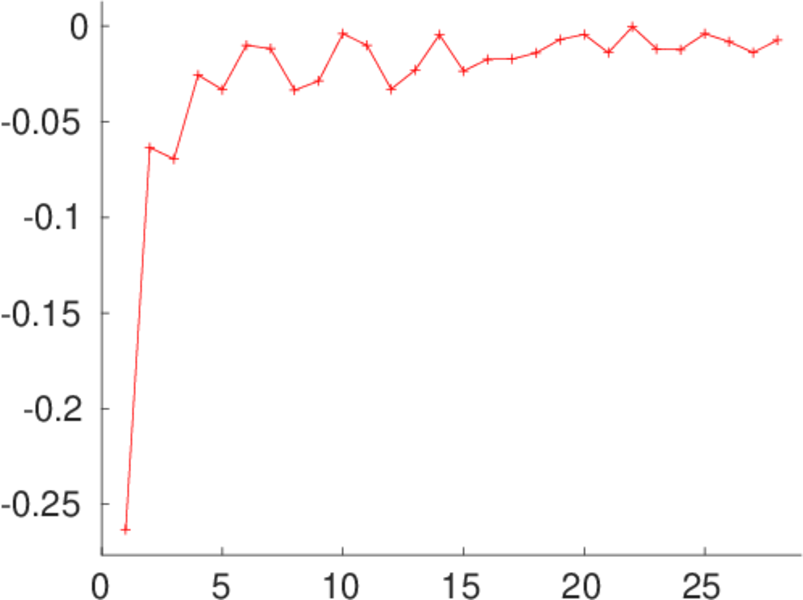
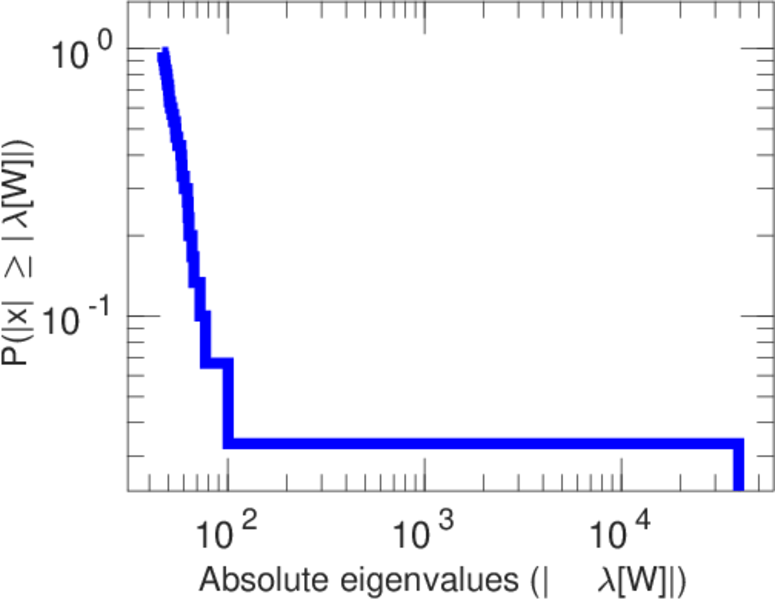
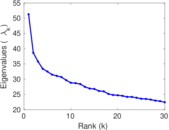
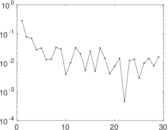
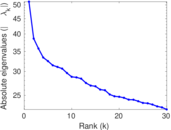
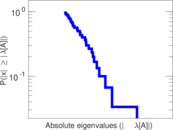
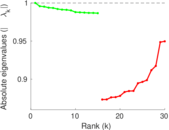
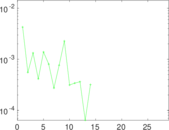
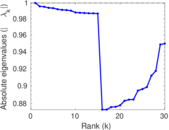
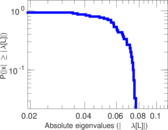
Plots


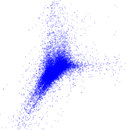


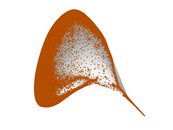
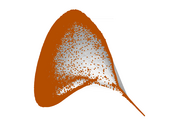


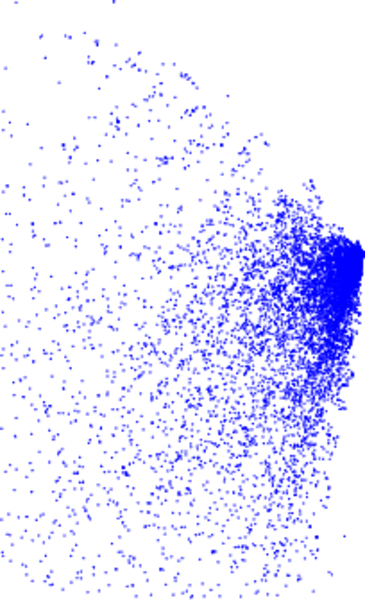
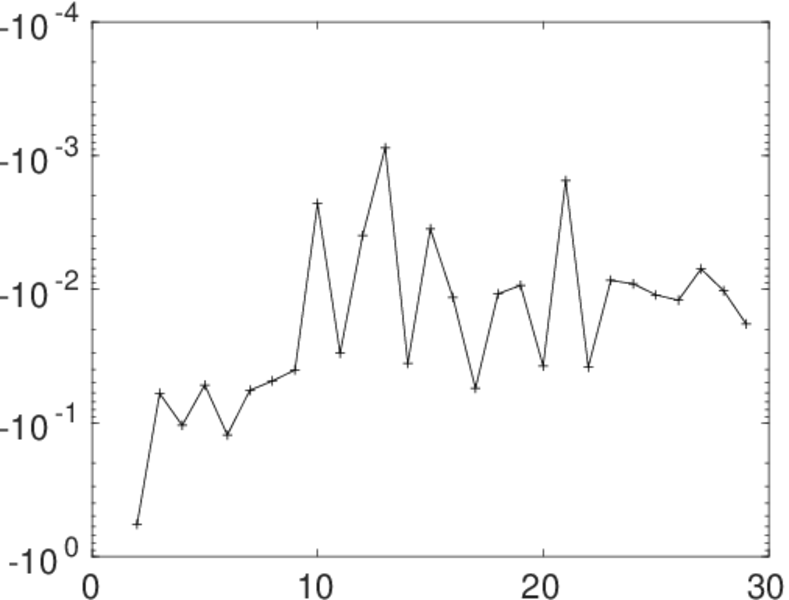
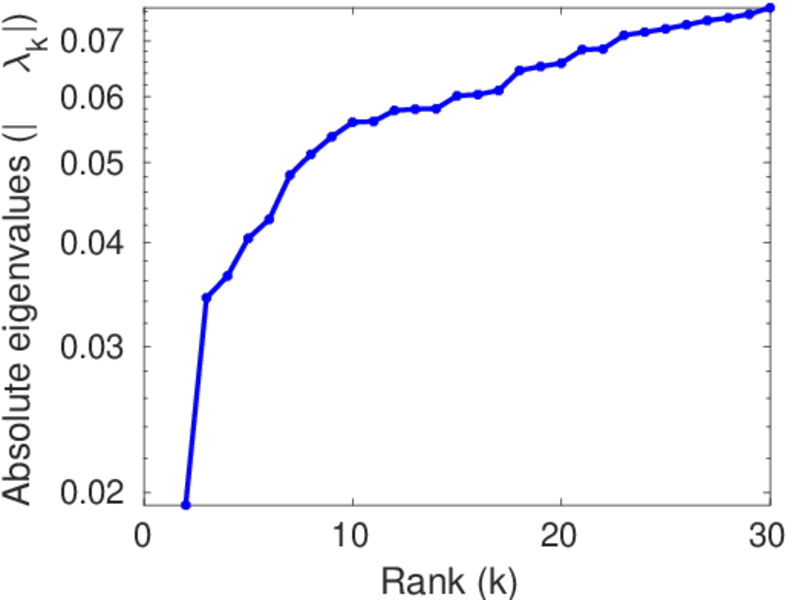
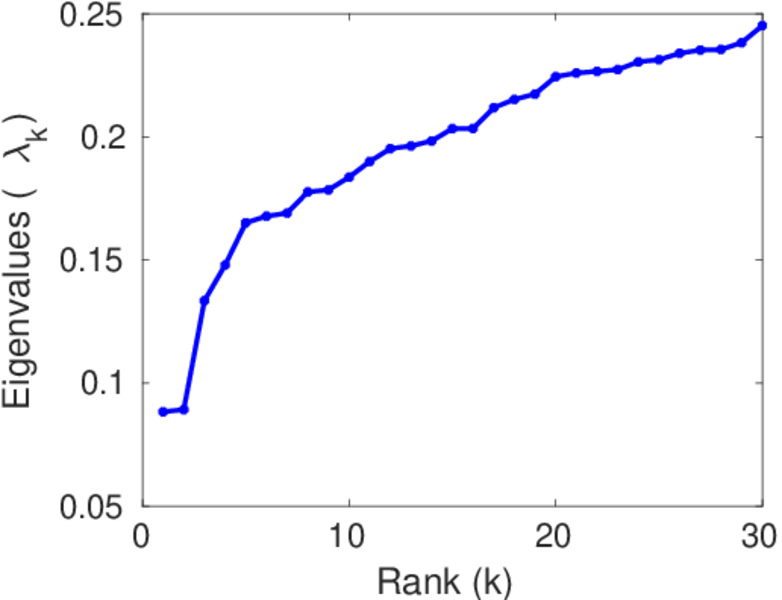
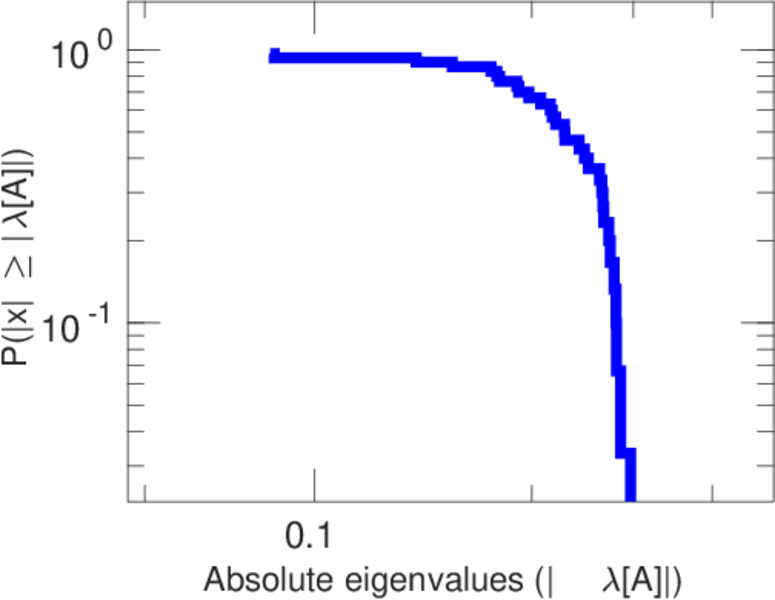
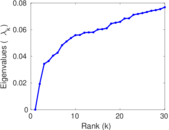
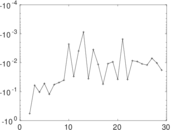
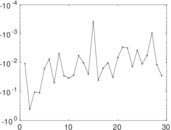
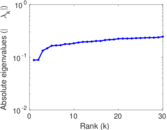
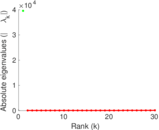
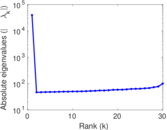
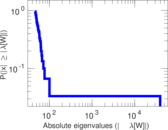
Matrix decompositions plots


Downloads
References
|
[1]
|
Jérôme Kunegis.
KONECT – The Koblenz Network Collection.
In Proc. Int. Conf. on World Wide Web Companion, pages
1343–1350, 2013.
[ http ]
|
|
[2]
|
Mark E. J. Newman.
The structure of scientific collaboration networks.
Proc. Natl. Acad. Sci. U.S.A., 98(2):404–409, 2001.
|
 KONECT ‣ Networks ‣
Buy Me a Coffee
KONECT ‣ Networks ‣
Buy Me a Coffee