 KONECT ‣ Networks ‣
Buy Me a Coffee
KONECT ‣ Networks ‣
Buy Me a Coffee
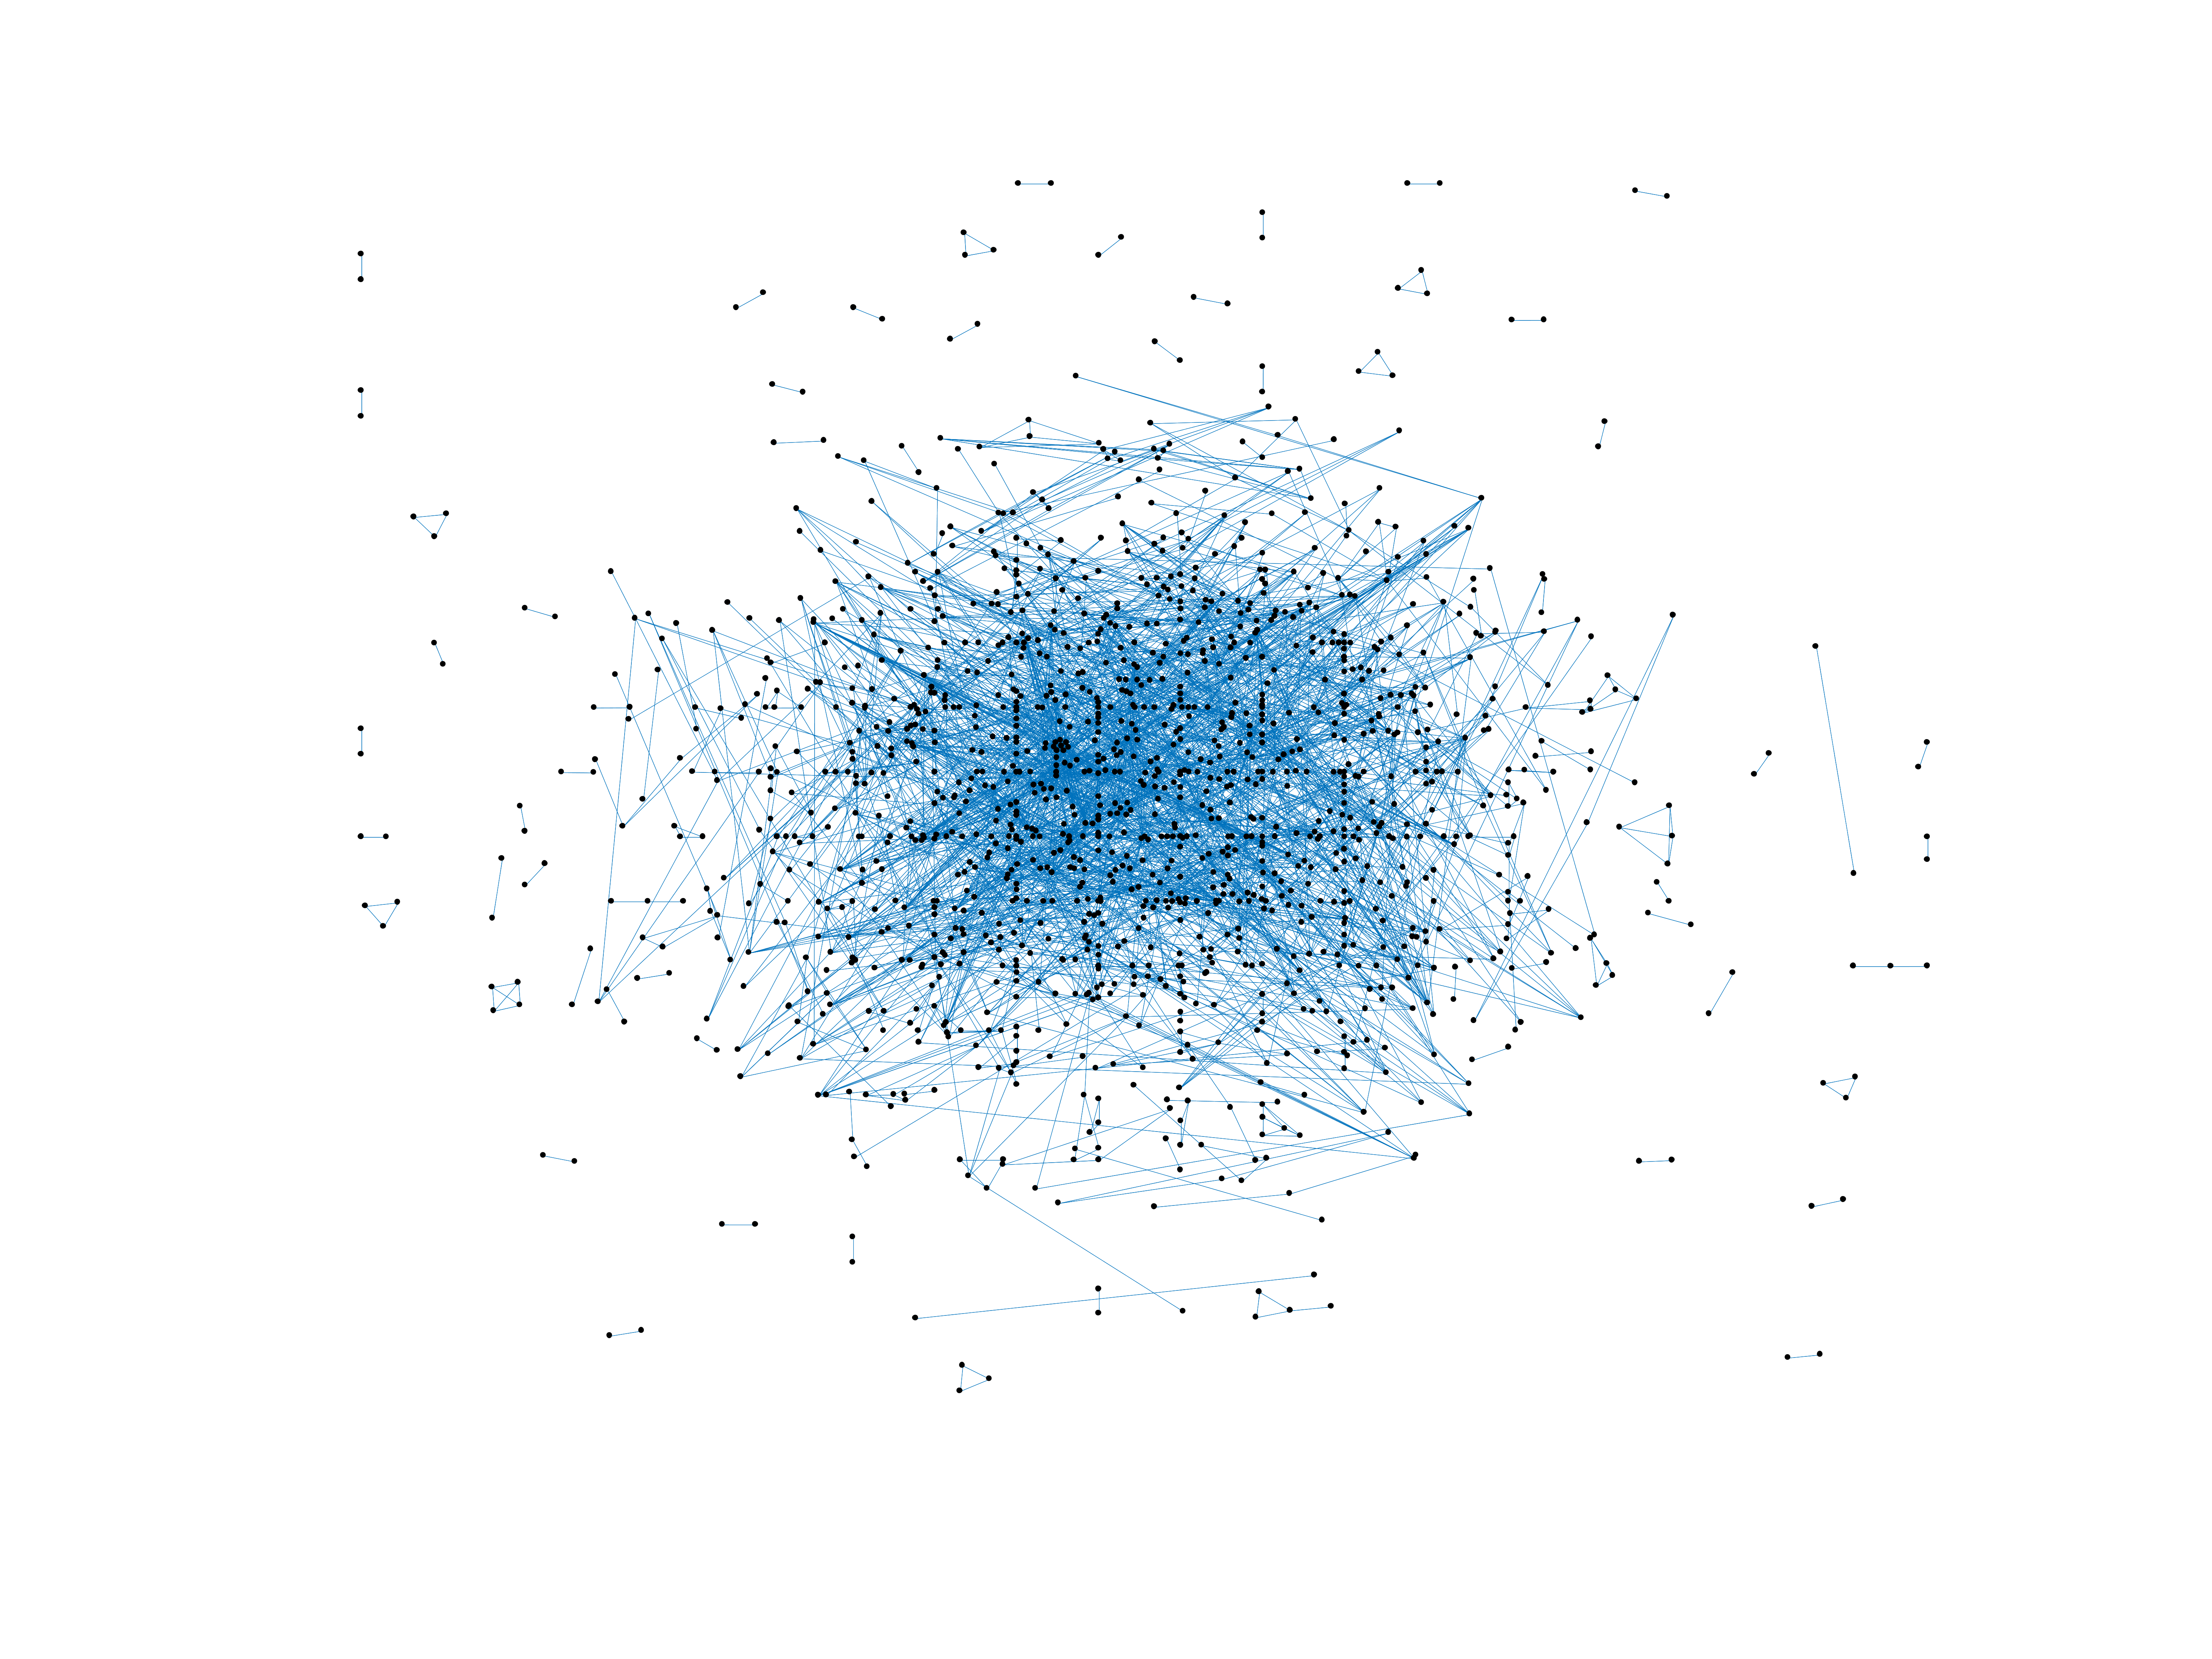
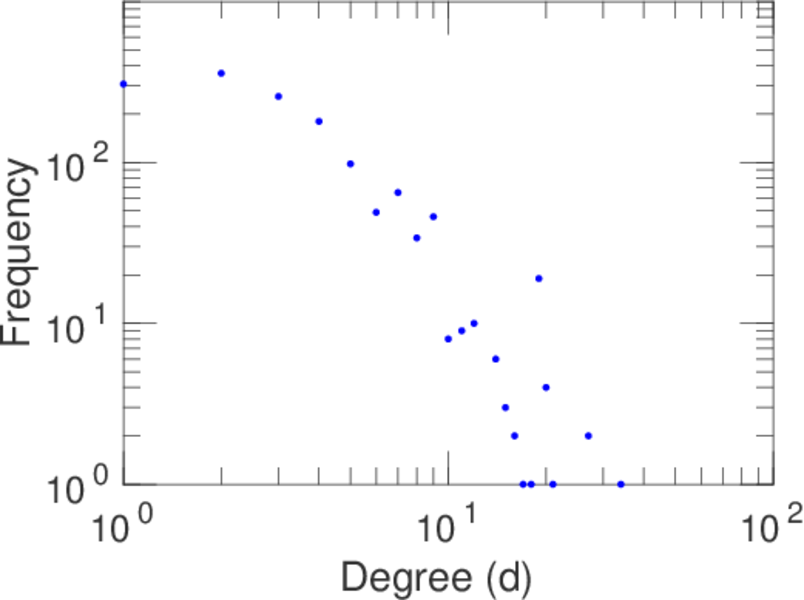
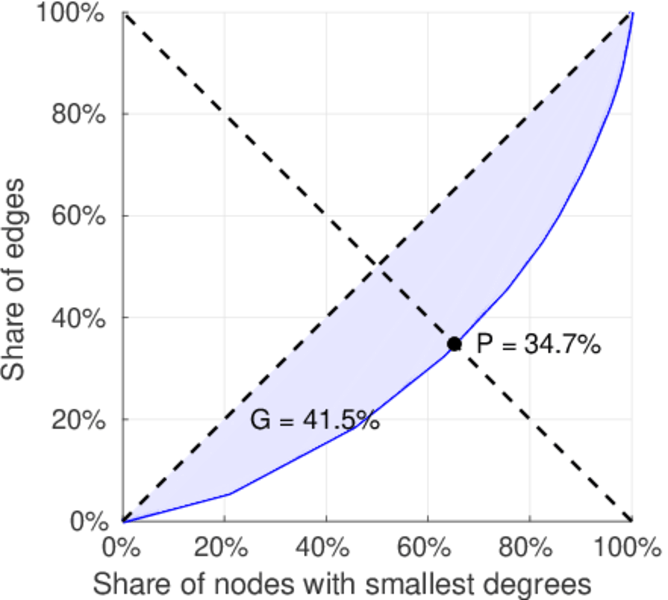
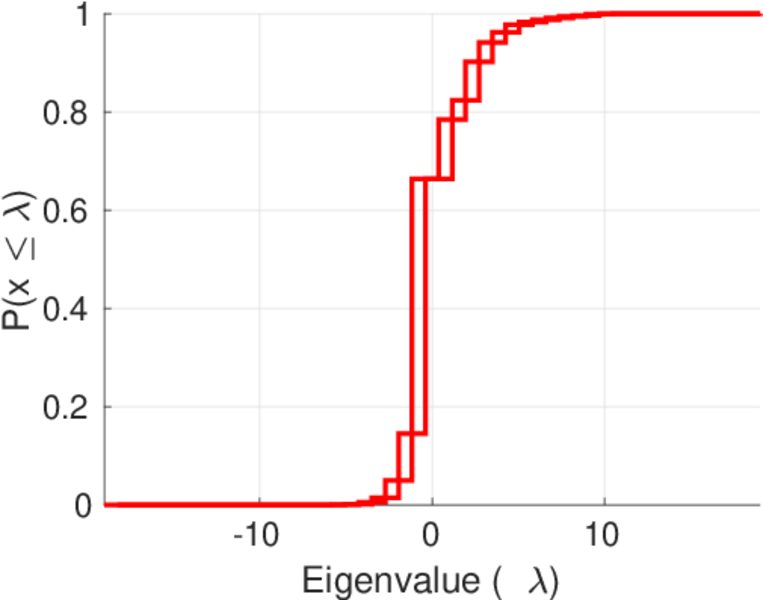
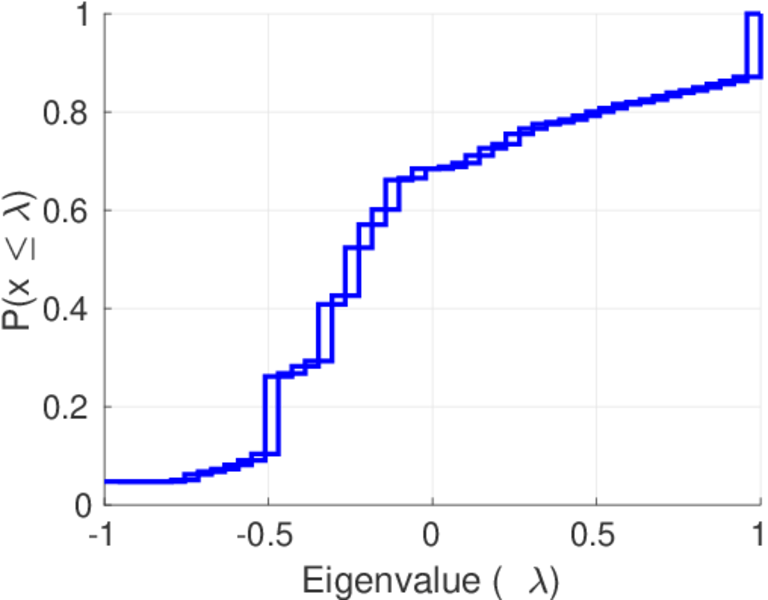
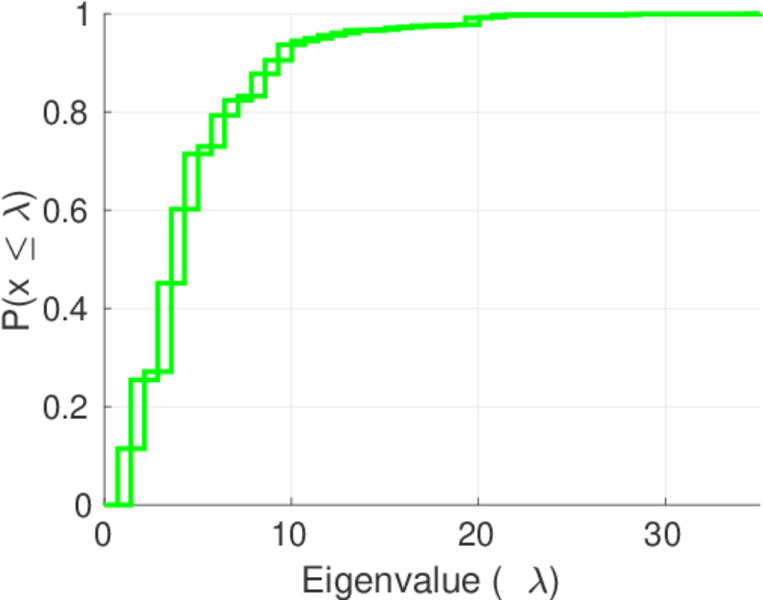
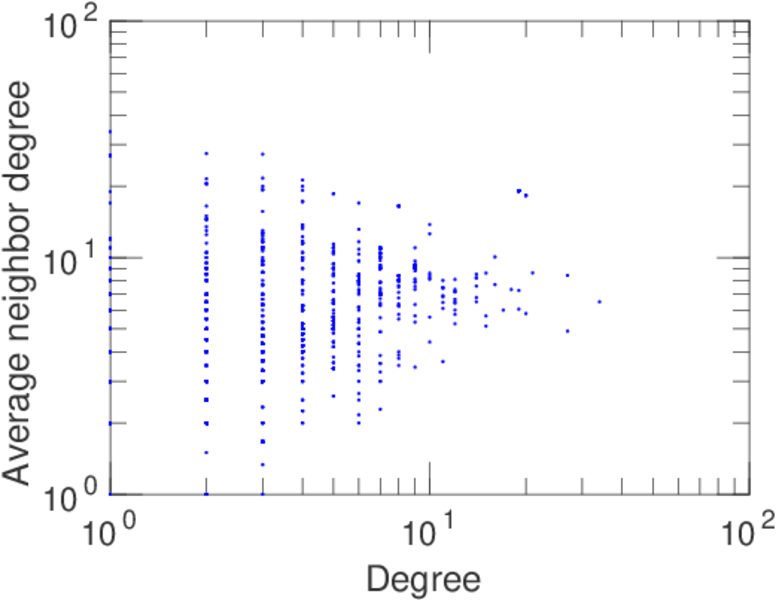
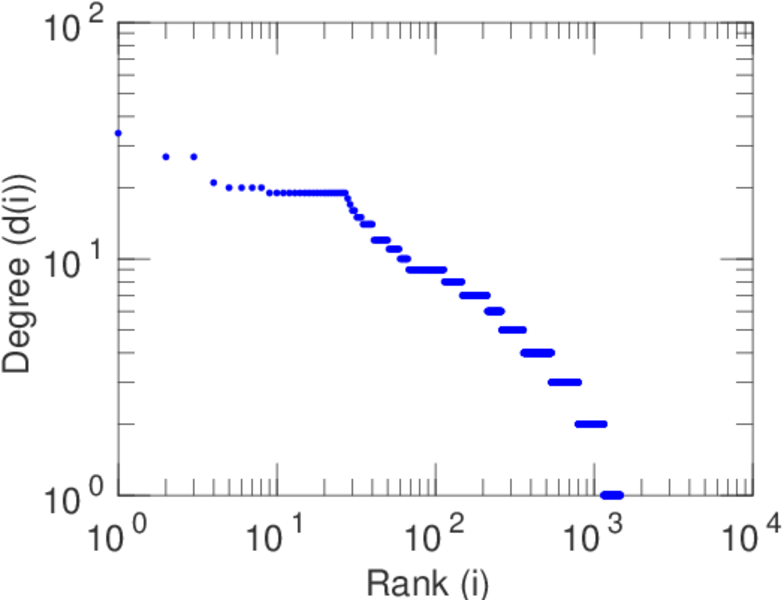
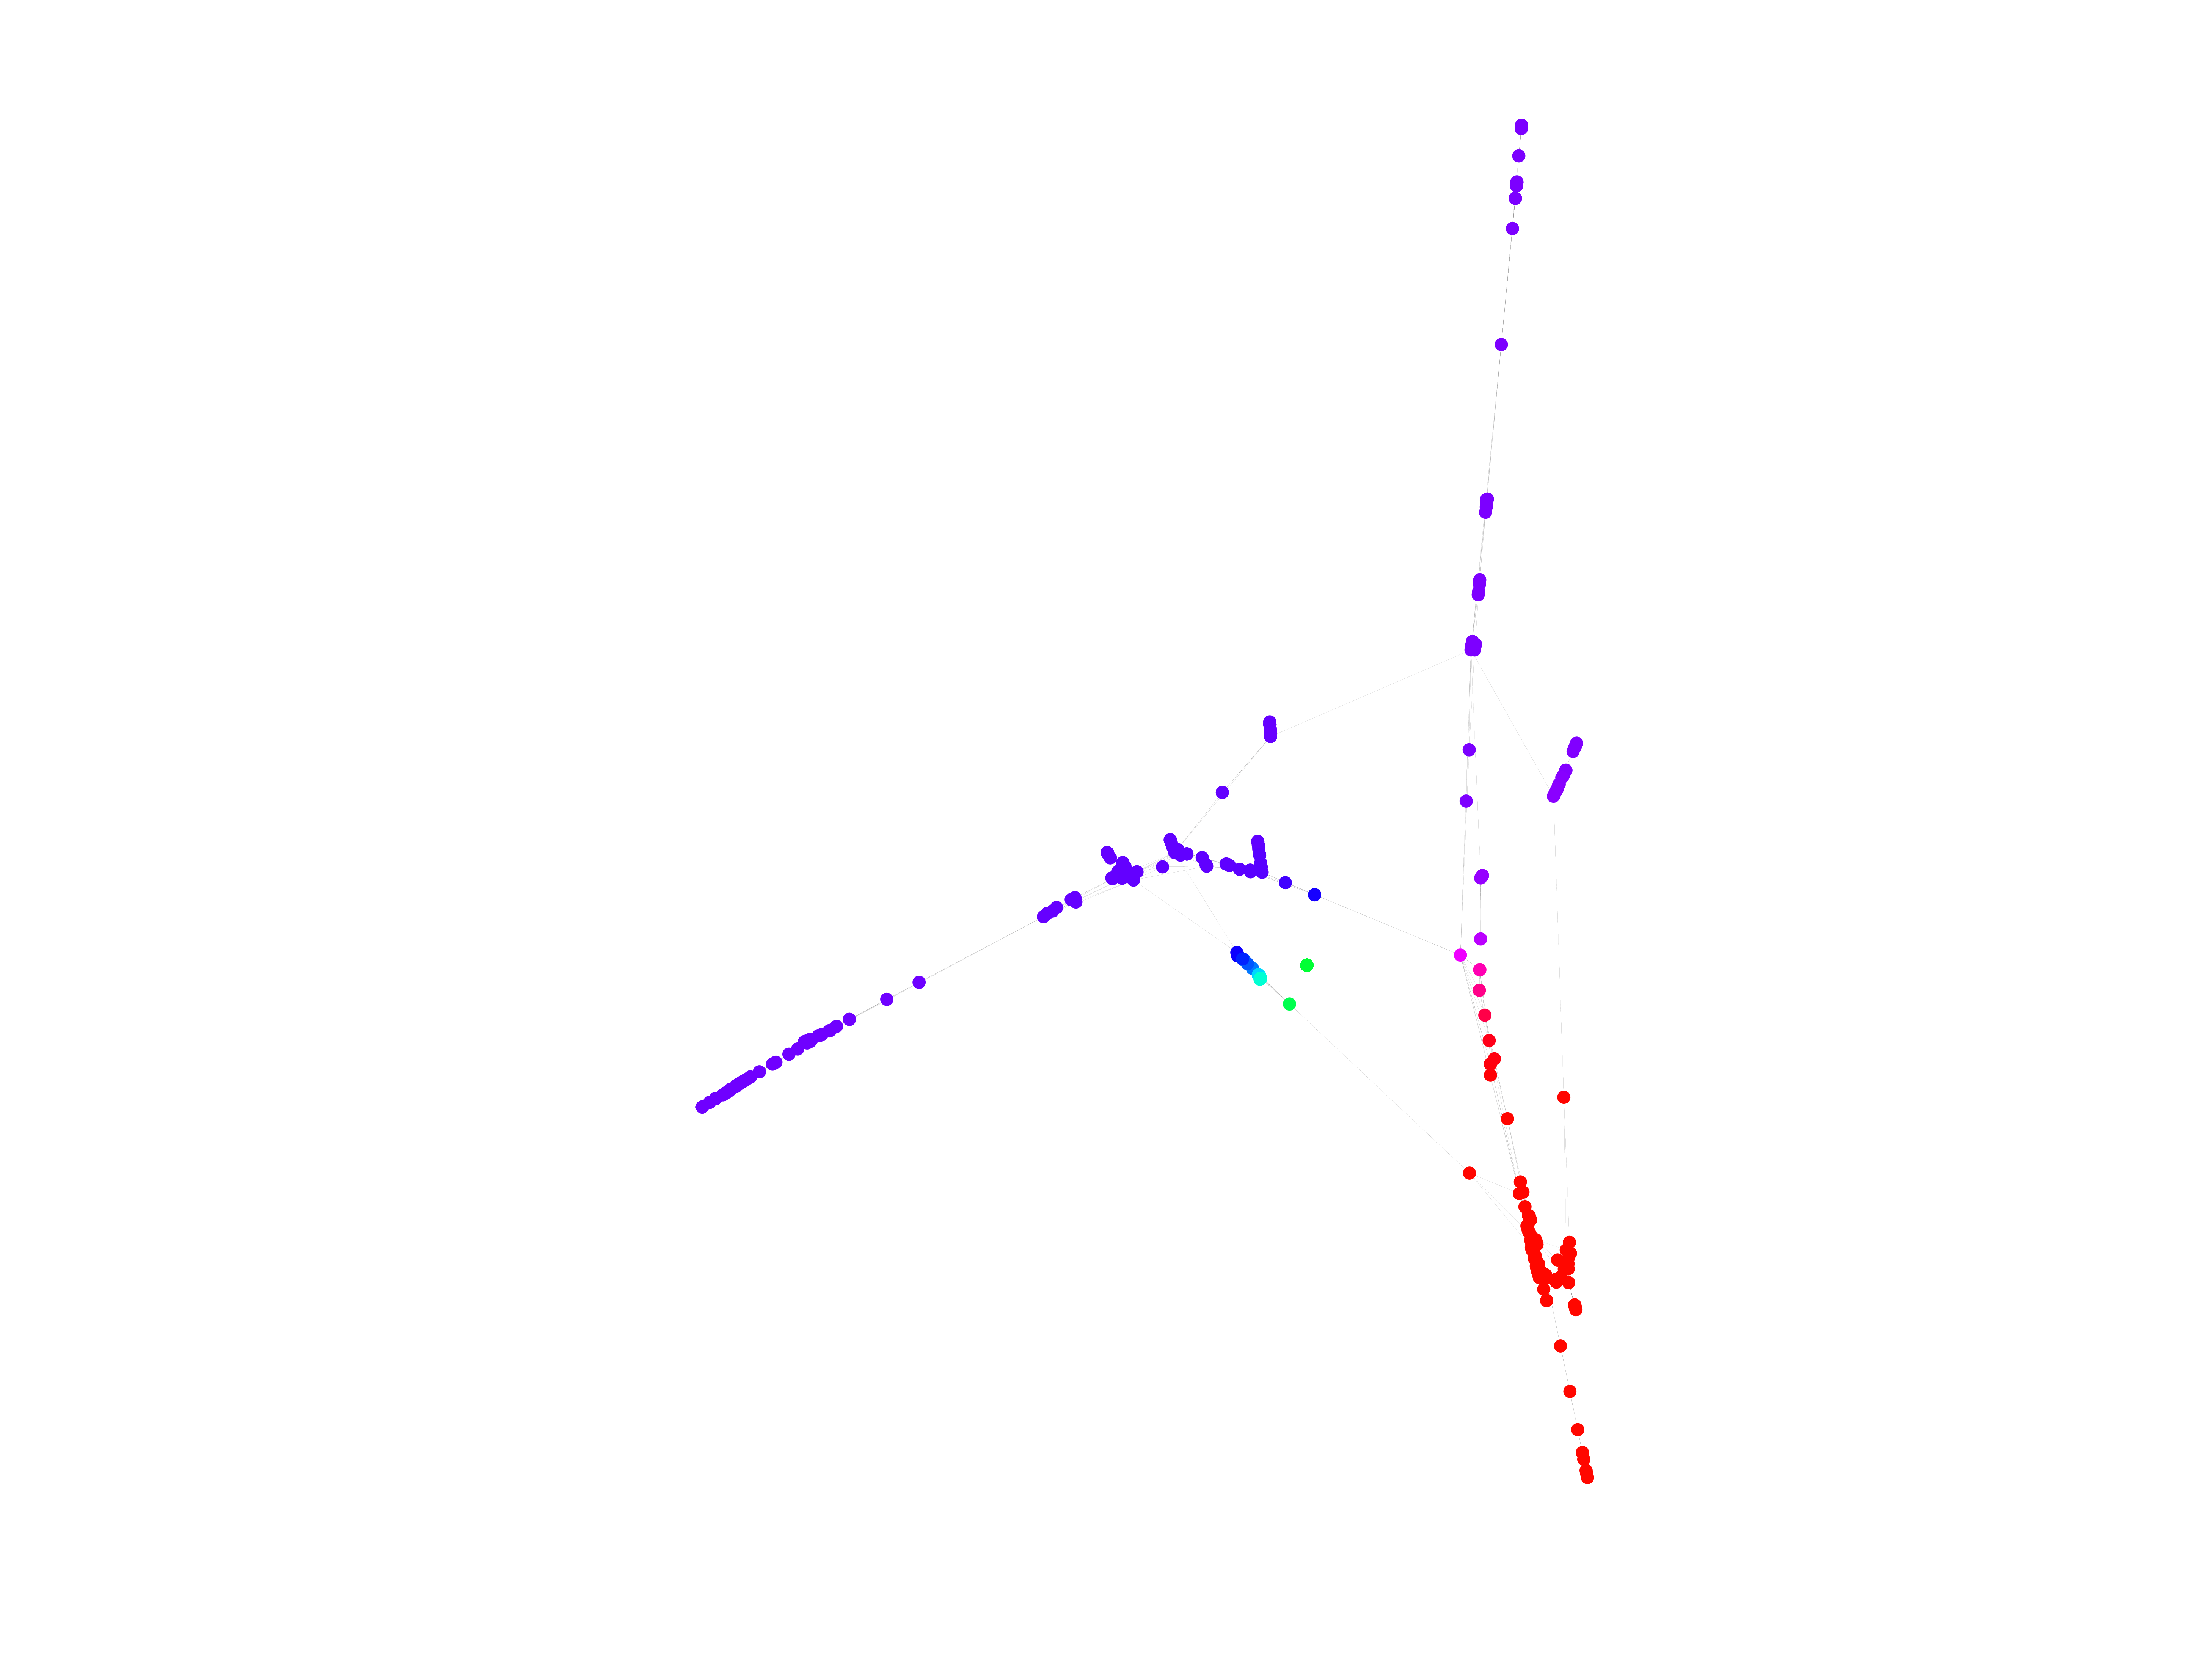
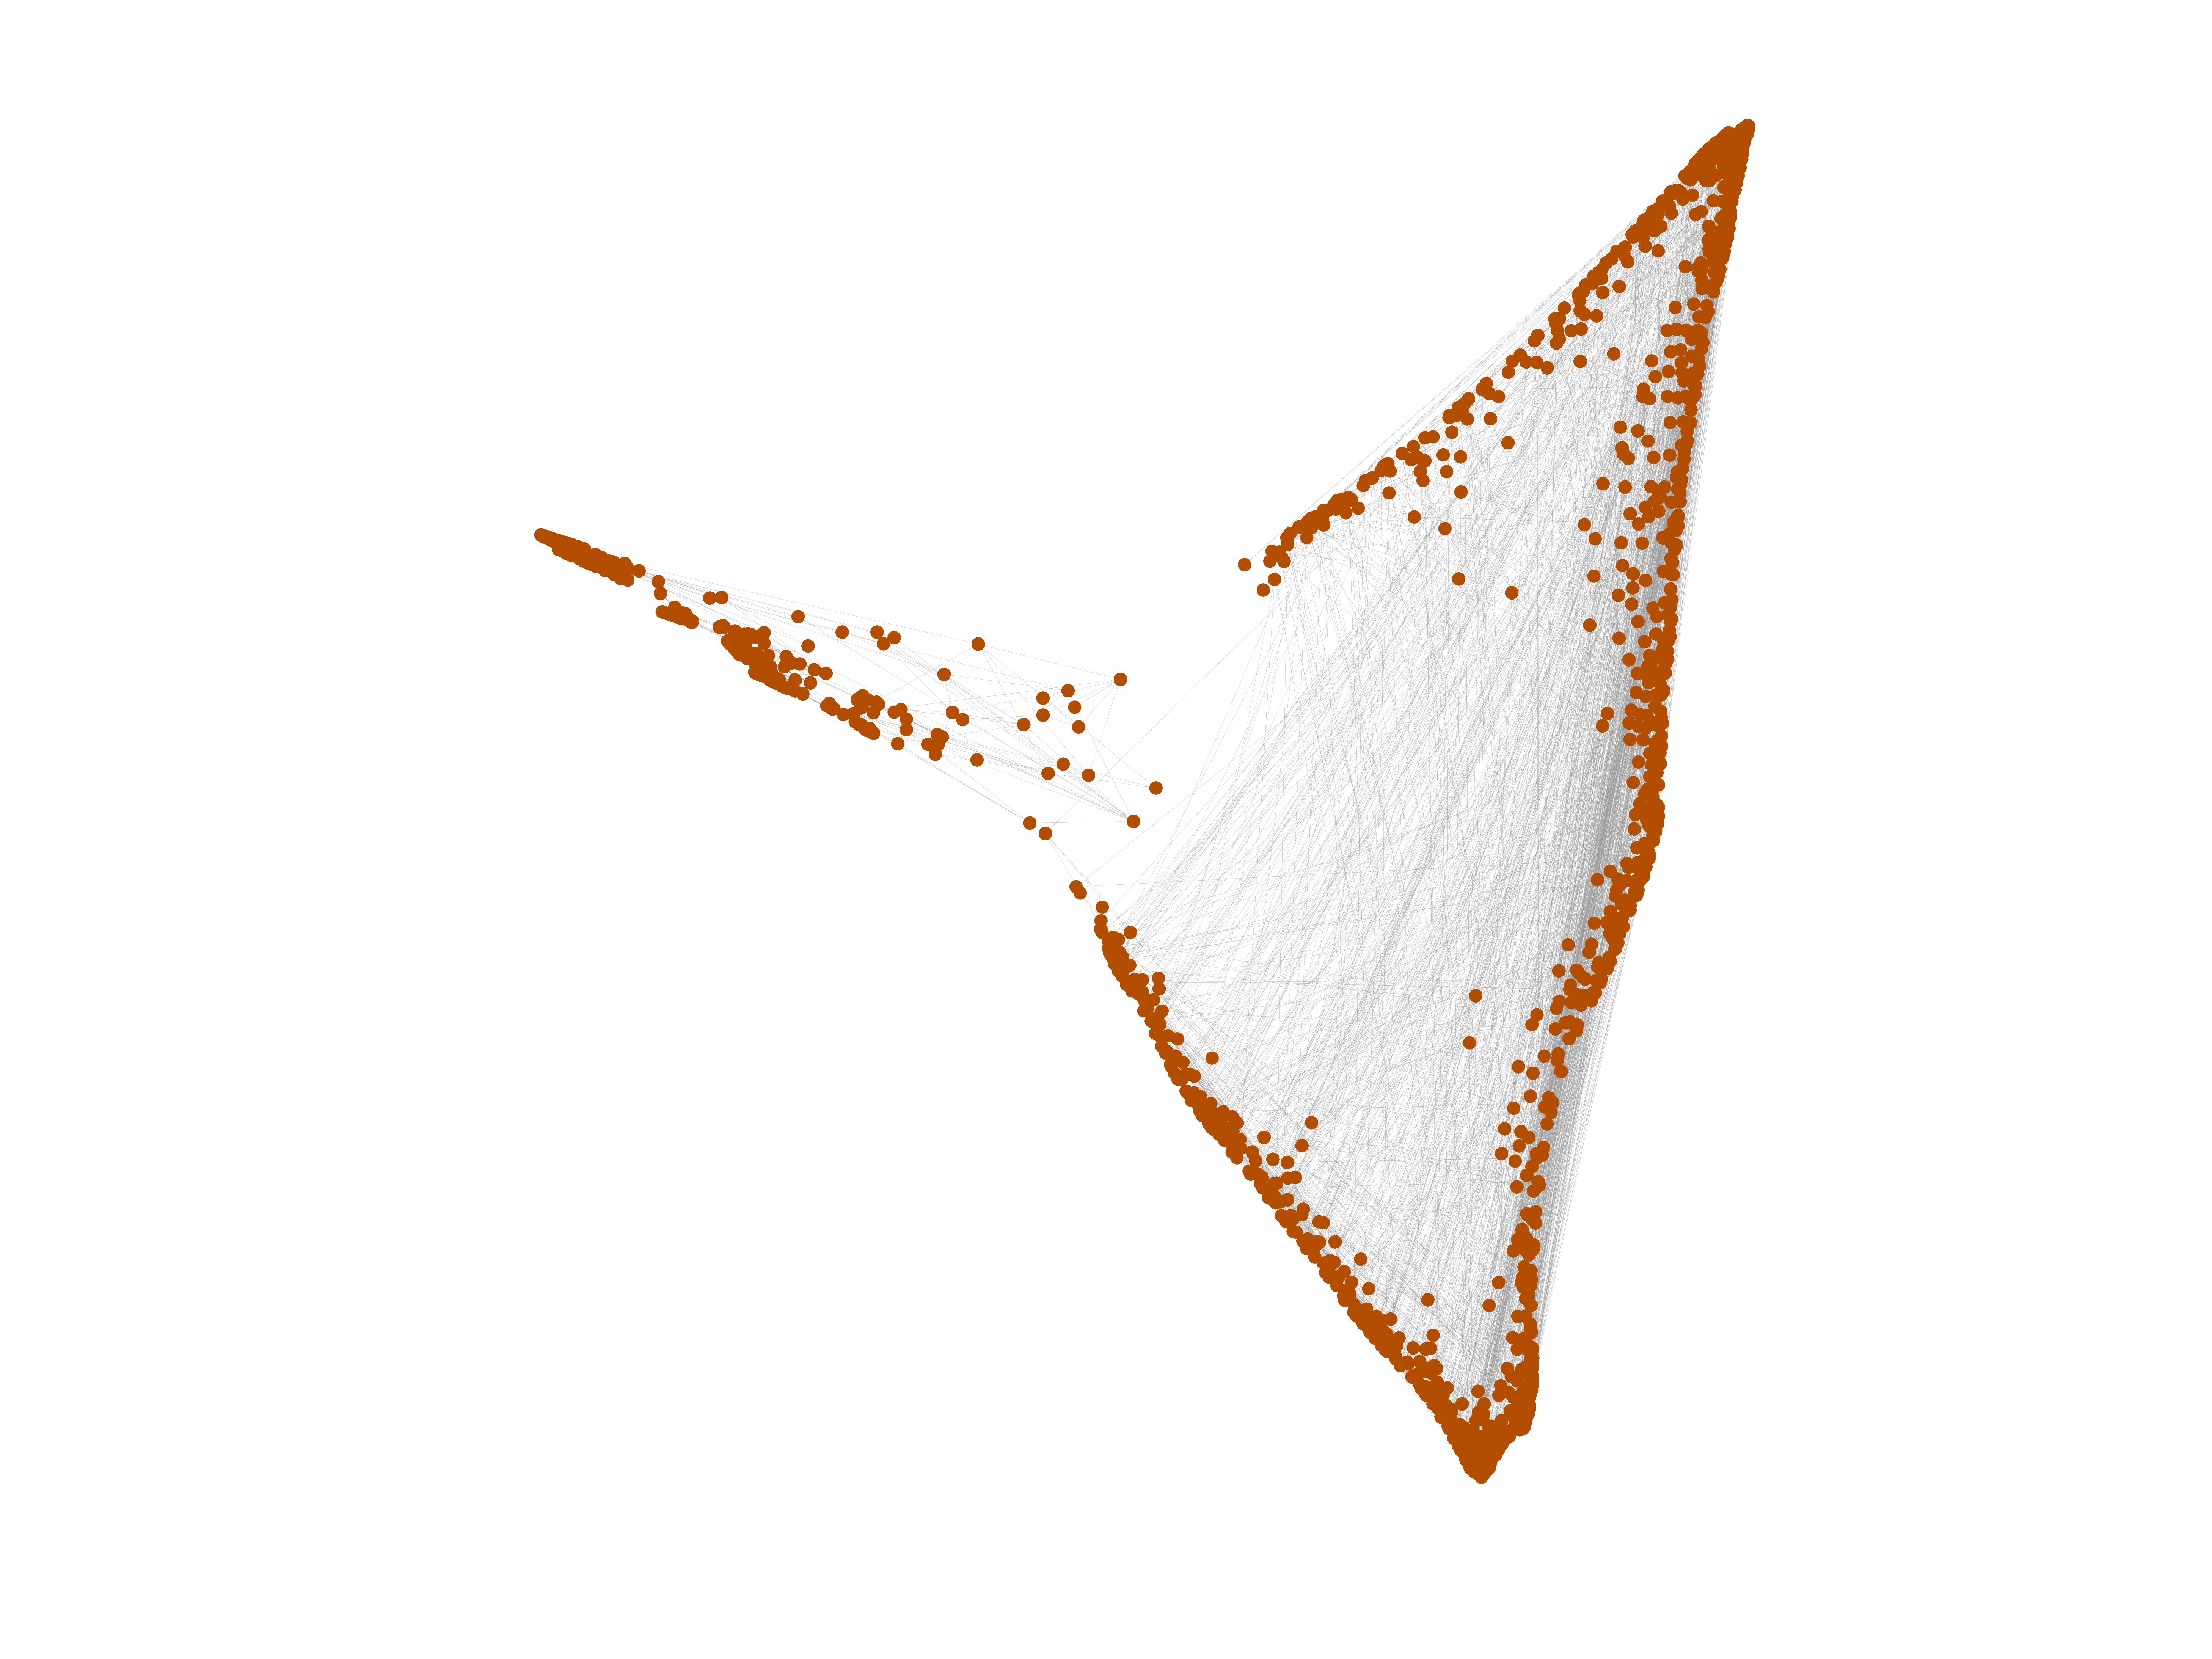
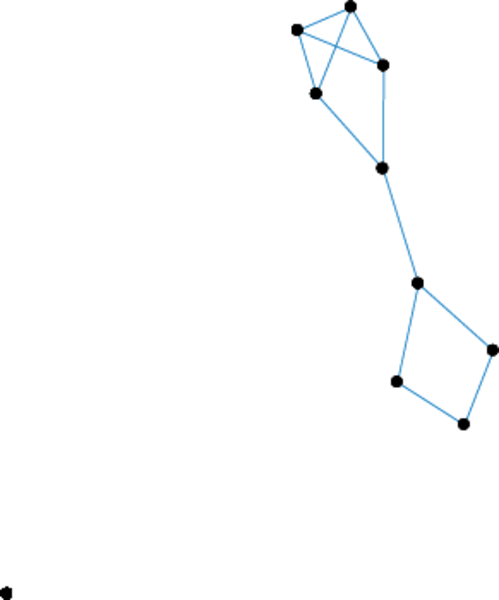
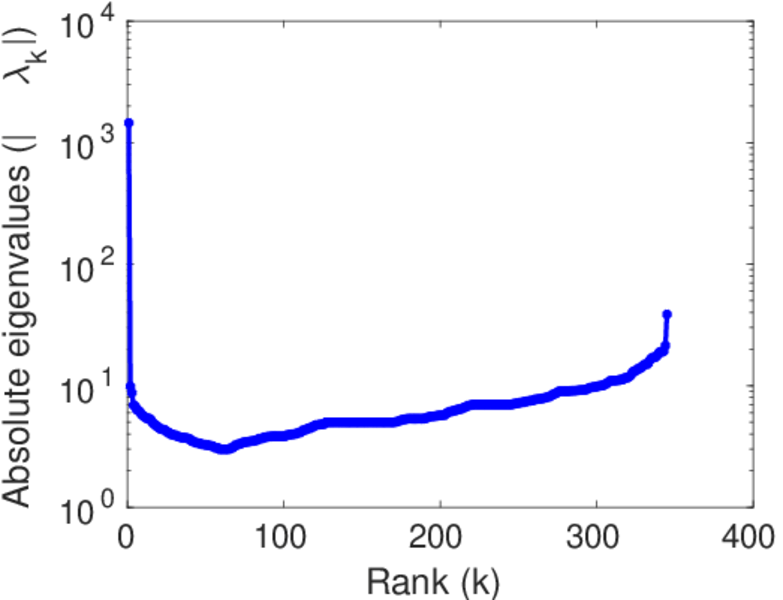
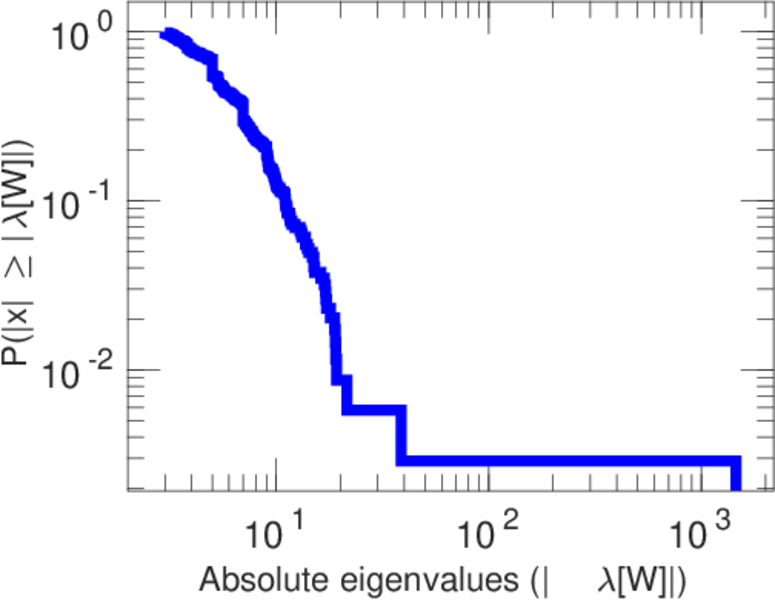
This is a network of co-authorships in the area of network science.
| Code | NS
| |
| Internal name | dimacs10-netscience
| |
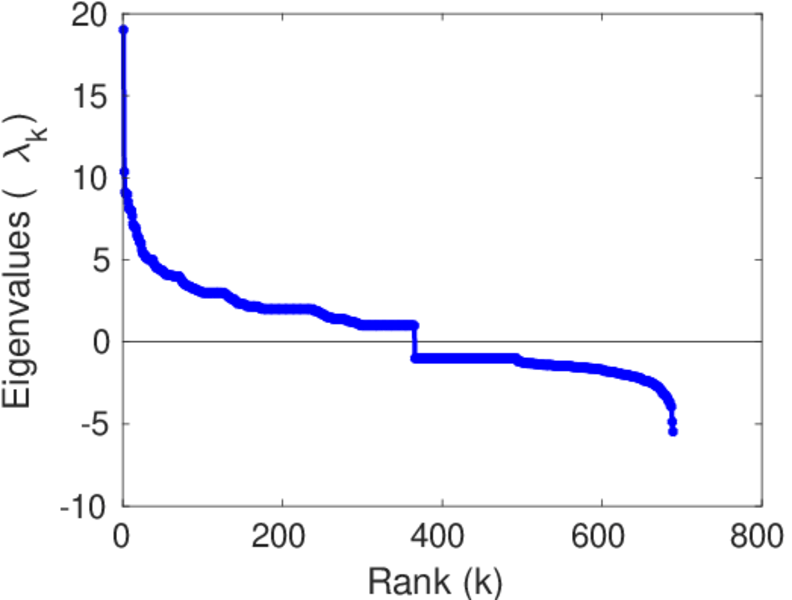
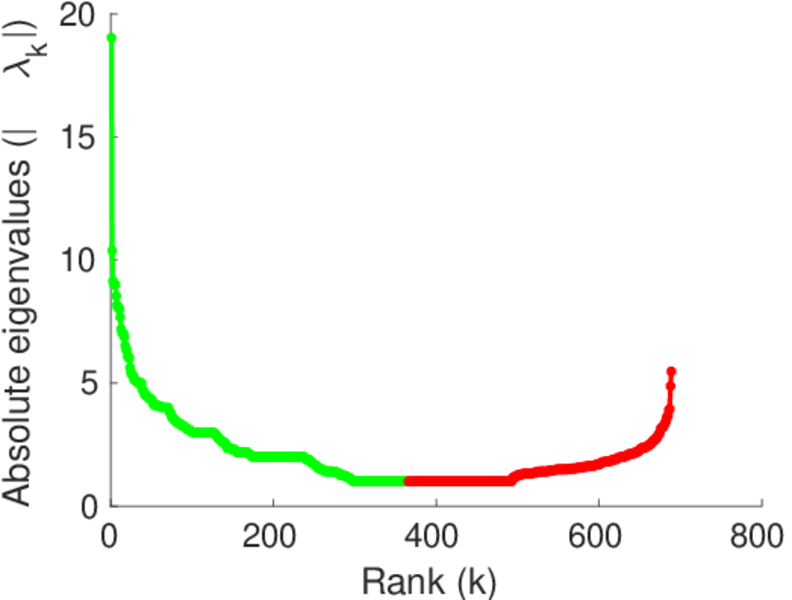
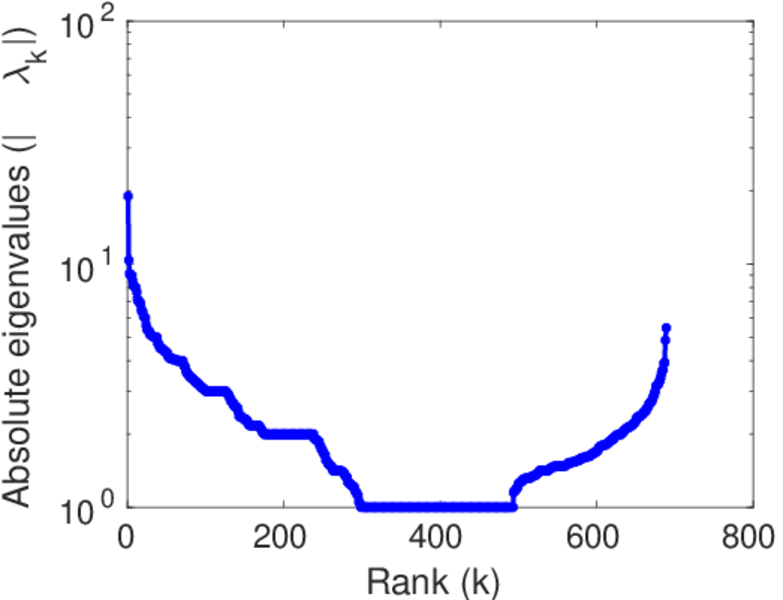
| Name | Network science | |
| Data source | https://www.cc.gatech.edu/dimacs10/archive/clustering.shtml | |
| Availability | Dataset is available for download | |
| Consistency check | Dataset passed all tests | |
| Category | Co-authorship network | |
| Dataset timestamp | 2006 | |
| Node meaning | Author | |
| Edge meaning | Co-authorship | |
| Network format | Unipartite, undirected | |
| Edge type | Unweighted, no multiple edges | |
| Loops | Does not contain loops | |
| Join | Is the join of an underlying network | |
| Multiplicity | Does not have multiple edges, but the underlying data has |


| [1] | Jérôme Kunegis. KONECT – The Koblenz Network Collection. In Proc. Int. Conf. on World Wide Web Companion, pages 1343–1350, 2013. [ http ] |
| [2] | Mark E. J. Newman. Finding community structure in networks using the eigenvectors of matrices. Phys. Rev. E, 74(3), 2006. |