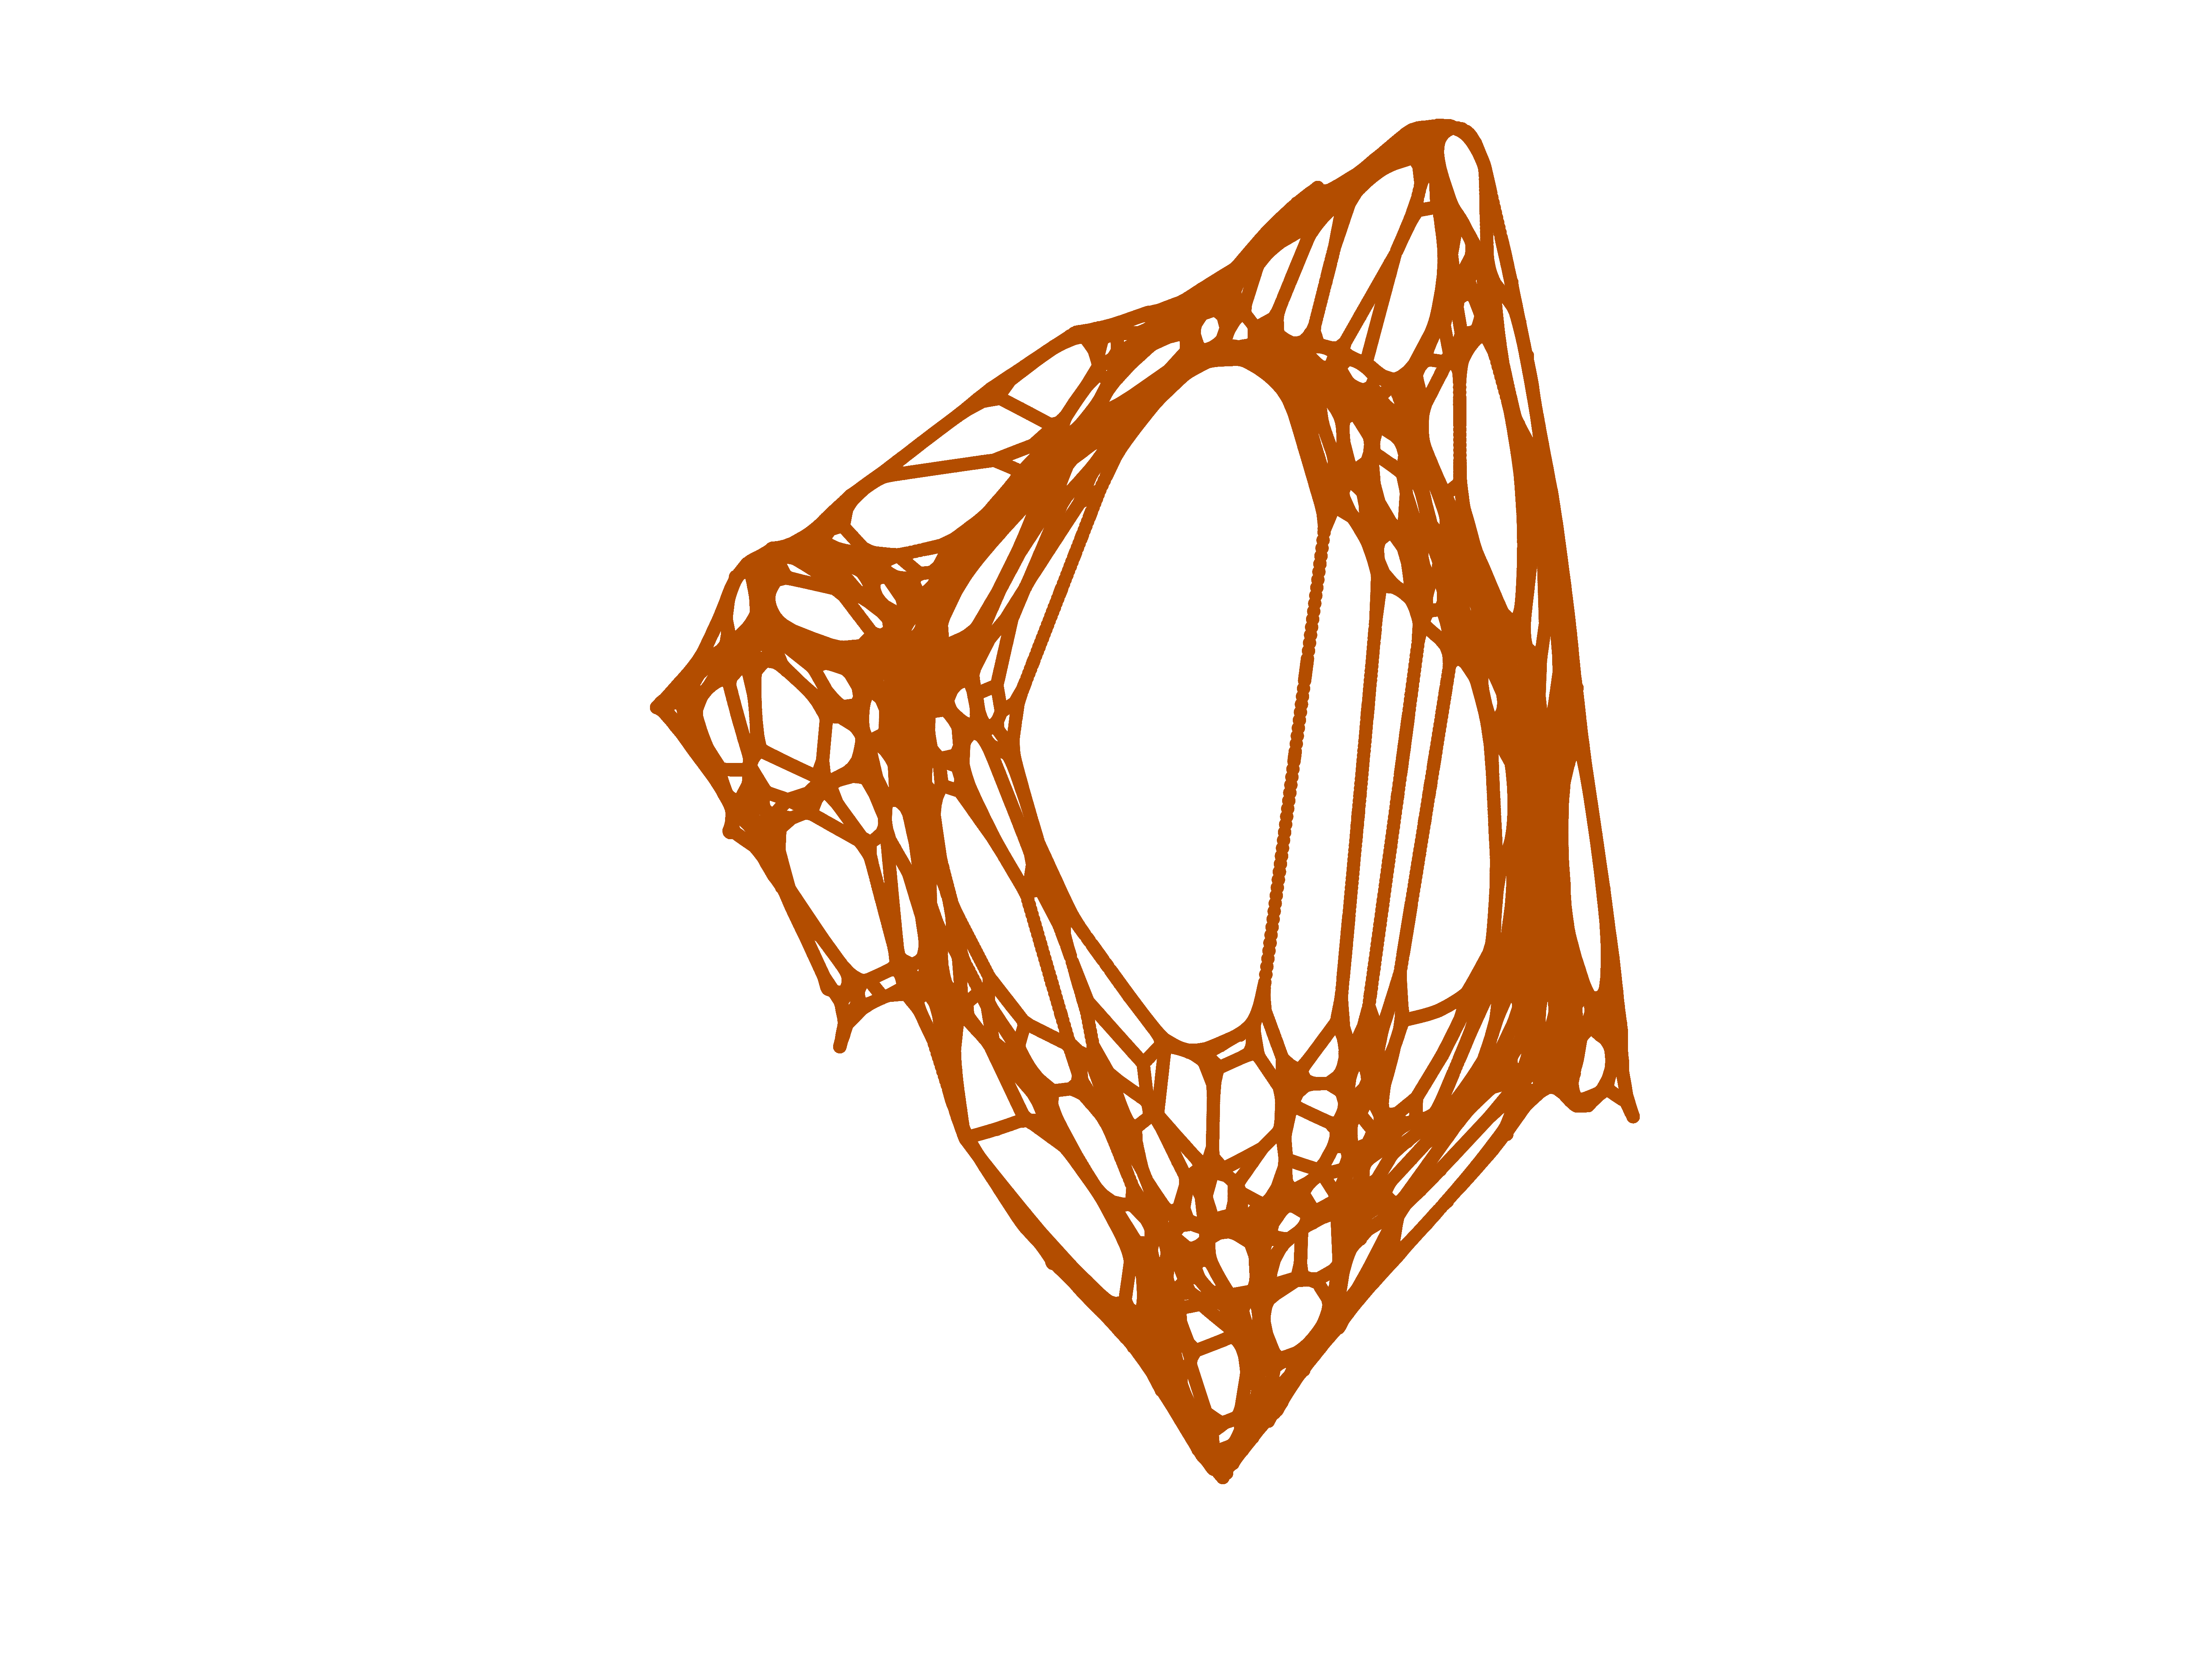
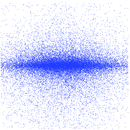
California and Nevada
This is the directed road network from the 9th DIMACS Implementation Challenge,
for the area "California and Nevada".
Metadata
Statistics
| Size | n = | 1,890,815
|
| Volume | m = | 4,630,444
|
| Loop count | l = | 0
|
| Wedge count | s = | 4,192,229
|
| Claw count | z = | 30,258,364
|
| Cross count | x = | 28,228,721
|
| Triangle count | t = | 34,672
|
| Square count | q = | 134,075
|
| 4-Tour count | T4 = | 22,471,960
|
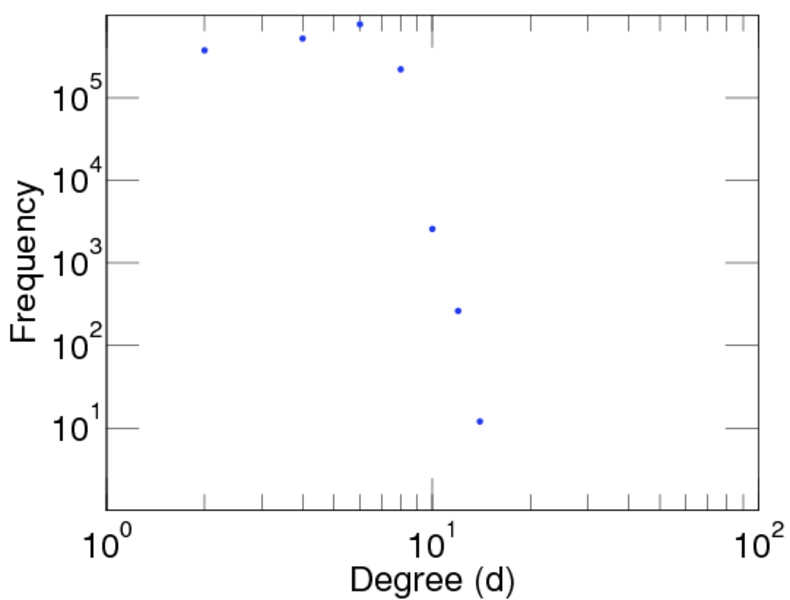
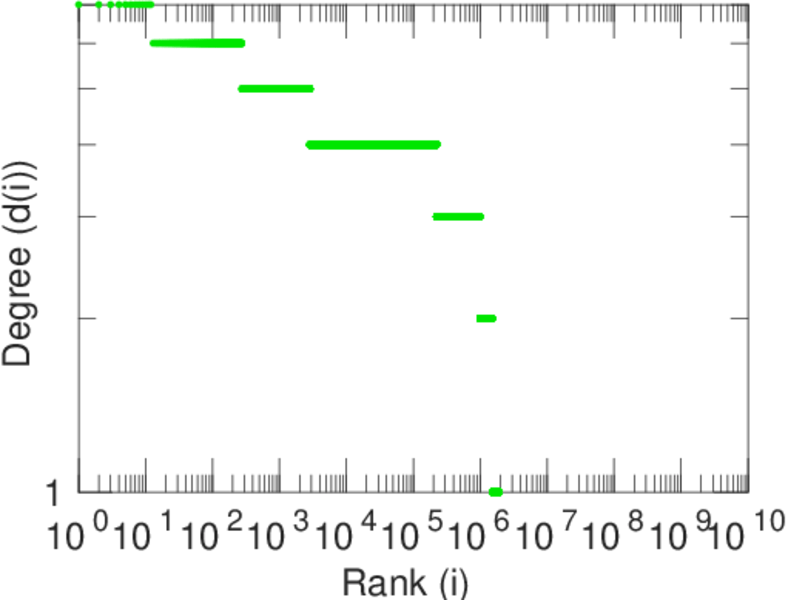
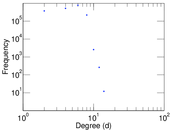
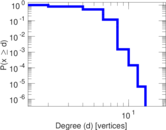
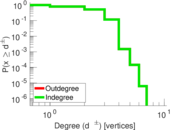
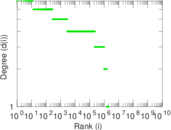
| Maximum degree | dmax = | 14
|
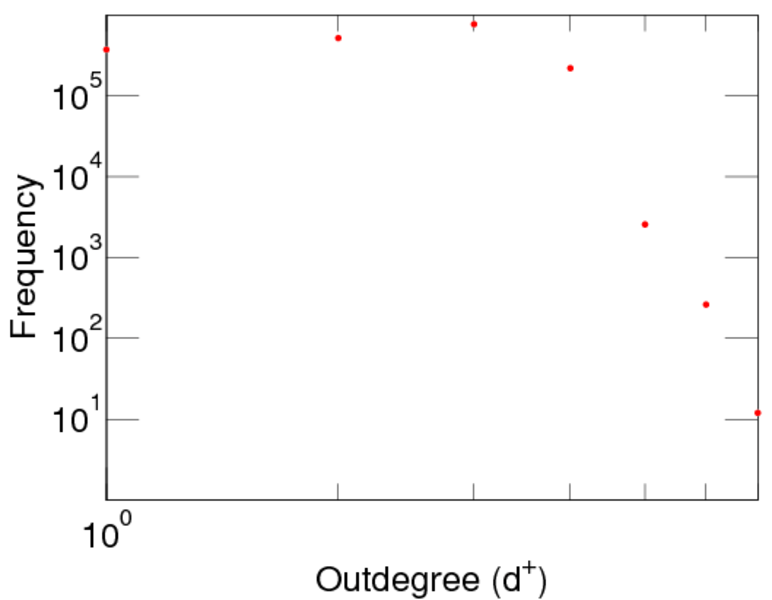
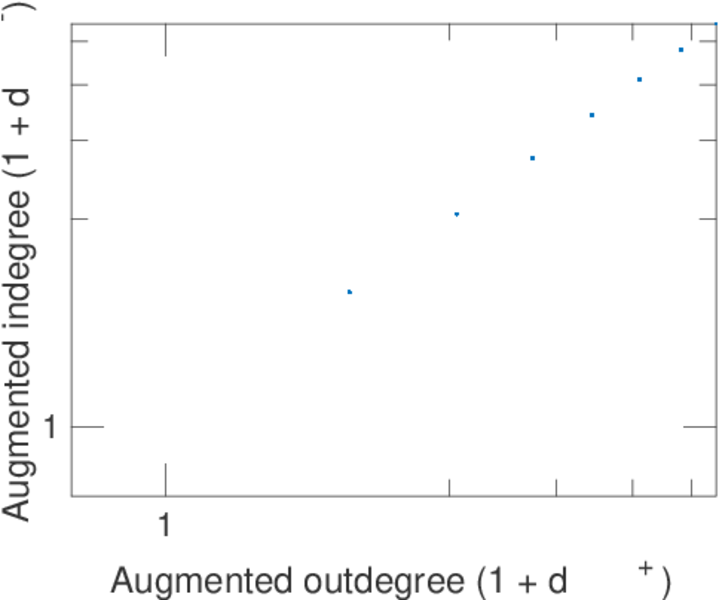
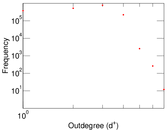
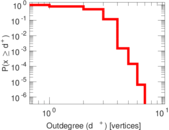
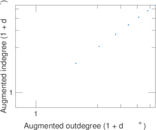
| Maximum outdegree | d+max = | 7
|
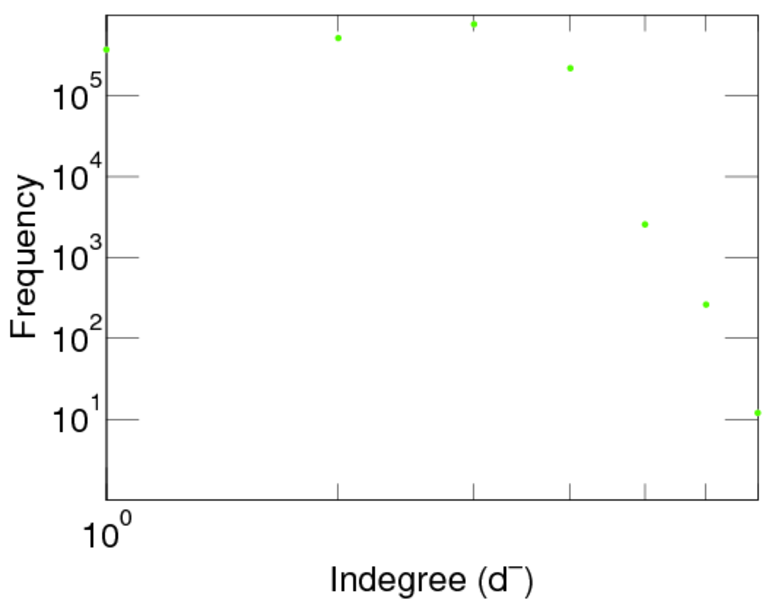
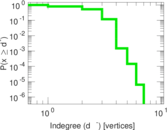
| Maximum indegree | d−max = | 7
|
| Average degree | d = | 4.897 83
|
| Size of LCC | N = | 1,890,815
|
| Size of LSCC | Ns = | 1,890,815
|
| Relative size of LSCC | Nrs = | 1.000 00
|
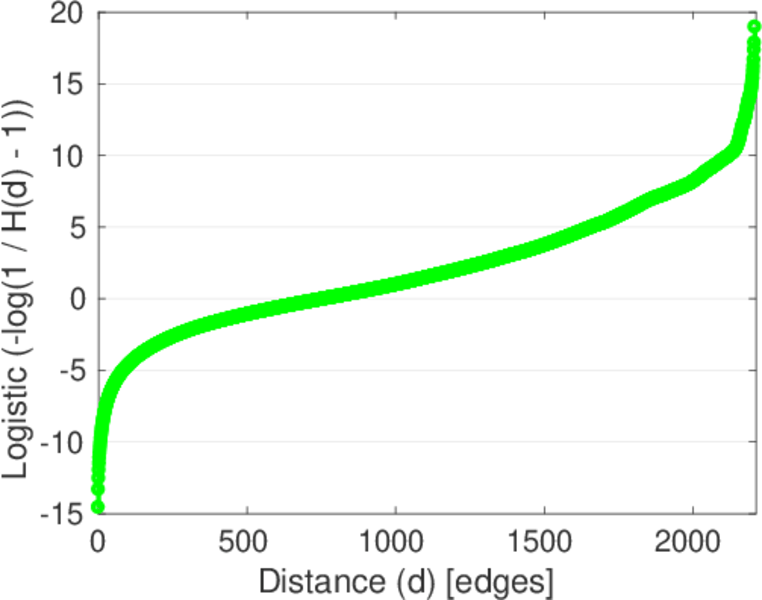
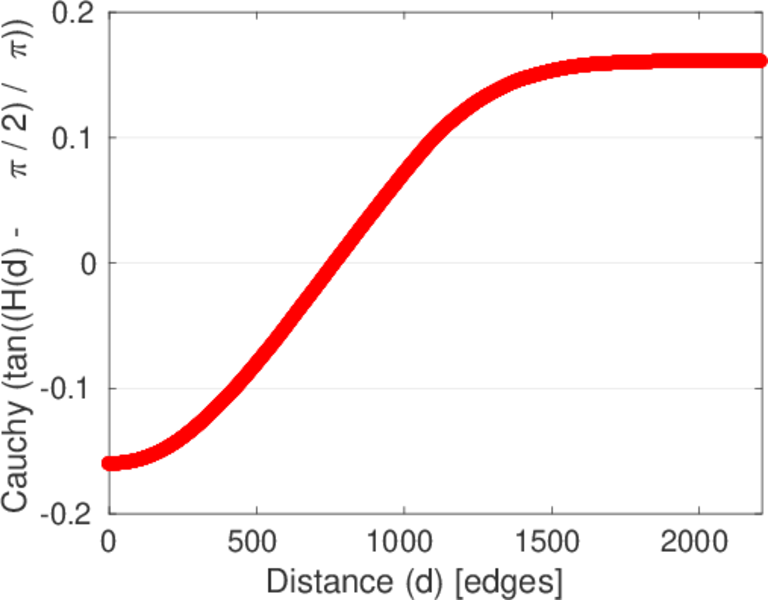
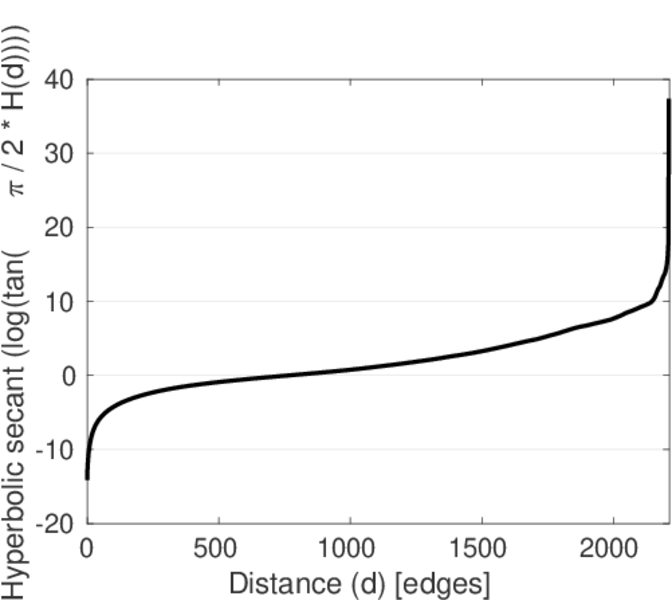
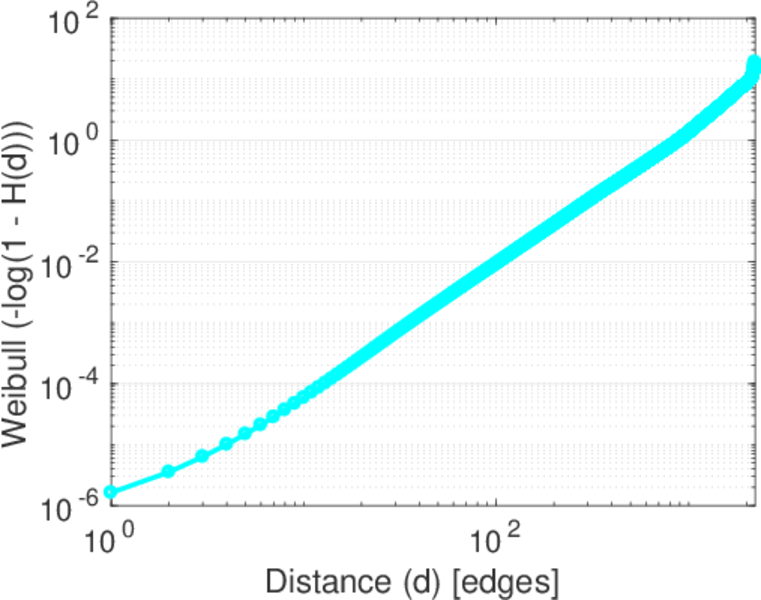
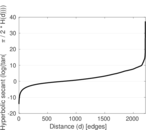
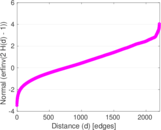
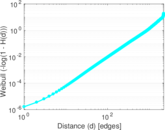
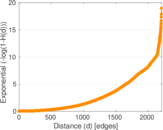
| Diameter | δ = | 2,315
|
| 50-Percentile effective diameter | δ0.5 = | 766.790
|
| 90-Percentile effective diameter | δ0.9 = | 1,248.86
|
| Median distance | δM = | 767
|
| Mean distance | δm = | 778.470
|
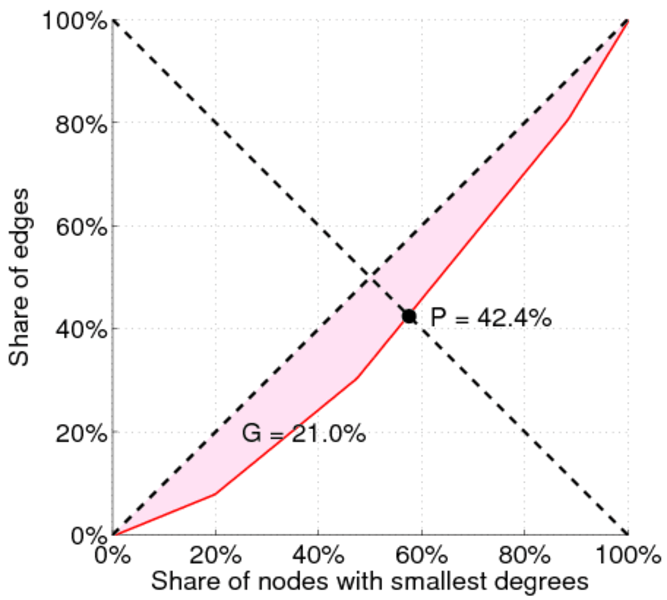
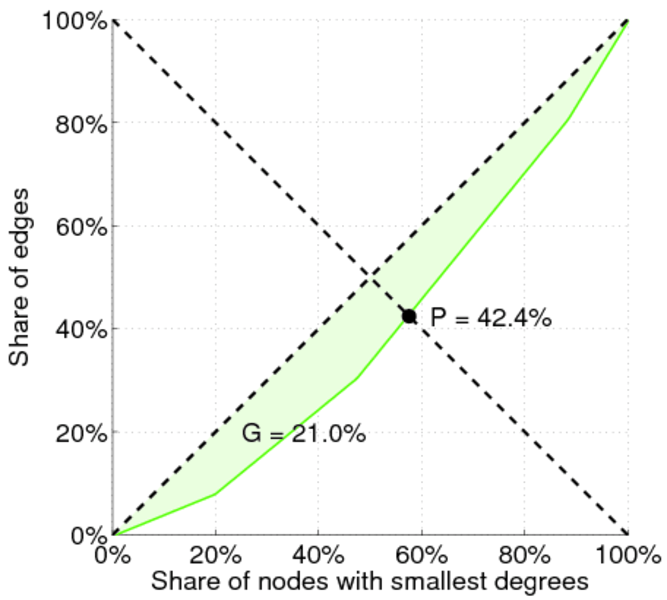
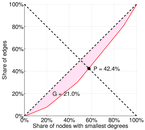
| Gini coefficient | G = | 0.209 777
|
| Balanced inequality ratio | P = | 0.424 340
|
| Outdegree balanced inequality ratio | P+ = | 0.424 340
|
| Indegree balanced inequality ratio | P− = | 0.424 340
|
| Relative edge distribution entropy | Her = | 0.994 497
|
| Power law exponent | γ = | 2.243 70
|
| Tail power law exponent | γt = | 6.461 00
|
| Tail power law exponent with p | γ3 = | 6.461 00
|
| p-value | p = | 0.000 00
|
| Outdegree tail power law exponent with p | γ3,o = | 6.461 00
|
| Outdegree p-value | po = | 0.000 00
|
| Indegree tail power law exponent with p | γ3,i = | 6.461 00
|
| Indegree p-value | pi = | 0.000 00
|
| Degree assortativity | ρ = | +0.074 357 5
|
| Degree assortativity p-value | pρ = | 0.000 00
|
| In/outdegree correlation | ρ± = | +1.000 00
|
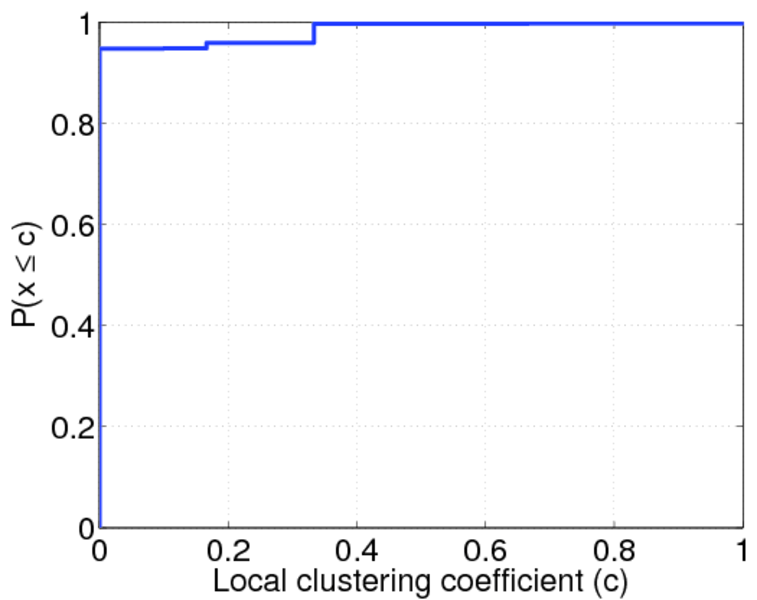
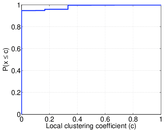
| Clustering coefficient | c = | 0.024 811 6
|
| Directed clustering coefficient | c± = | 0.024 811 6
|
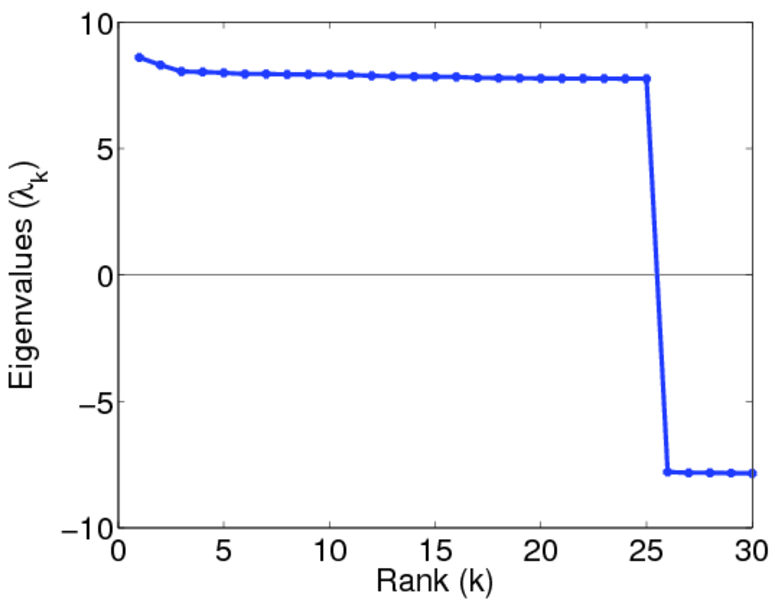
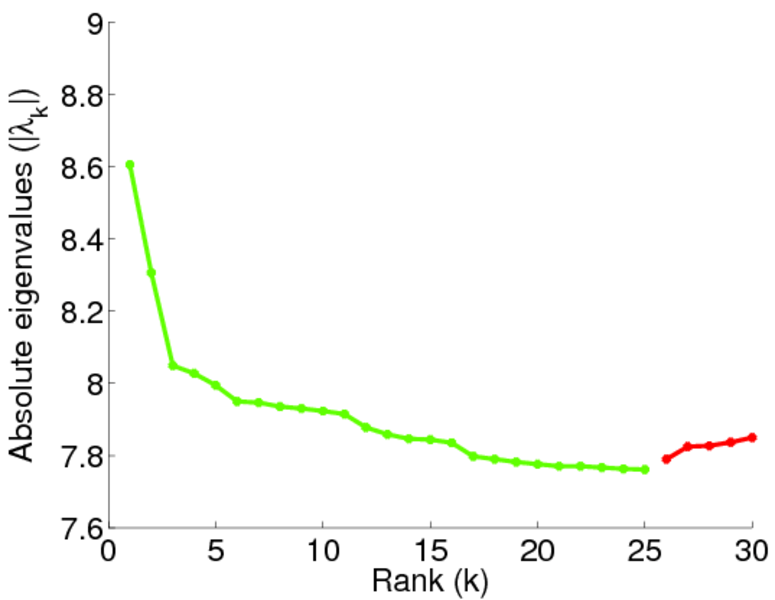
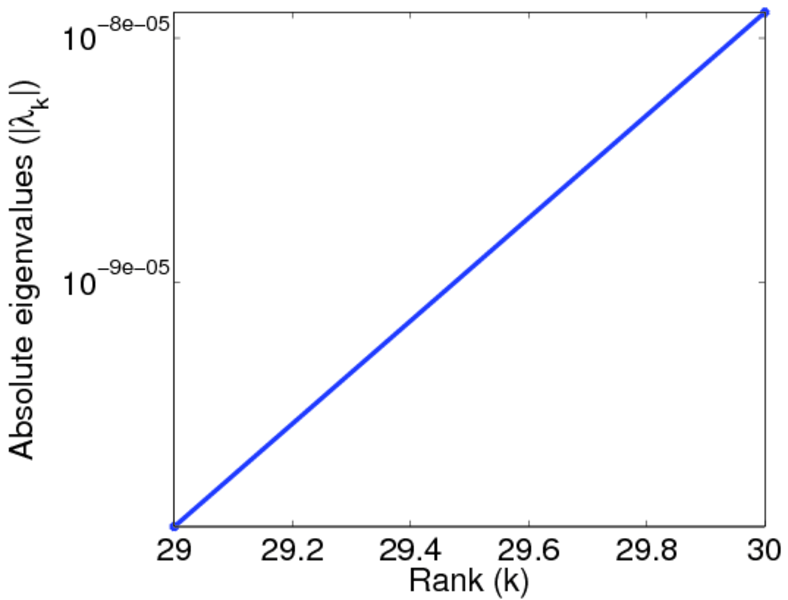
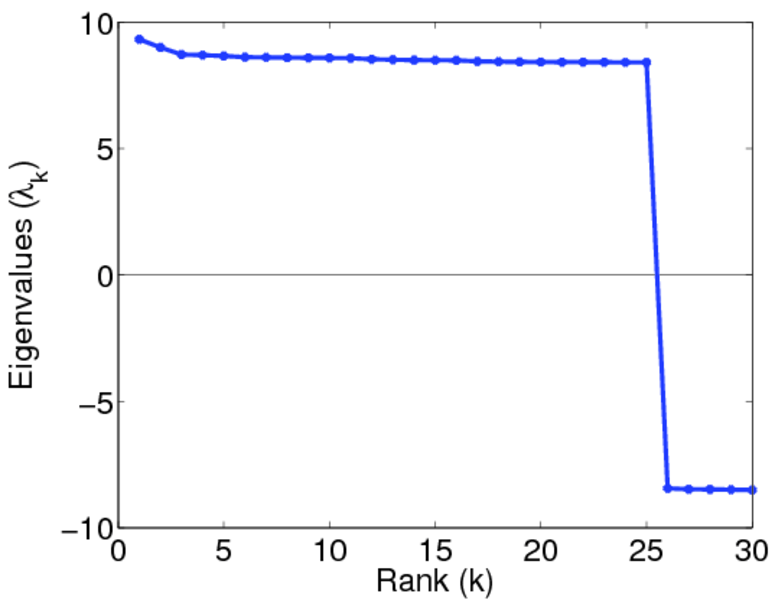
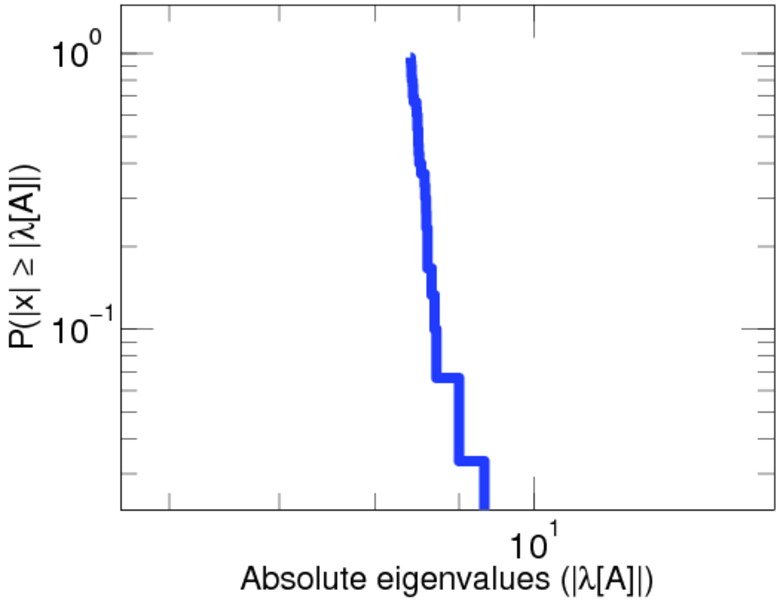
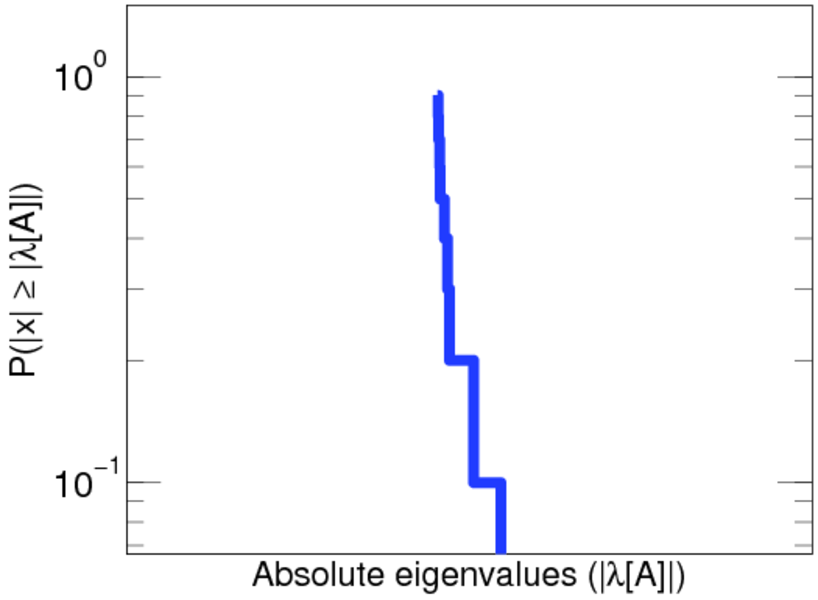
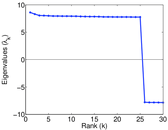
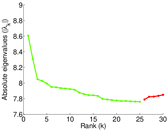
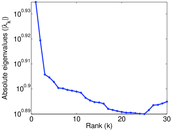
| Spectral norm | α = | 8.605 43
|
| Operator 2-norm | ν = | 4.302 72
|
| Cyclic eigenvalue | π = | 4.302 72
|
| Algebraic connectivity | a = | 3.677 81 × 10−7
|
| Reciprocity | y = | 1.000 00
|
| Non-bipartivity | bA = | 0.087 808 9
|
| Normalized non-bipartivity | bN = | 0.000 181 755
|
| Algebraic non-bipartivity | χ = | 0.000 360 203
|
| Spectral bipartite frustration | bK = | 3.677 17 × 10−5
|
| Controllability | C = | 187,882
|
| Relative controllability | Cr = | 0.099 365 6
|
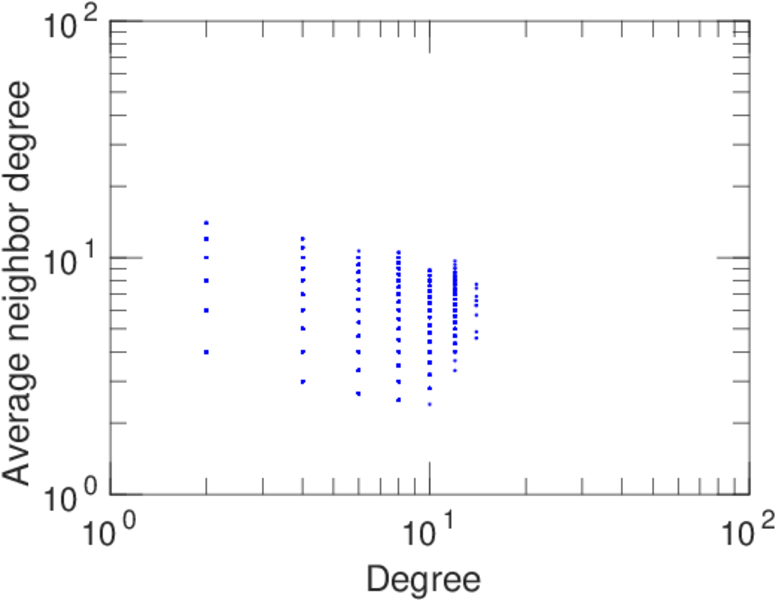
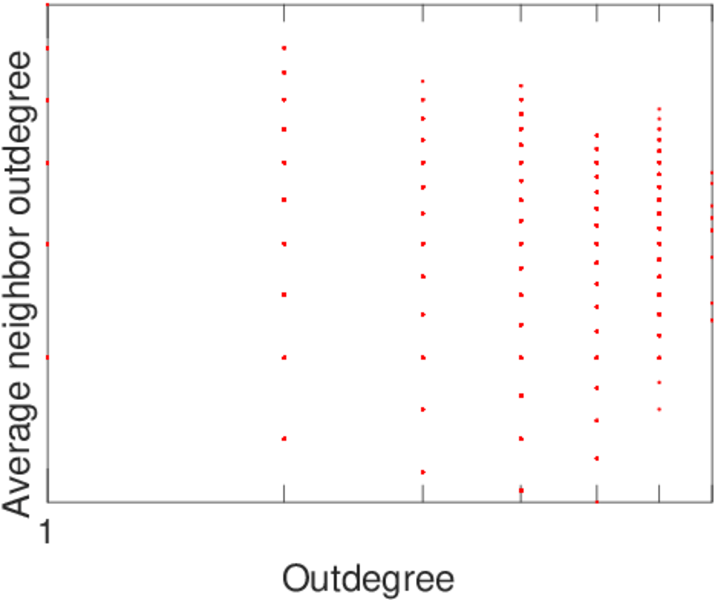
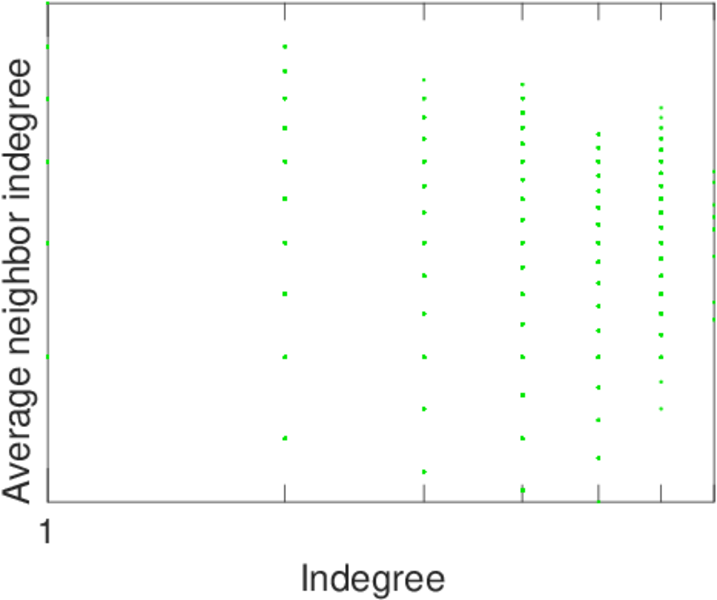
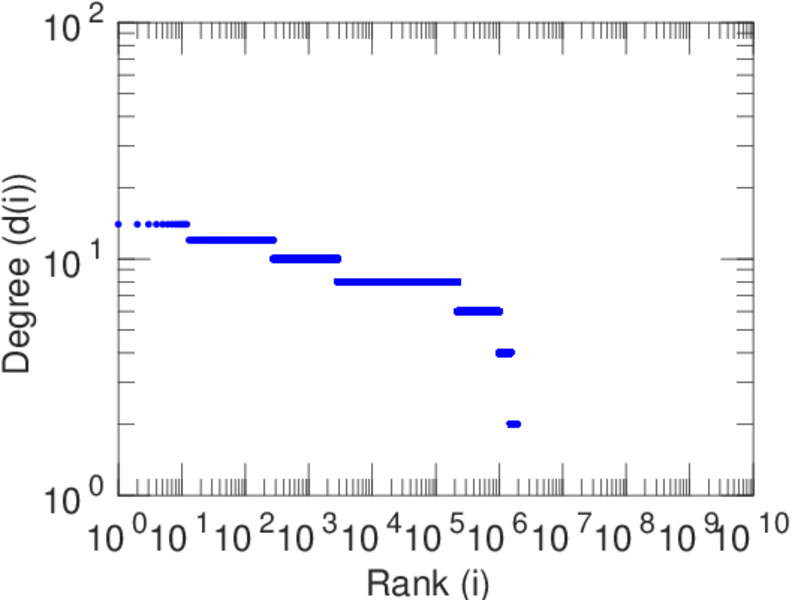
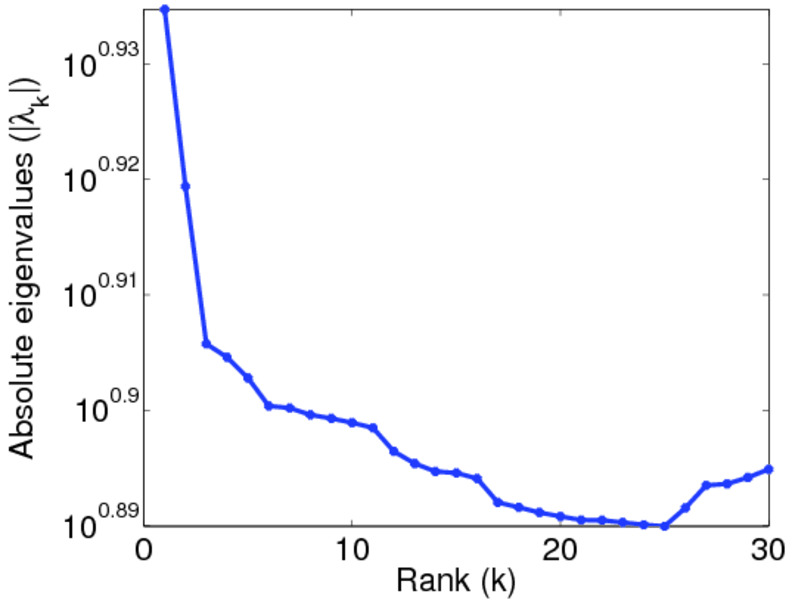
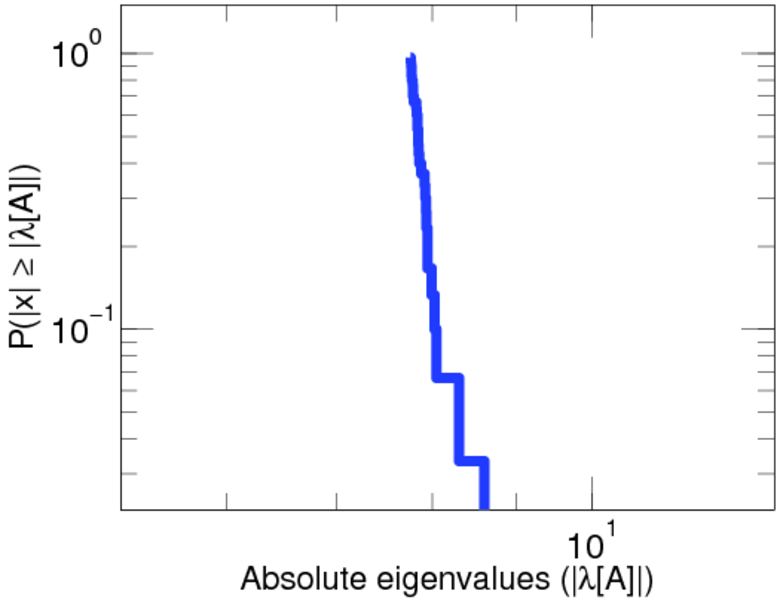
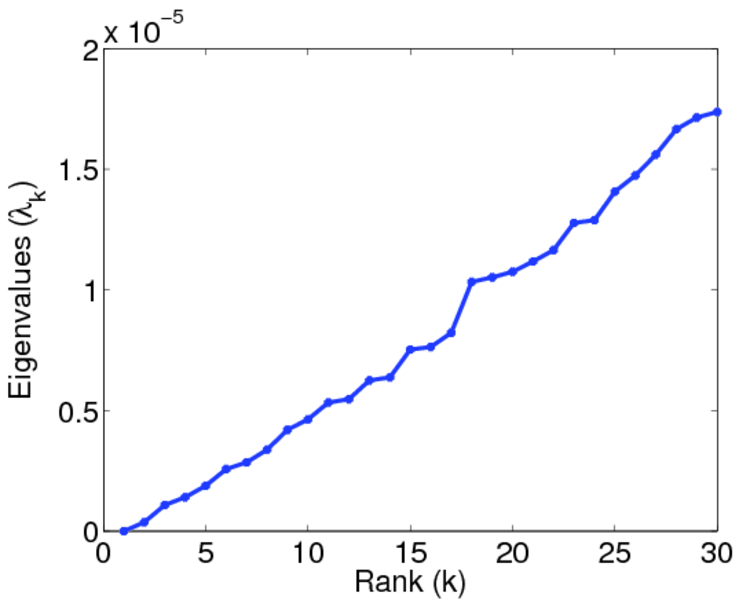
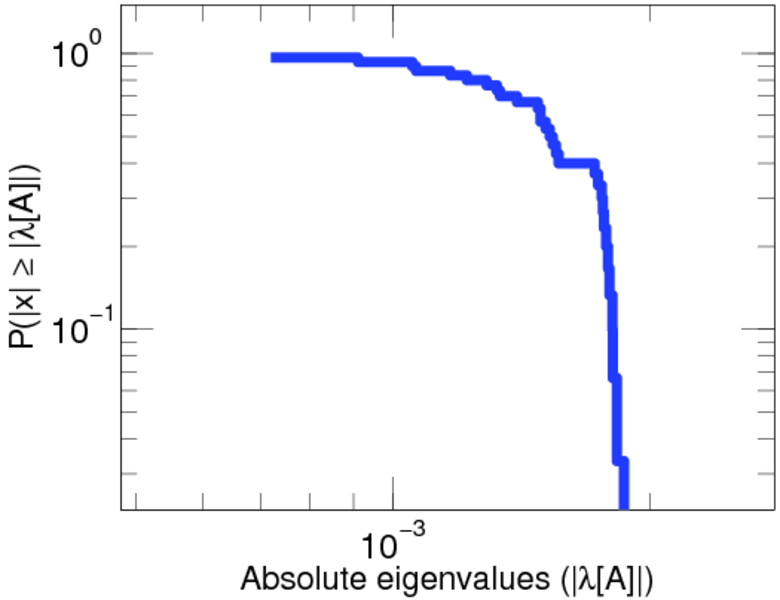
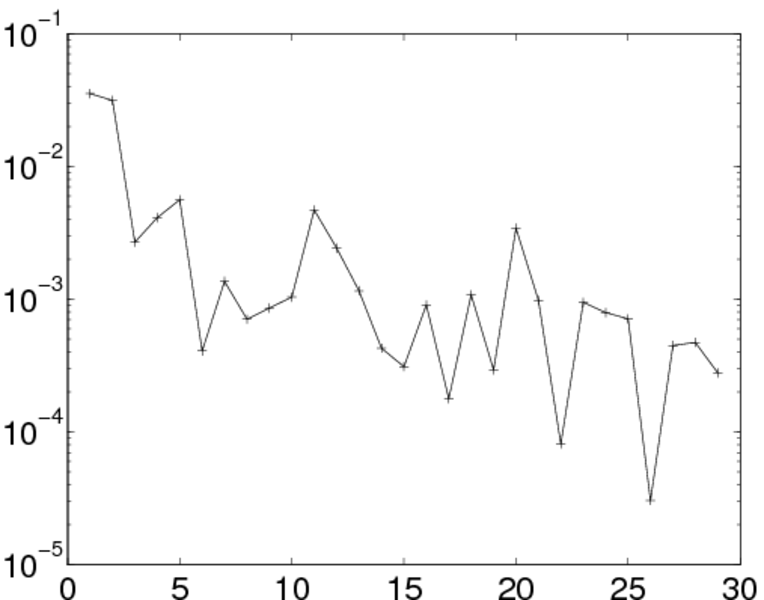
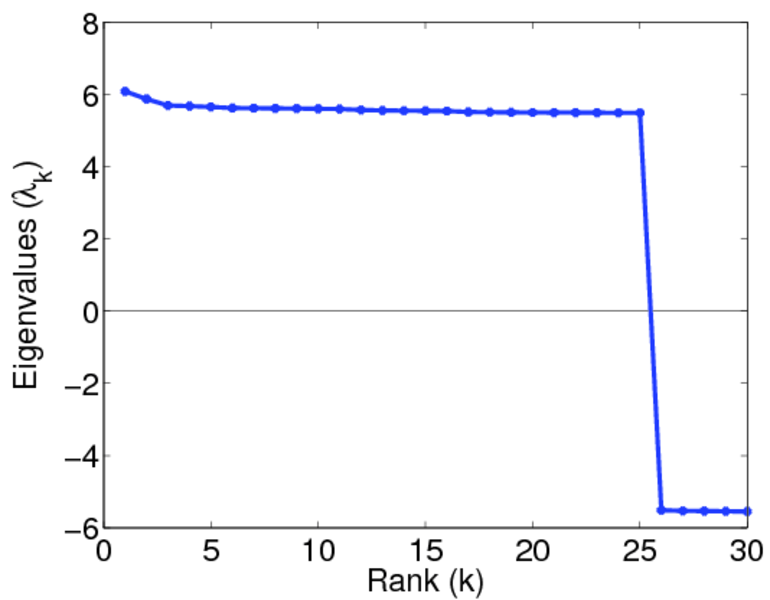
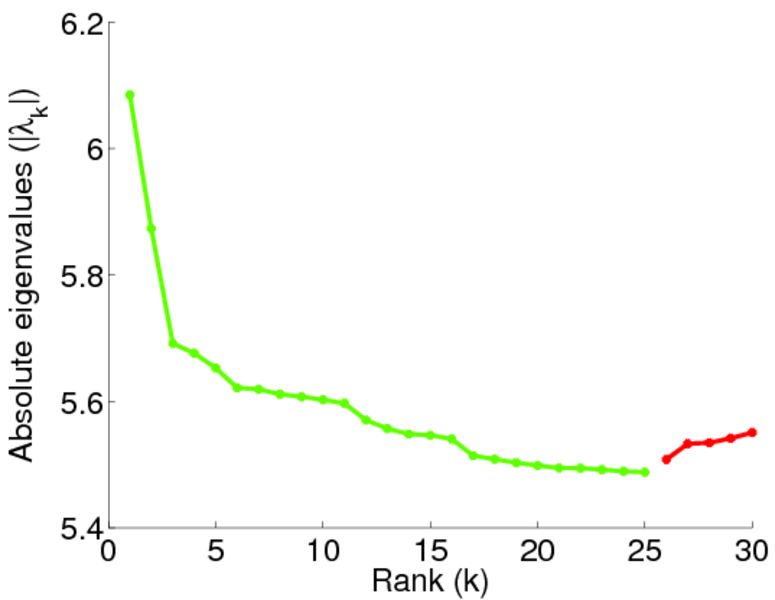
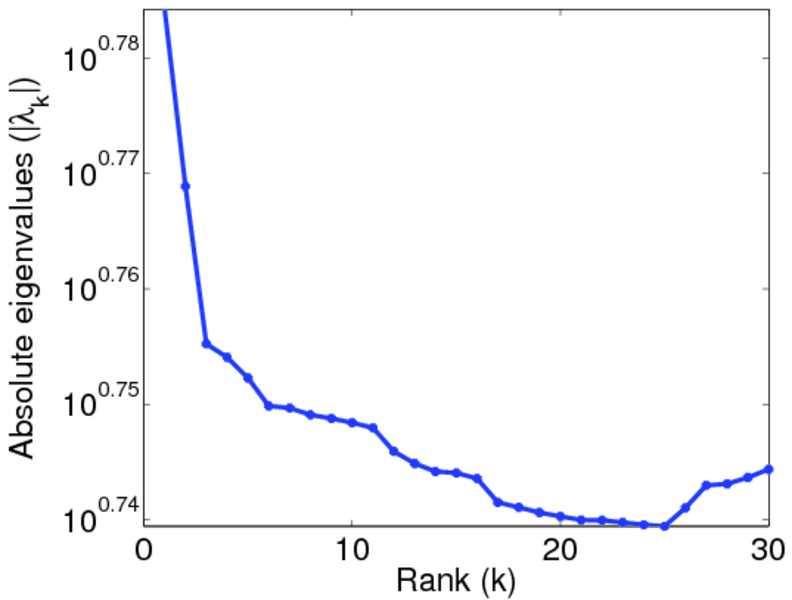
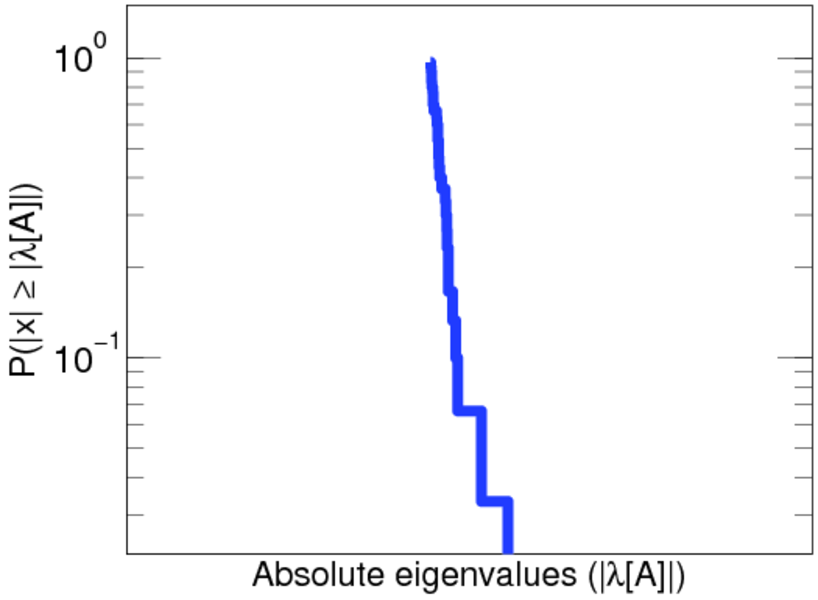
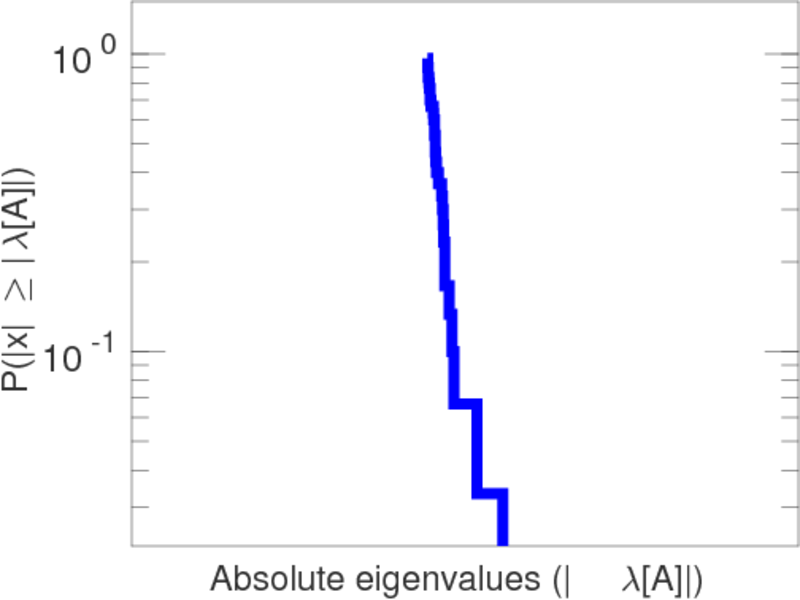
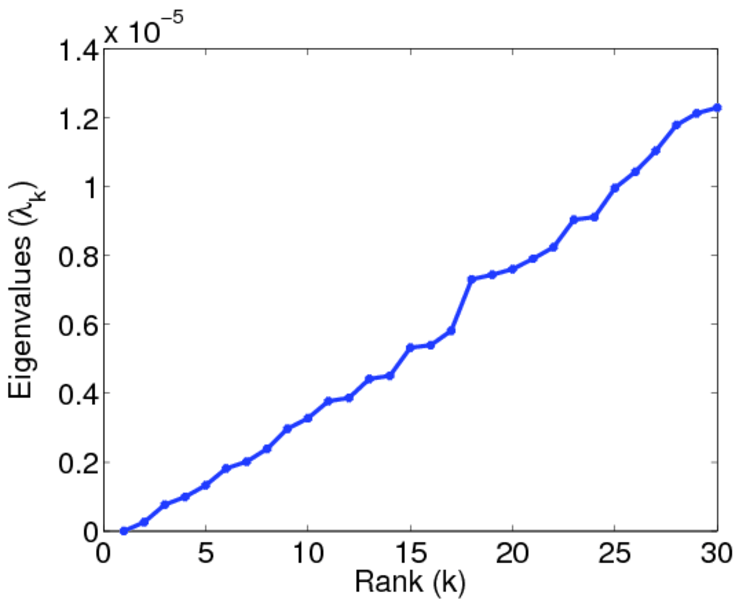
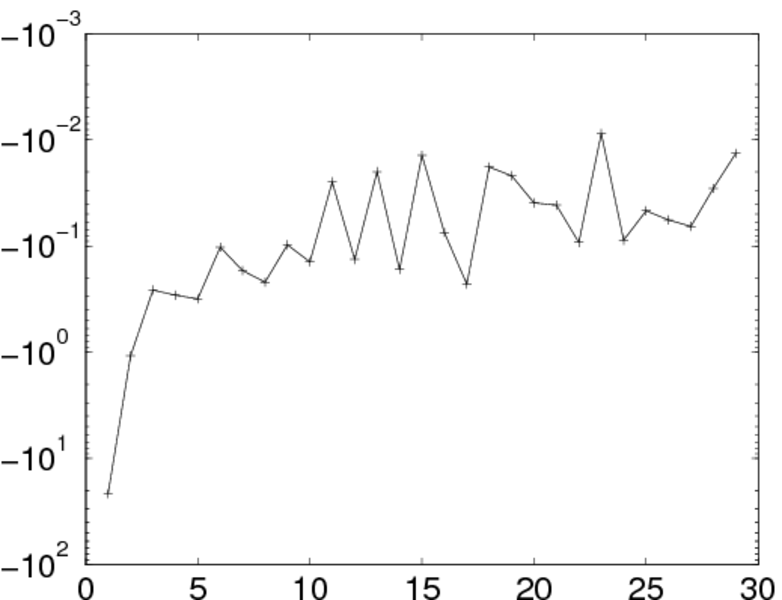
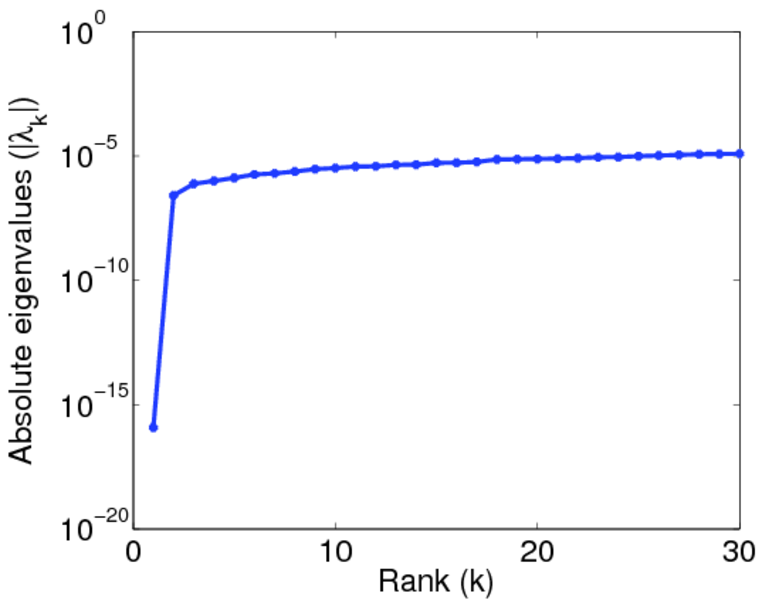
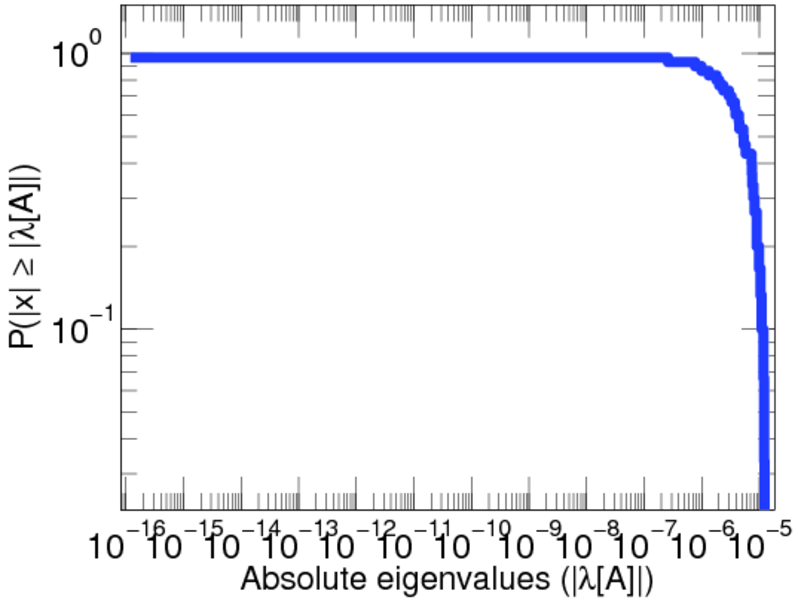
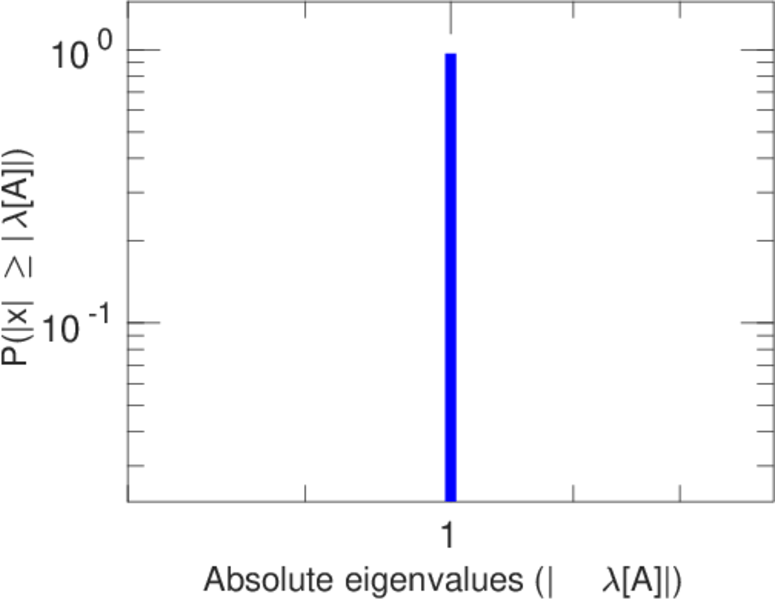
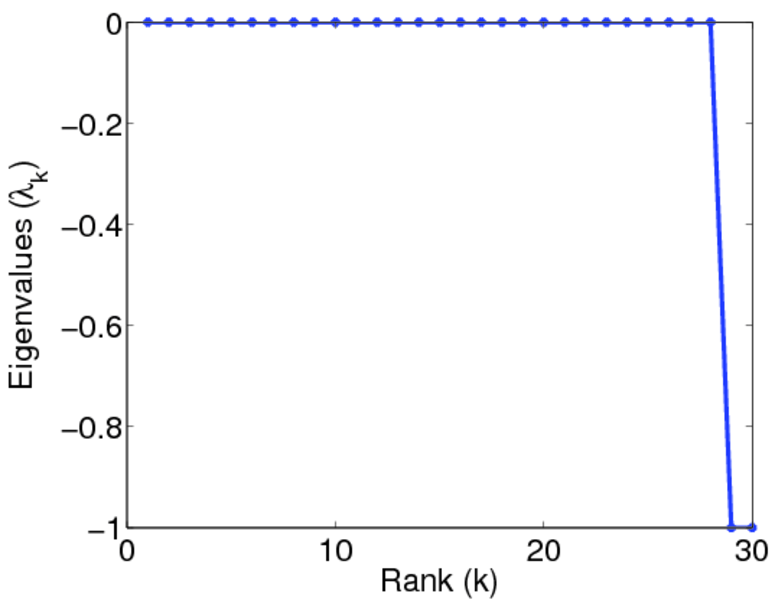
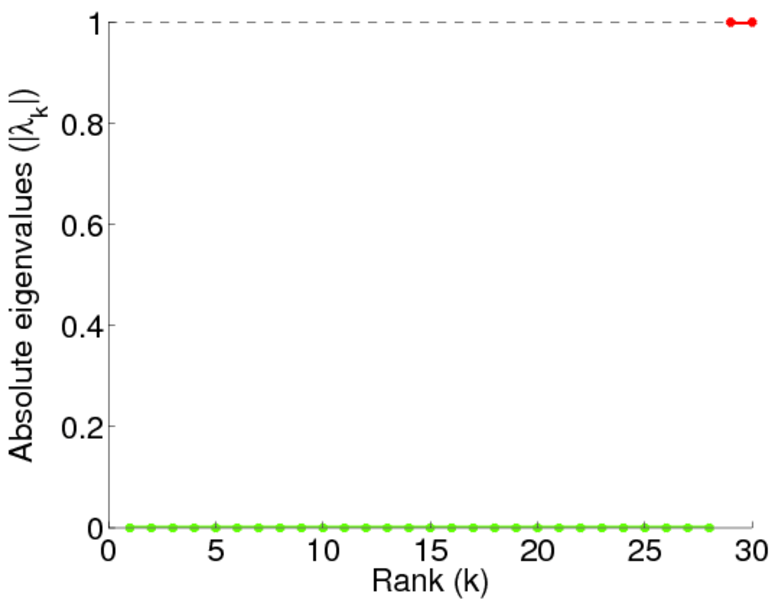
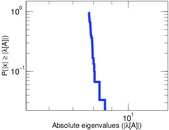
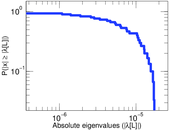
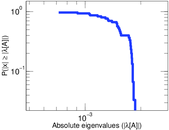
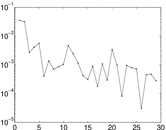
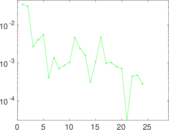
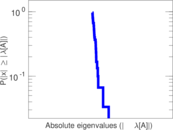
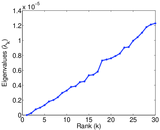
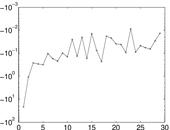
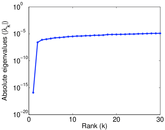
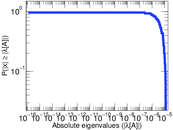
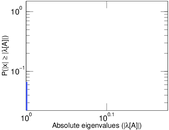
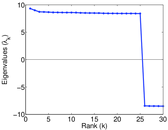
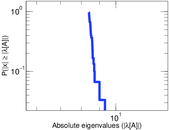
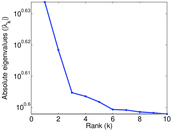
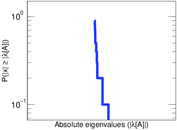
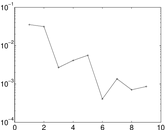
Plots


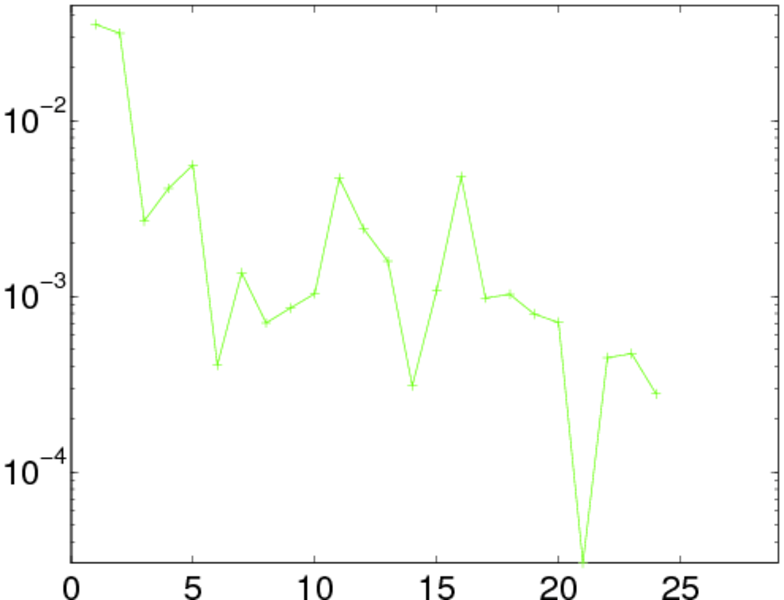
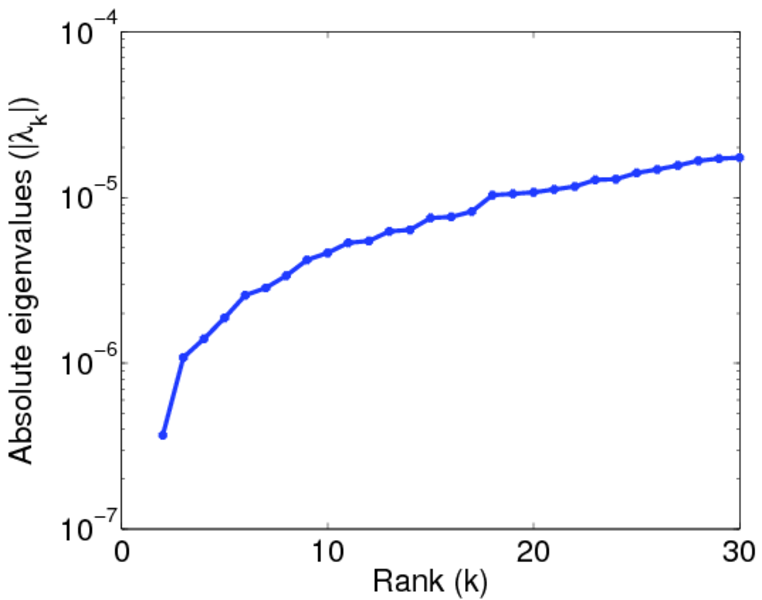
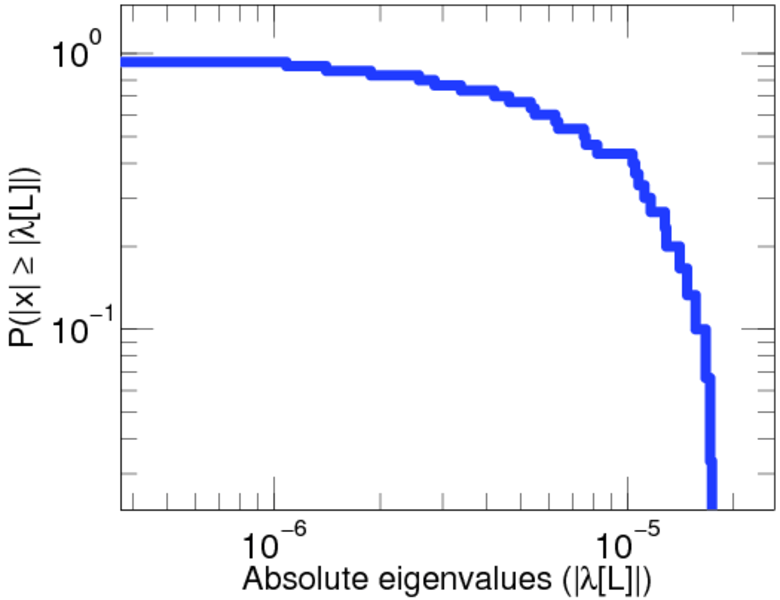
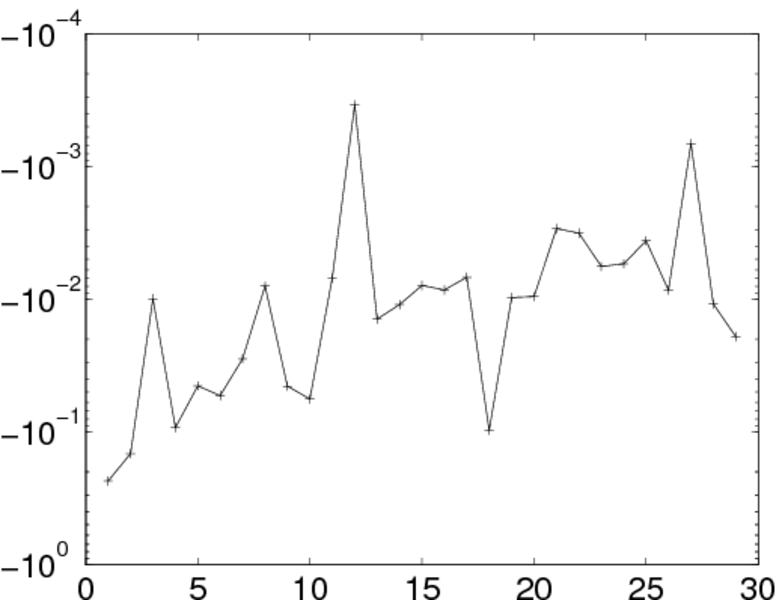
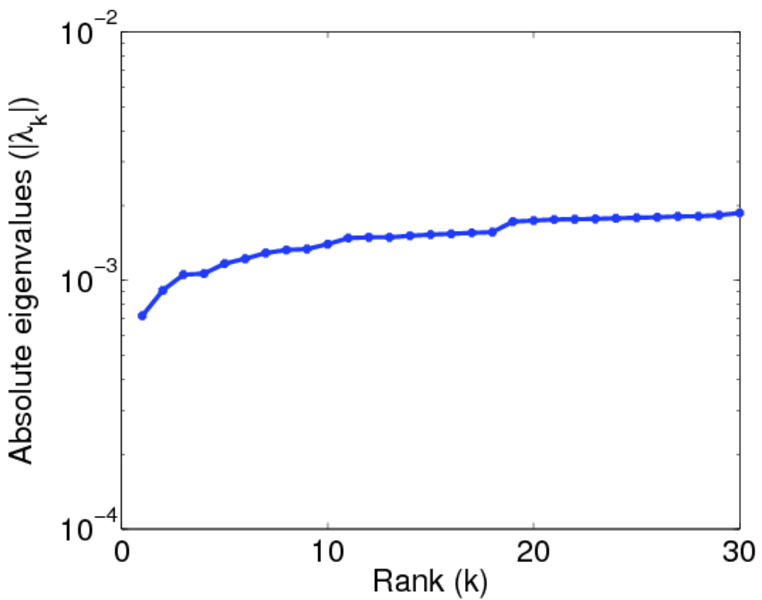
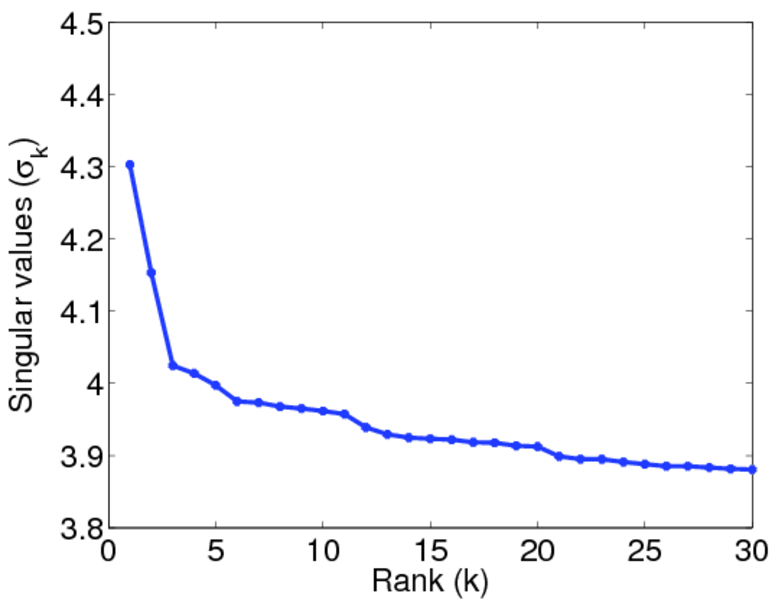
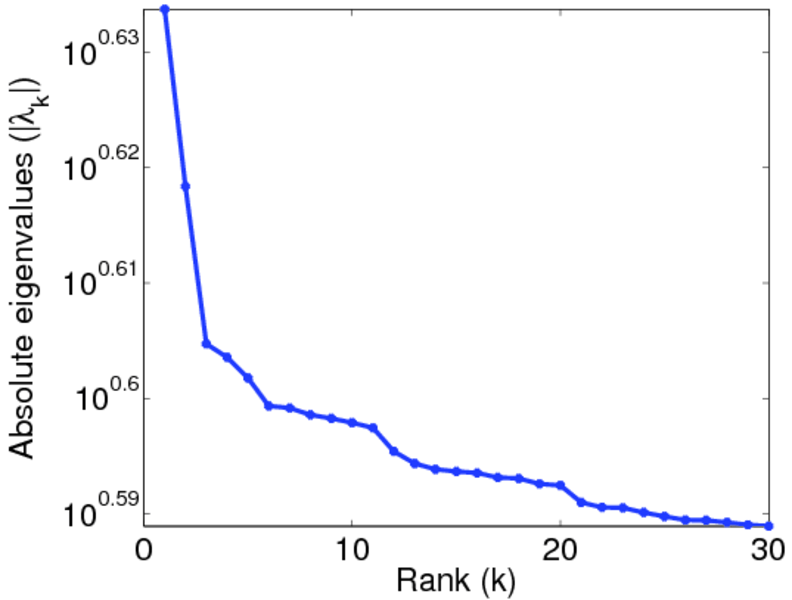
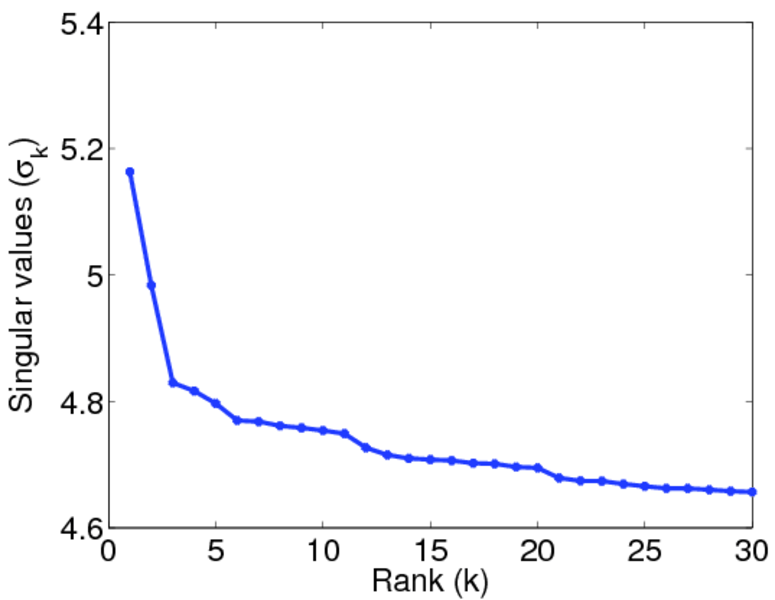
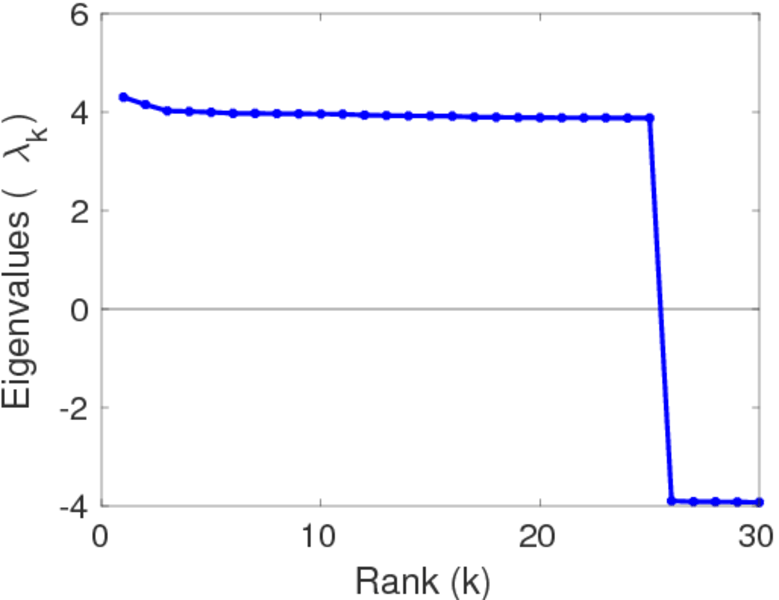
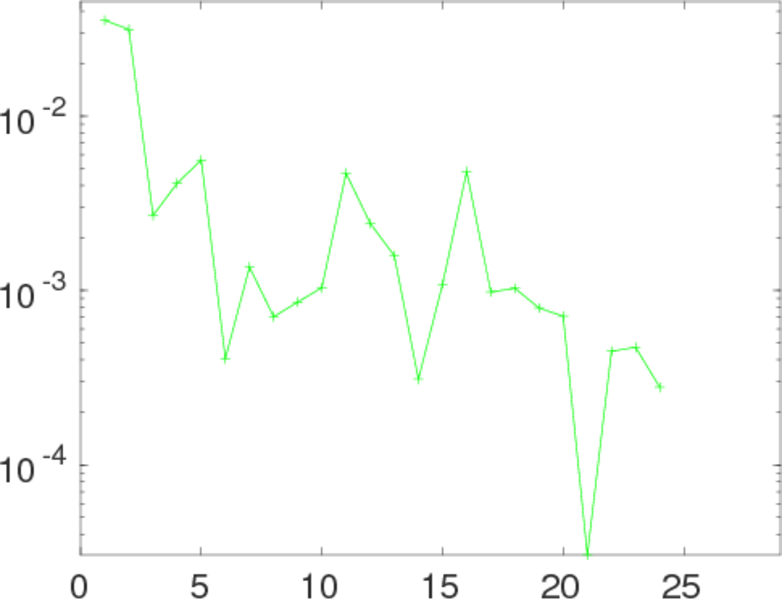
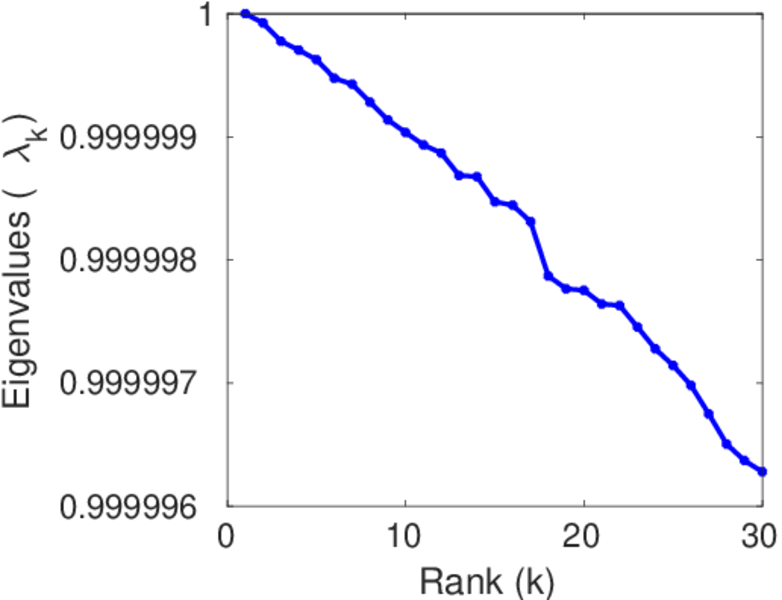
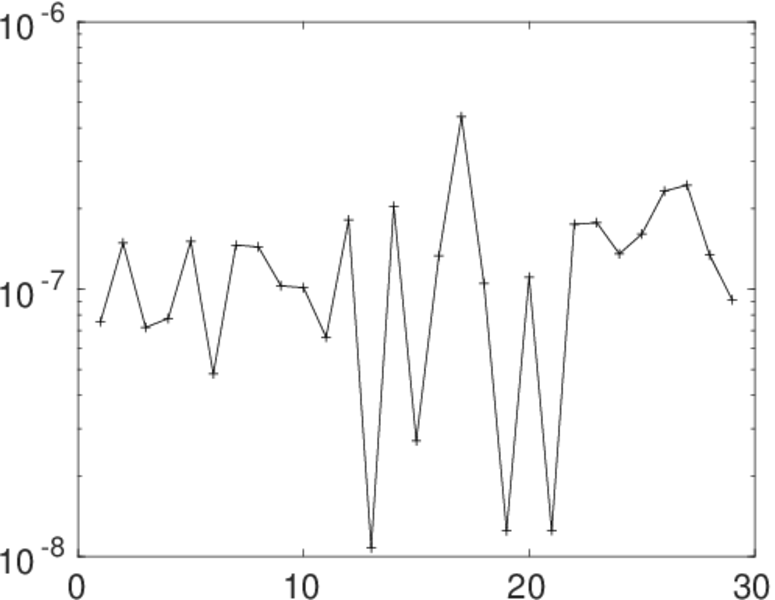
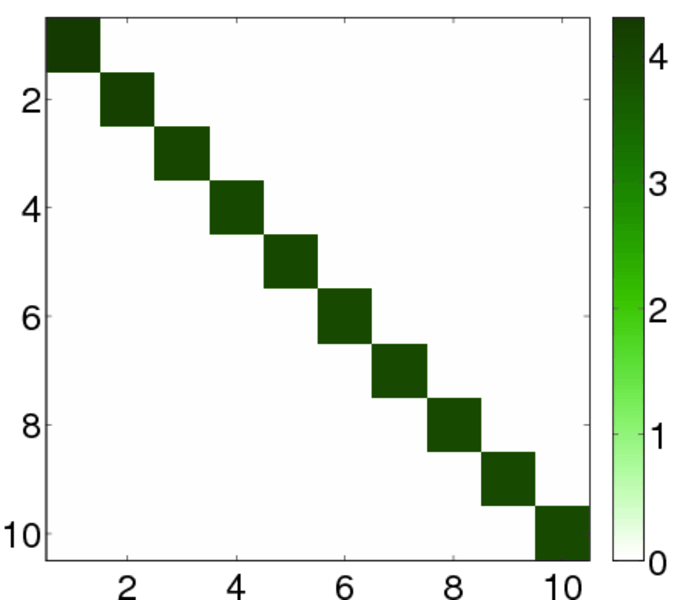
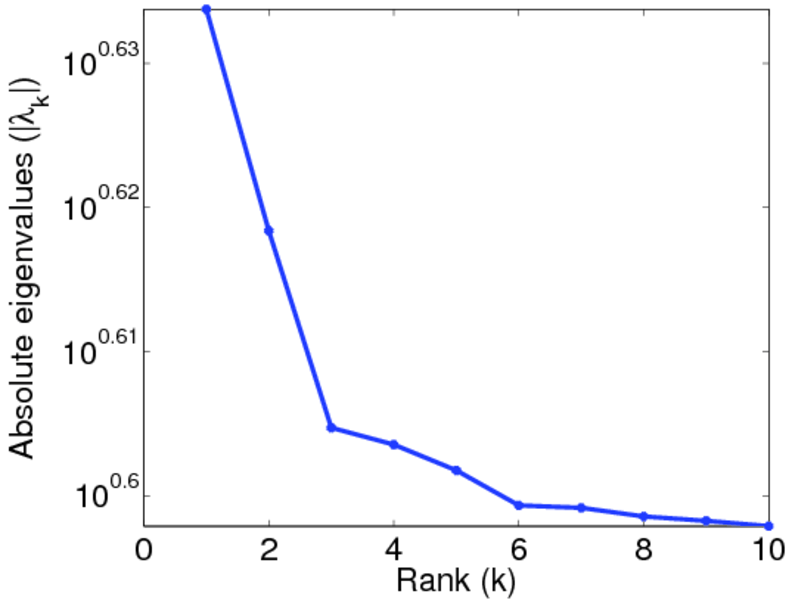
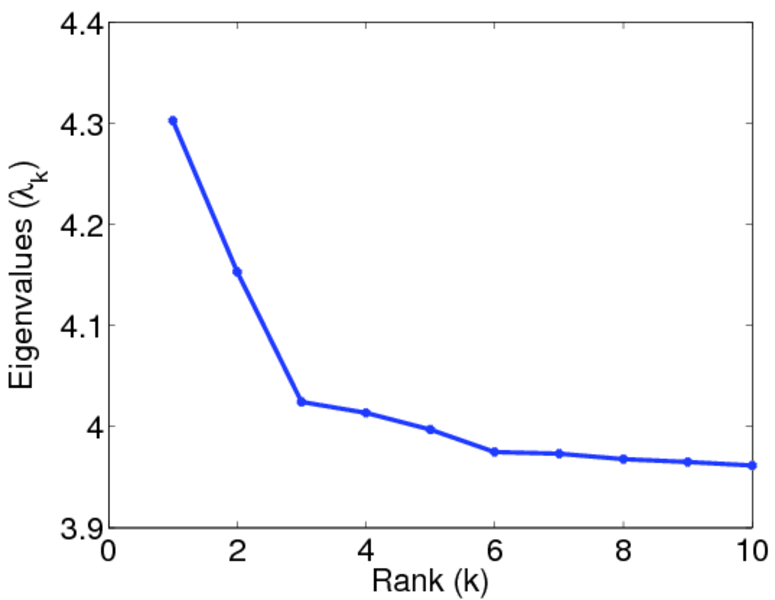
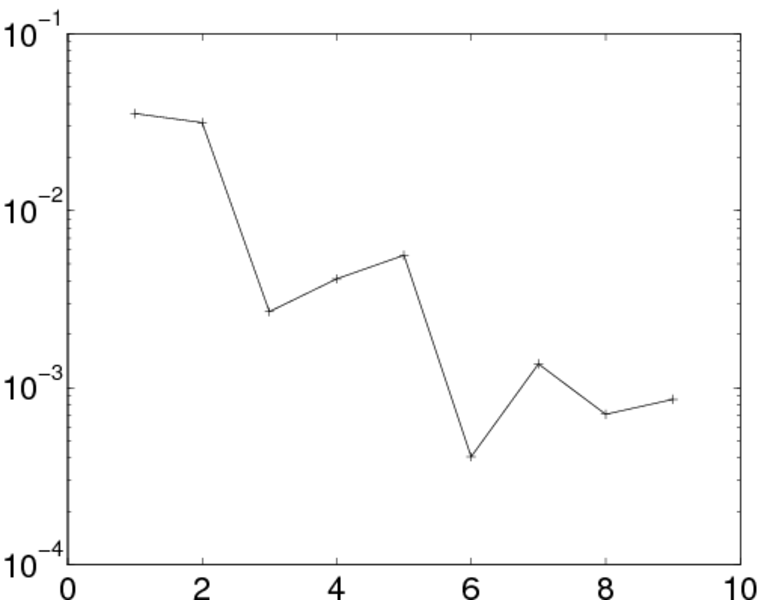
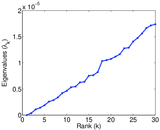
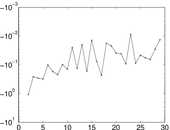
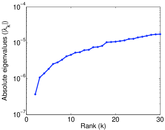
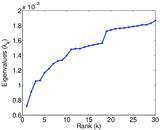
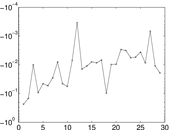
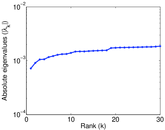
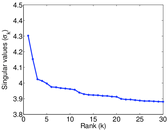
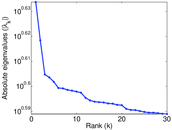
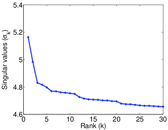
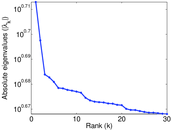
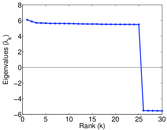
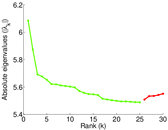
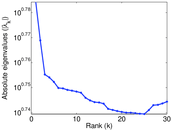
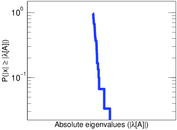
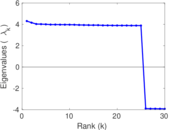
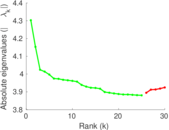
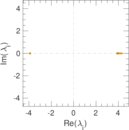
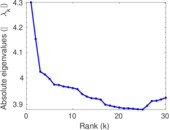
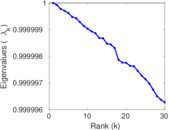
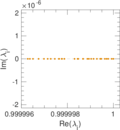
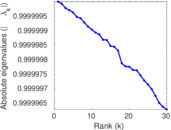
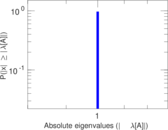
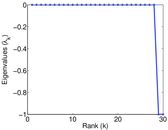
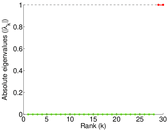
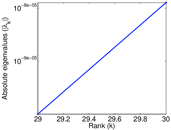
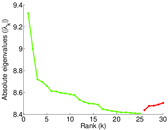
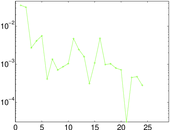
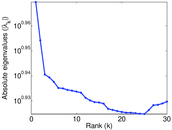
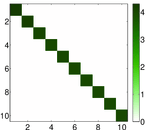
Matrix decompositions plots


Downloads
References
|
[1]
|
Jérôme Kunegis.
KONECT – The Koblenz Network Collection.
In Proc. Int. Conf. on World Wide Web Companion, pages
1343–1350, 2013.
[ http ]
|
 KONECT ‣ Networks ‣
Buy Me a Coffee
KONECT ‣ Networks ‣
Buy Me a Coffee