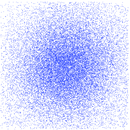
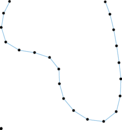
Central USA
This is the directed road network from the 9th DIMACS Implementation Challenge,
for the area "Central USA".
Metadata
Statistics
| Size | n = | 14,081,816
|
| Volume | m = | 33,866,826
|
| Loop count | l = | 0
|
| Wedge count | s = | 29,871,503
|
| Claw count | z = | 213,100,732
|
| Cross count | x = | 196,476,719
|
| Triangle count | t = | 228,918
|
| Square count | q = | 958,926
|
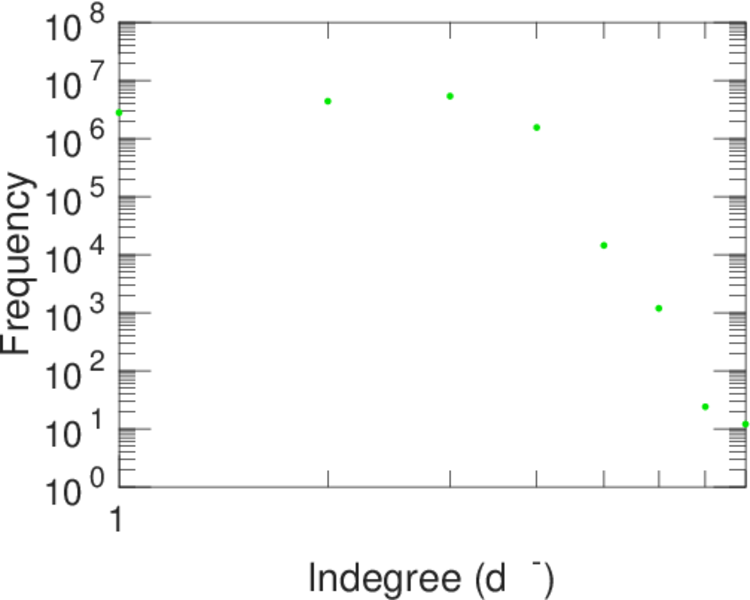
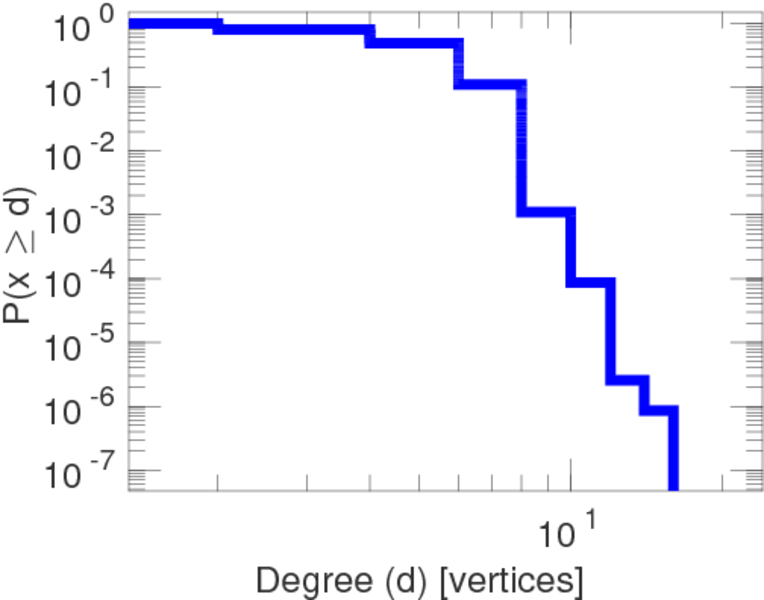
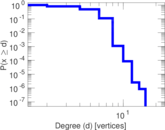
| Maximum degree | dmax = | 16
|
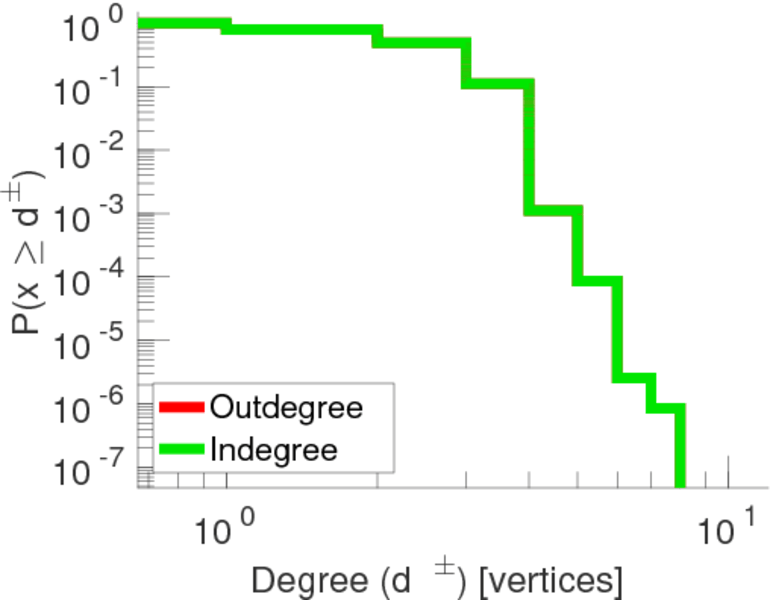
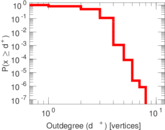
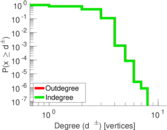
| Maximum outdegree | d+max = | 8
|
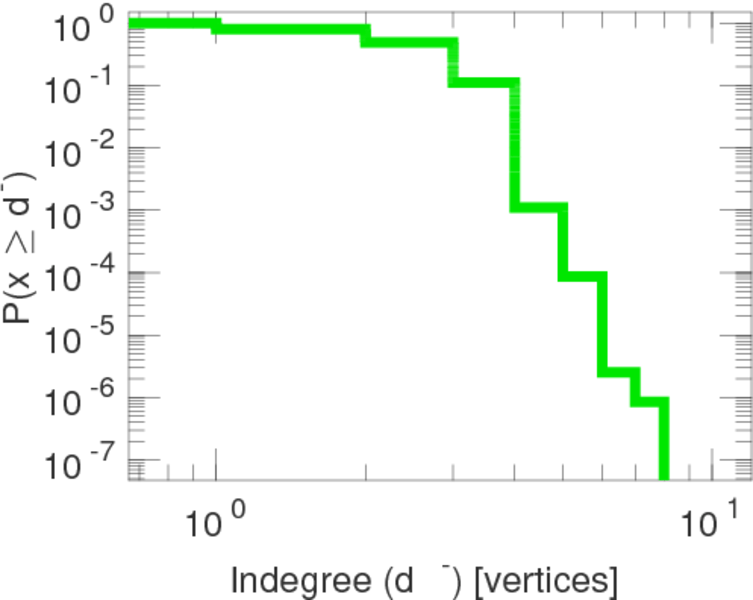
| Maximum indegree | d−max = | 8
|
| Average degree | d = | 4.810 01
|
| Fill | p = | 1.707 88 × 10−7
|
| Size of LCC | N = | 14,081,816
|
| Size of LSCC | Ns = | 14,081,816
|
| Relative size of LSCC | Nrs = | 1.000 00
|
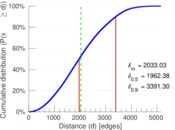
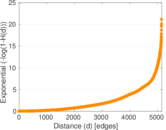
| Diameter | δ = | 5,533
|
| 50-Percentile effective diameter | δ0.5 = | 1,962.38
|
| 90-Percentile effective diameter | δ0.9 = | 3,391.30
|
| Median distance | δM = | 1,963
|
| Mean distance | δm = | 2,033.03
|
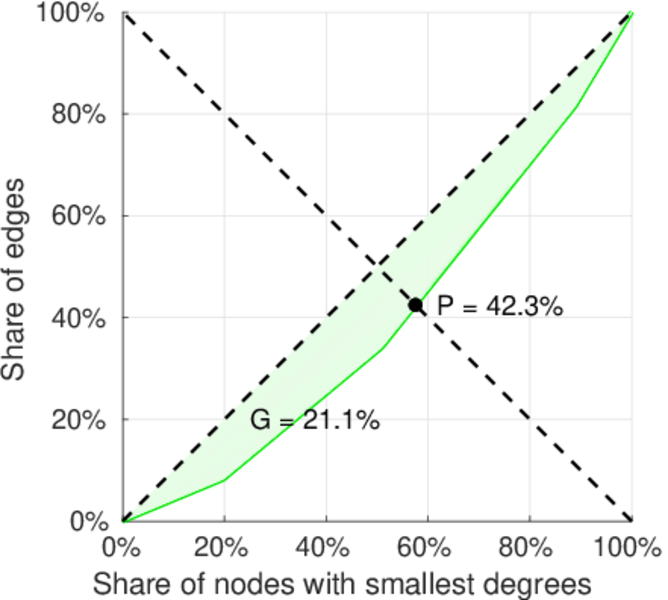
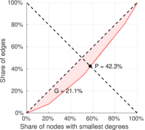
| Gini coefficient | G = | 0.211 404
|
| Balanced inequality ratio | P = | 0.423 275
|
| Outdegree balanced inequality ratio | P+ = | 0.423 275
|
| Indegree balanced inequality ratio | P− = | 0.423 275
|
| Relative edge distribution entropy | Her = | 0.995 172
|
| Power law exponent | γ = | 2.270 42
|
| Tail power law exponent | γt = | 6.451 00
|
| Tail power law exponent with p | γ3 = | 6.451 00
|
| p-value | p = | 0.000 00
|
| Outdegree tail power law exponent with p | γ3,o = | 6.451 00
|
| Outdegree p-value | po = | 0.000 00
|
| Indegree tail power law exponent with p | γ3,i = | 6.451 00
|
| Indegree p-value | pi = | 0.000 00
|
| Degree assortativity | ρ = | +0.061 691 4
|
| Degree assortativity p-value | pρ = | 0.000 00
|
| Clustering coefficient | c = | 0.022 990 3
|
| Spectral norm | α = | 9.039 66
|
| Operator 2-norm | ν = | 4.519 83
|
| Spectral separation | |λ1[A] / λ2[A]| = | 1.054 40
|
| Reciprocity | y = | 1.000 00
|
| Non-bipartivity | bA = | 0.125 732
|
| Normalized non-bipartivity | bN = | 7.028 07 × 10−5
|
| Algebraic non-bipartivity | χ = | 0.000 141 024
|
| Spectral bipartite frustration | bK = | 1.465 95 × 10−5
|
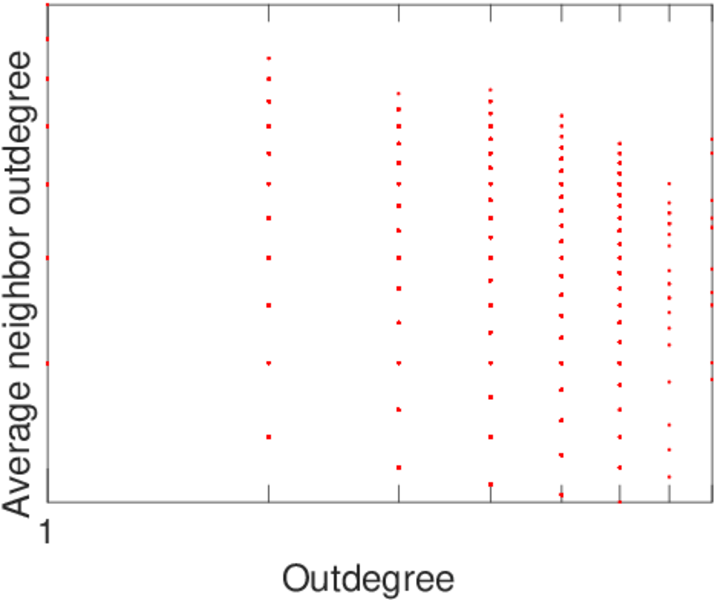
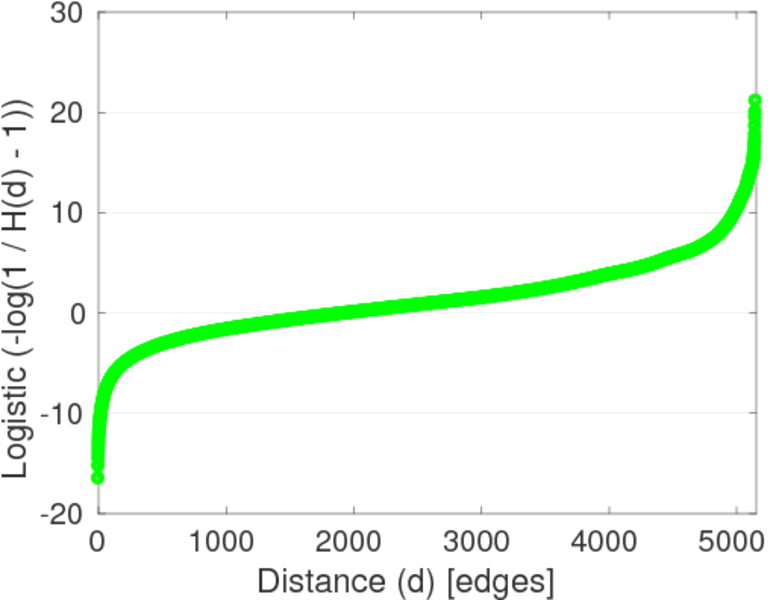
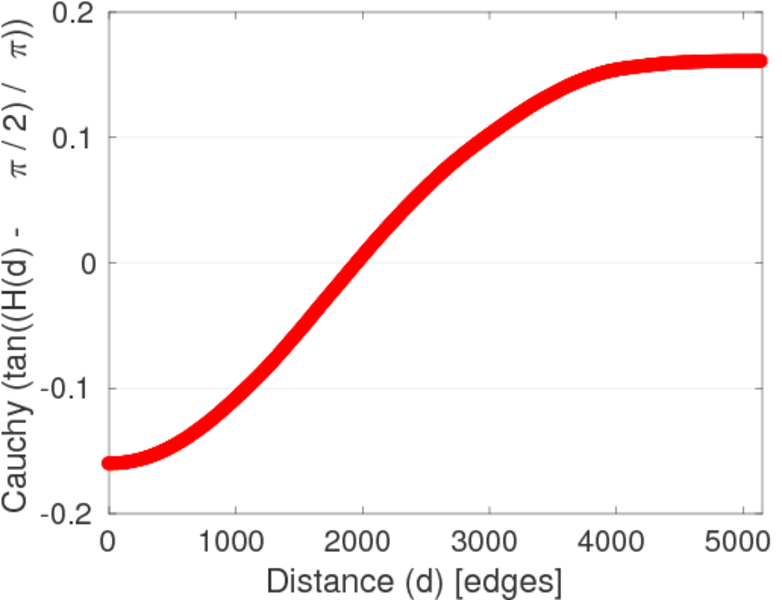
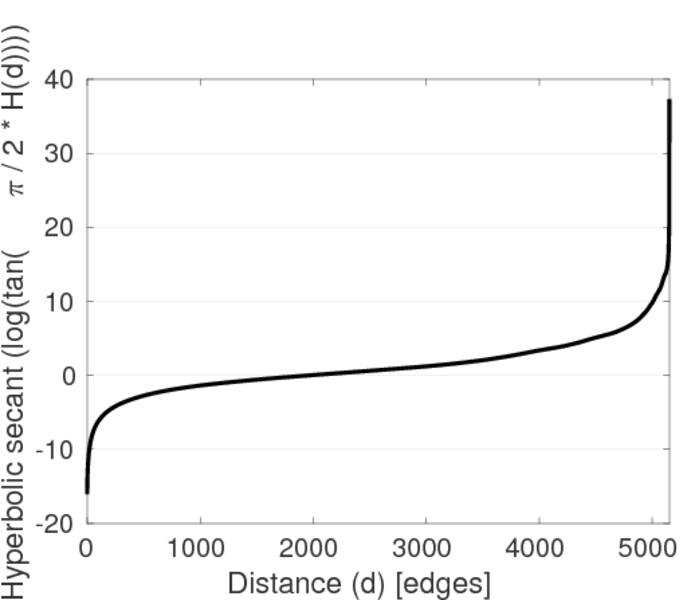
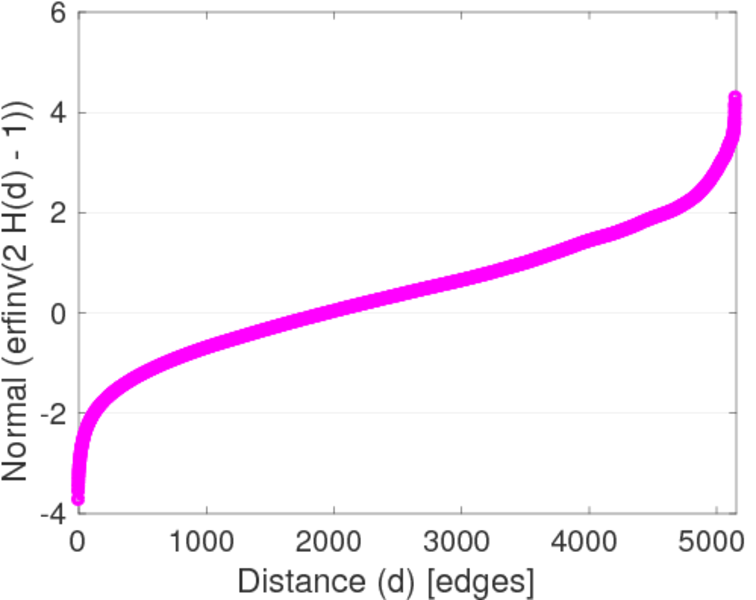
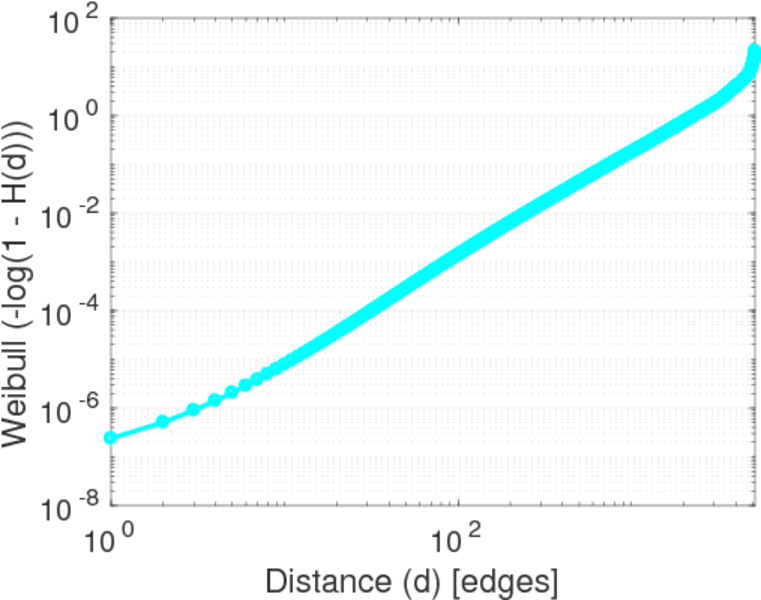
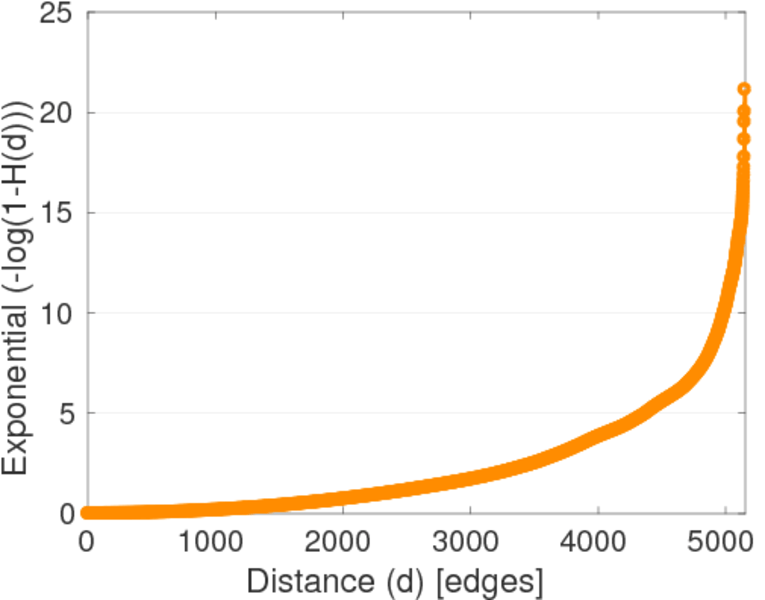
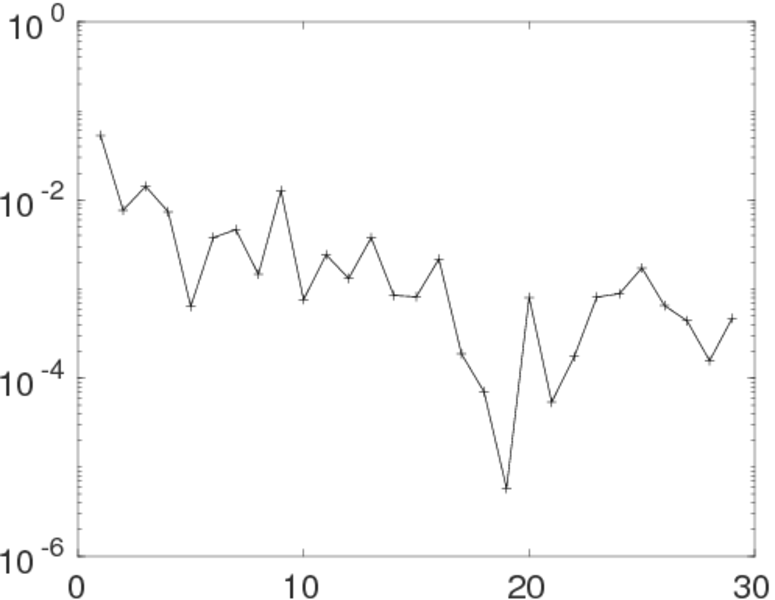
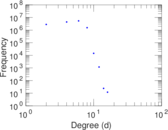
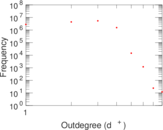
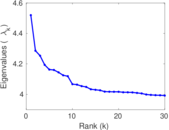
Plots


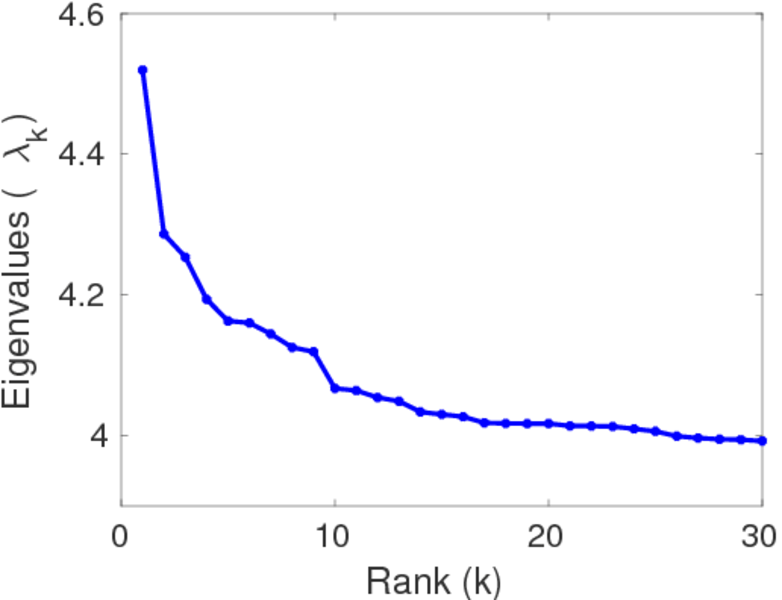
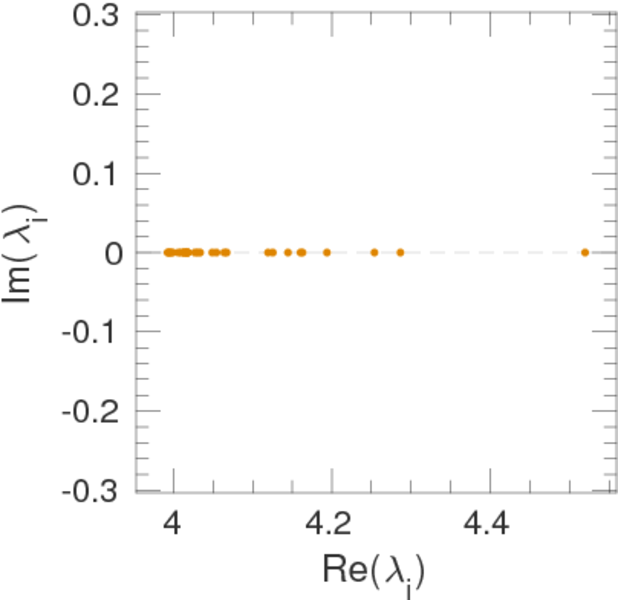
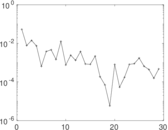
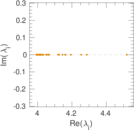
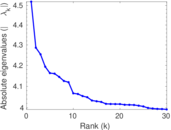
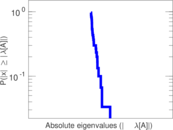
Matrix decompositions plots
Downloads
References
|
[1]
|
Jérôme Kunegis.
KONECT – The Koblenz Network Collection.
In Proc. Int. Conf. on World Wide Web Companion, pages
1343–1350, 2013.
[ http ]
|
 KONECT ‣ Networks ‣
Buy Me a Coffee
KONECT ‣ Networks ‣
Buy Me a Coffee