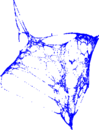
Northwest USA
This is the directed road network from the 9th DIMACS Implementation Challenge,
for the area "Northwest USA".
Metadata
Statistics
| Size | n = | 1,207,945
|
| Volume | m = | 2,820,774
|
| Wedge count | s = | 2,414,774
|
| Claw count | z = | 17,007,896
|
| Cross count | x = | 15,343,462
|
| Triangle count | t = | 21,527
|
| Square count | q = | 64,556
|
| 4-Tour count | T4 = | 12,996,318
|
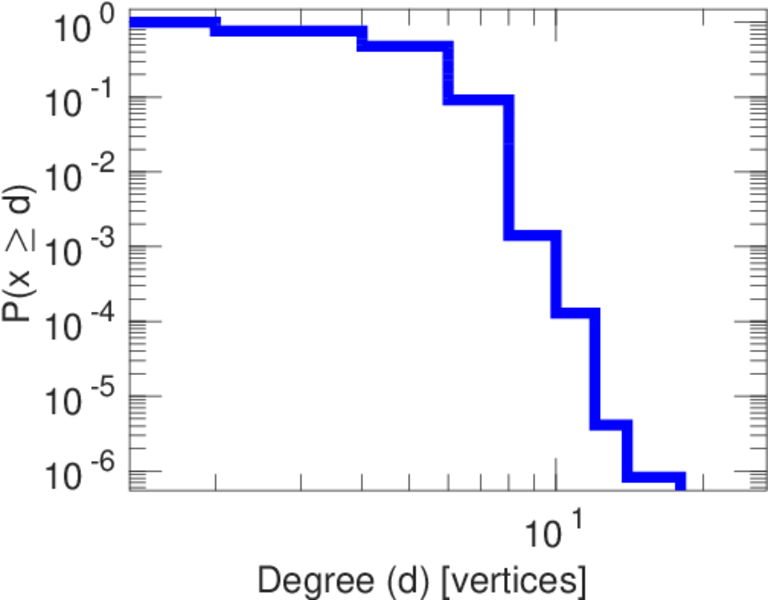
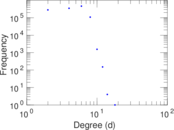
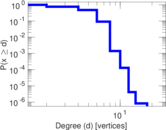
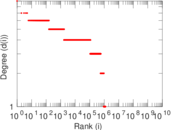
| Maximum degree | dmax = | 18
|
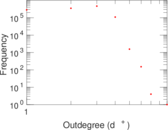
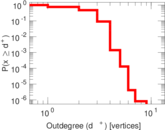
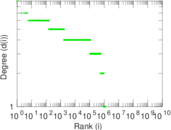
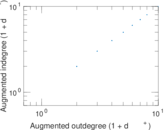
| Maximum outdegree | d+max = | 9
|
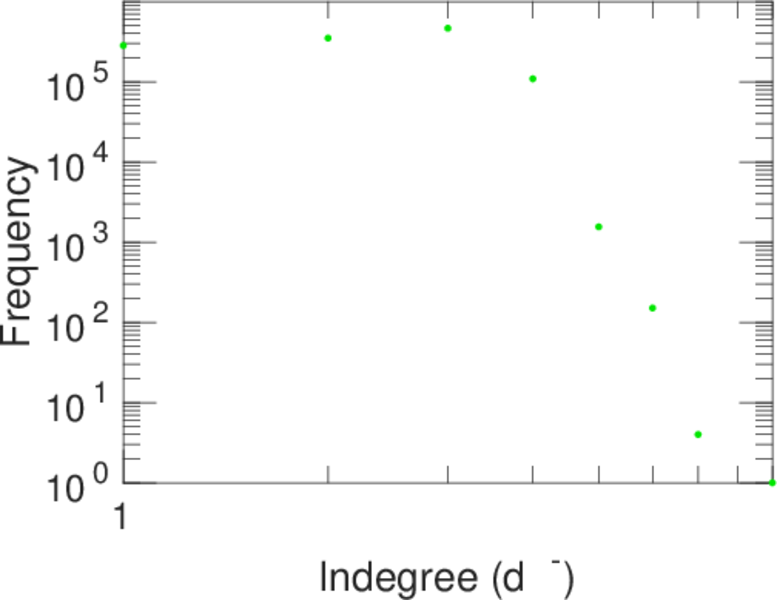
| Maximum indegree | d−max = | 9
|
| Average degree | d = | 4.670 37
|
| Size of LCC | N = | 1,207,945
|
| Size of LSCC | Ns = | 1,207,945
|
| Relative size of LSCC | Nrs = | 1.000 00
|
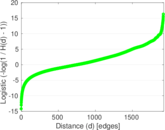
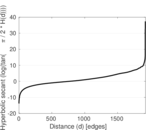
| Diameter | δ = | 1,994
|
| 50-Percentile effective diameter | δ0.5 = | 763.928
|
| 90-Percentile effective diameter | δ0.9 = | 1,155.23
|
| Median distance | δM = | 764
|
| Mean distance | δm = | 754.722
|
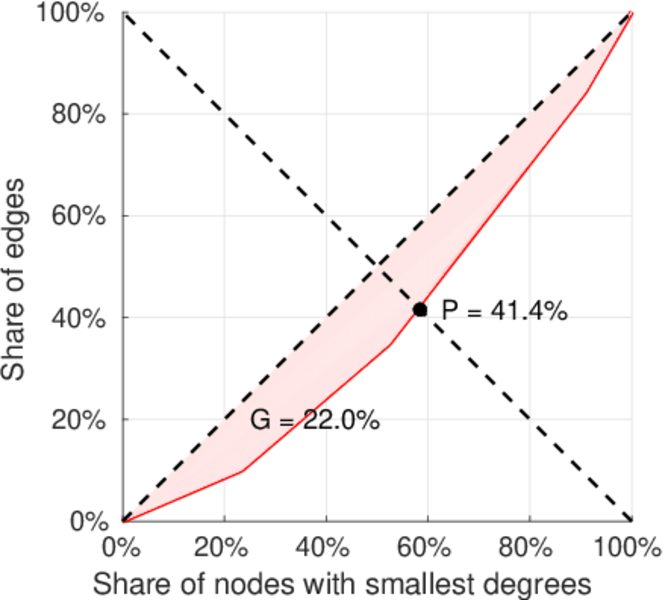
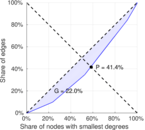
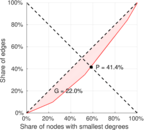
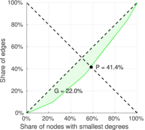
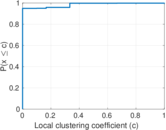
| Gini coefficient | G = | 0.219 823
|
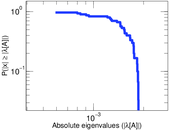
| Balanced inequality ratio | P = | 0.414 165
|
| Outdegree balanced inequality ratio | P+ = | 0.414 165
|
| Indegree balanced inequality ratio | P− = | 0.414 165
|
| Relative edge distribution entropy | Her = | 0.993 873
|
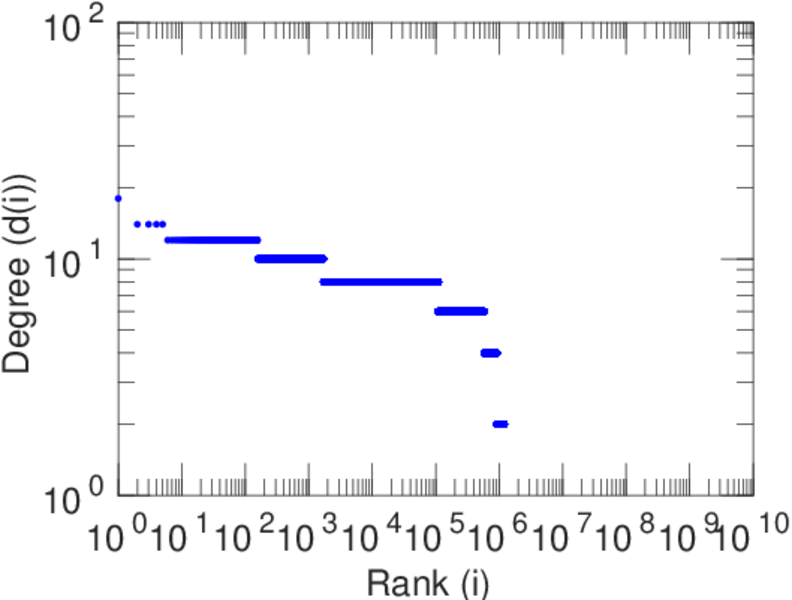
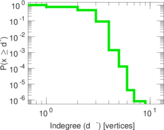
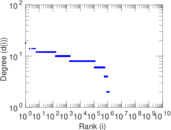
| Power law exponent | γ = | 2.332 13
|
| Tail power law exponent | γt = | 6.861 00
|
| Tail power law exponent with p | γ3 = | 6.861 00
|
| p-value | p = | 0.000 00
|
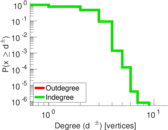
| Outdegree tail power law exponent with p | γ3,o = | 6.861 00
|
| Outdegree p-value | po = | 0.000 00
|
| Indegree tail power law exponent with p | γ3,i = | 6.861 00
|
| Indegree p-value | pi = | 0.000 00
|
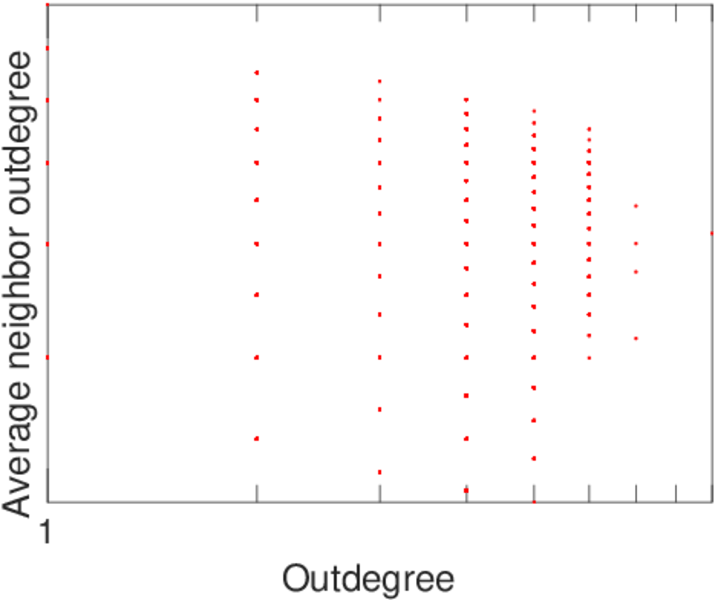
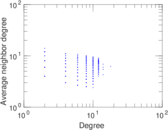
| Degree assortativity | ρ = | +0.048 149 4
|
| Degree assortativity p-value | pρ = | 0.000 00
|
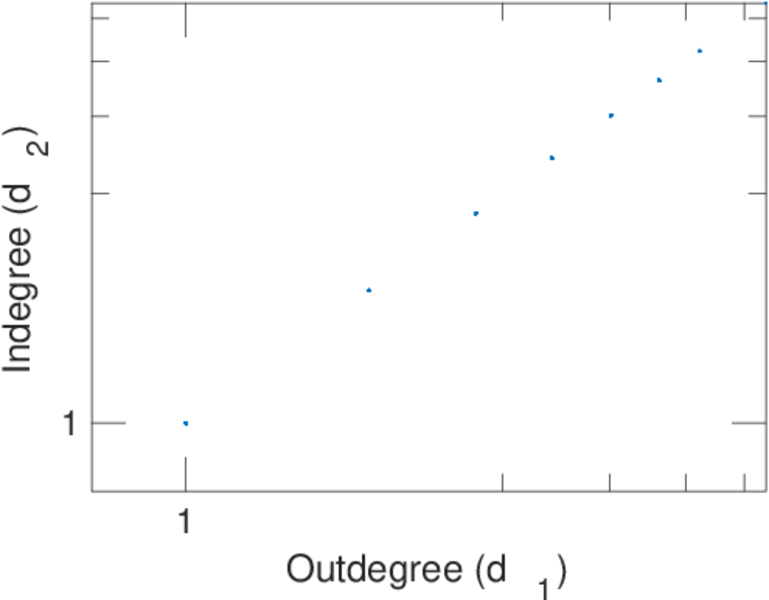
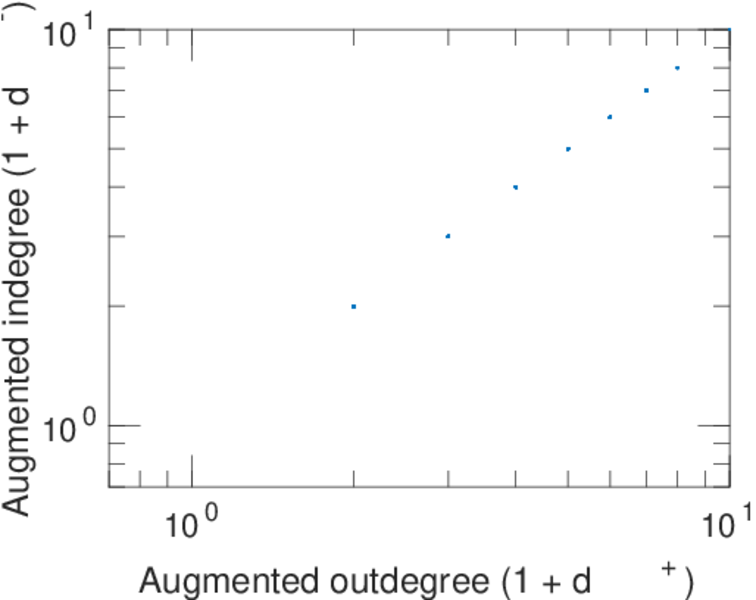
| In/outdegree correlation | ρ± = | +1.000 00
|
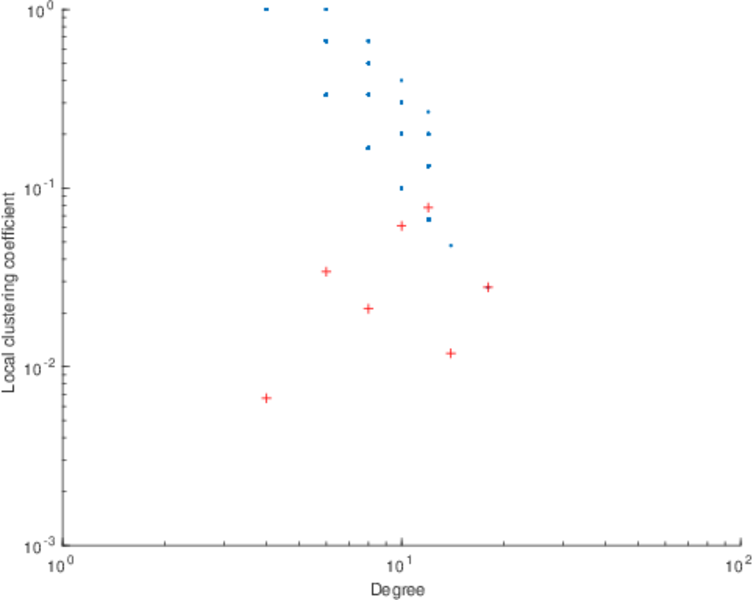
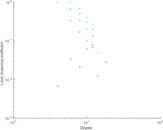
| Clustering coefficient | c = | 0.026 744 1
|
| Directed clustering coefficient | c± = | 0.026 744 1
|
| Spectral norm | α = | 8.375 31
|
| Operator 2-norm | ν = | 4.187 65
|
| Cyclic eigenvalue | π = | 4.187 65
|
| Algebraic connectivity | a = | 6.362 32 × 10−7
|
| Reciprocity | y = | 1.000 00
|
| Non-bipartivity | bA = | 0.065 255 6
|
| Normalized non-bipartivity | bN = | 0.000 148 562
|
| Algebraic non-bipartivity | χ = | 0.000 296 058
|
| Spectral bipartite frustration | bK = | 3.169 53 × 10−5
|
| Controllability | C = | 129,124
|
| Relative controllability | Cr = | 0.106 896
|
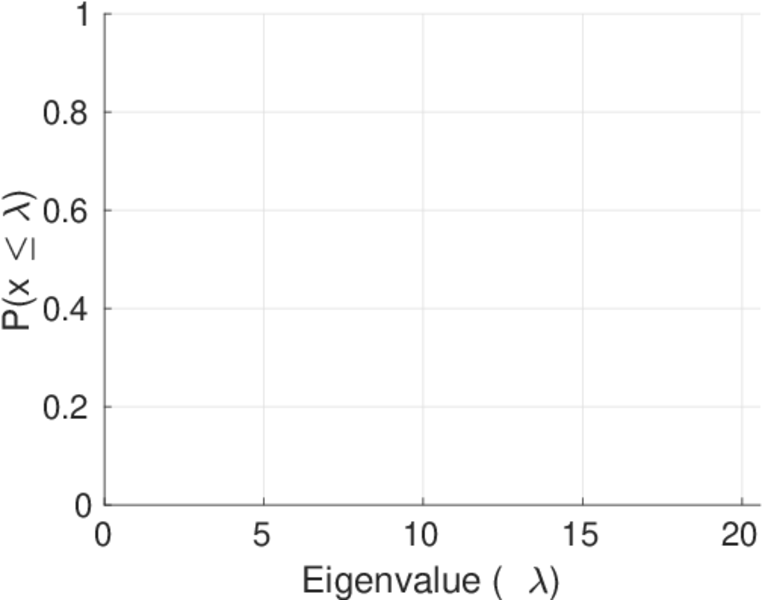
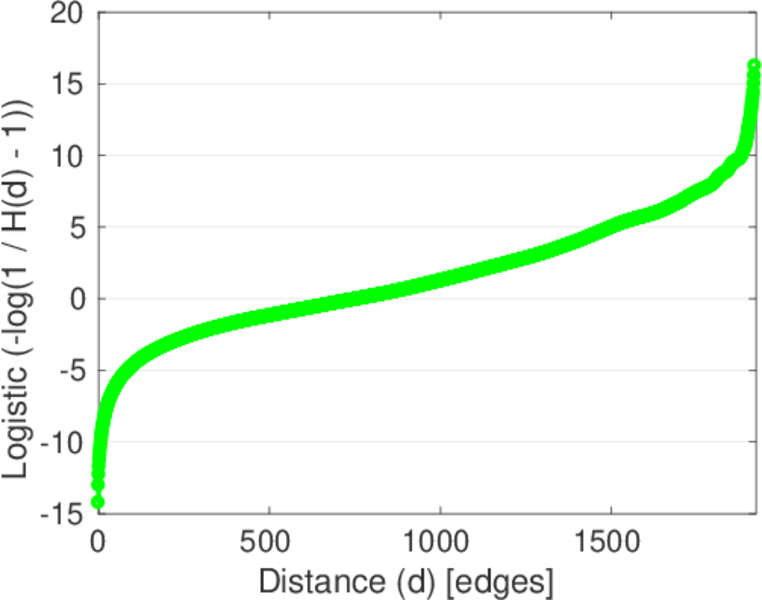
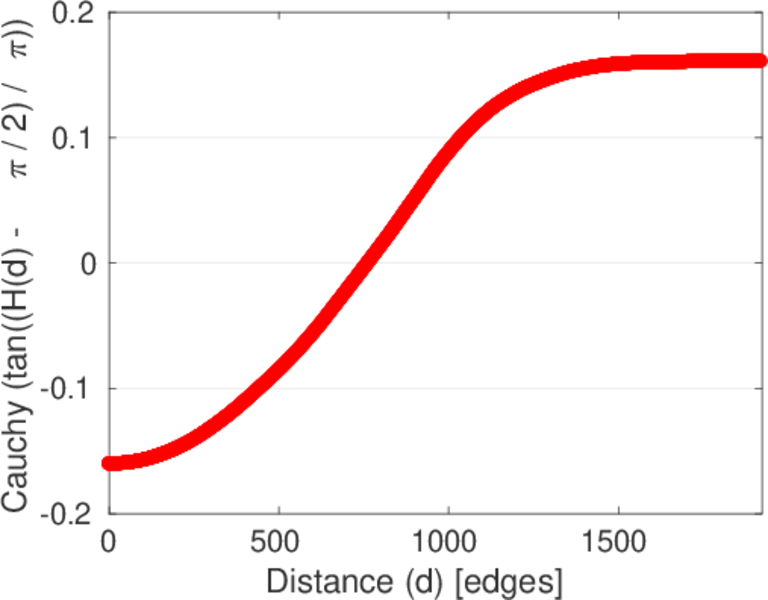
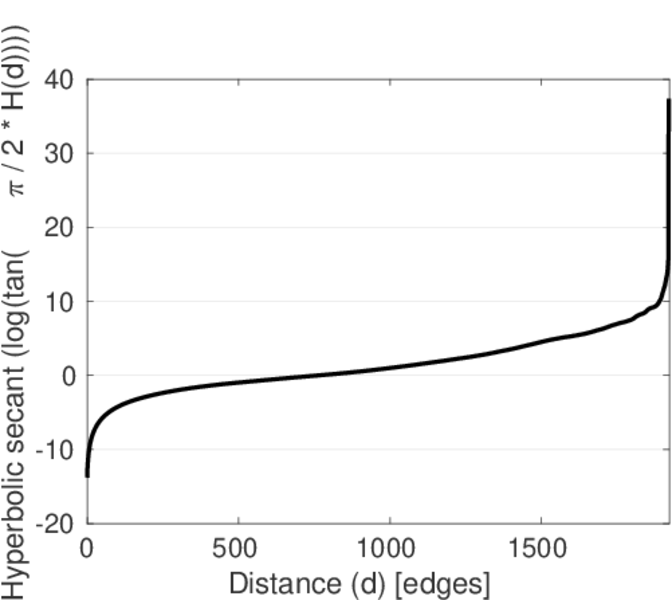
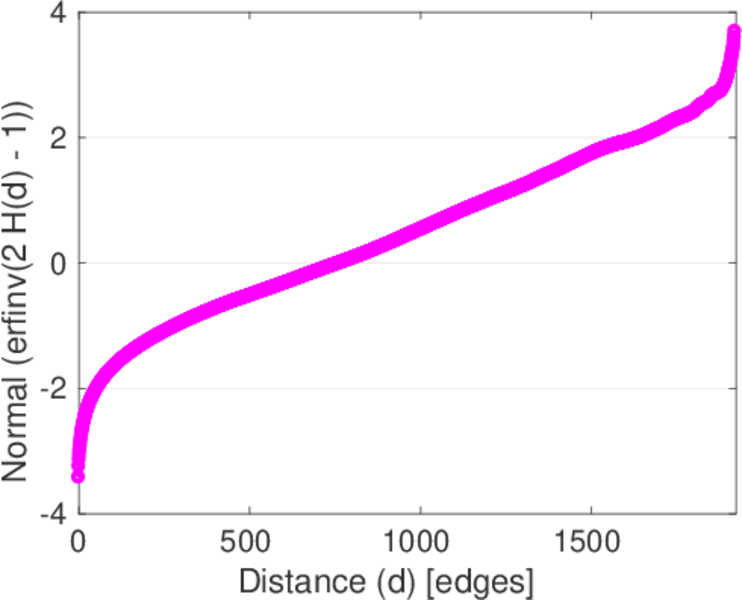
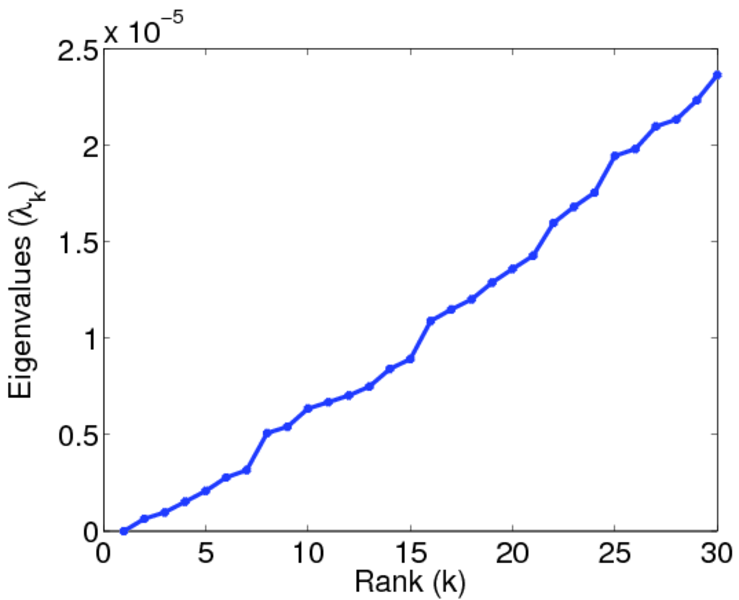
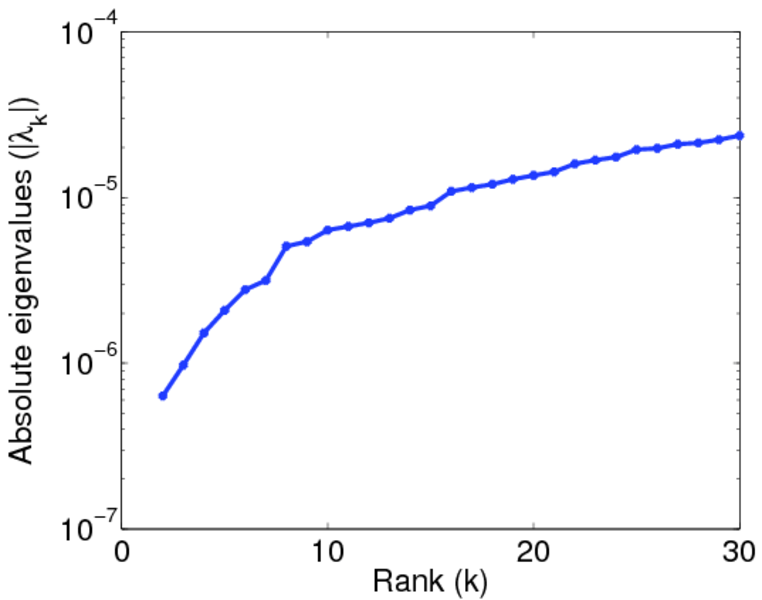
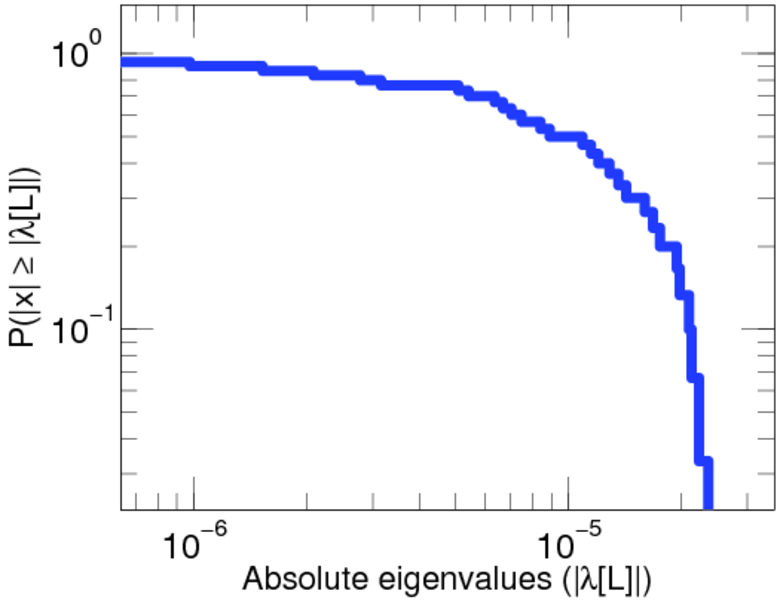
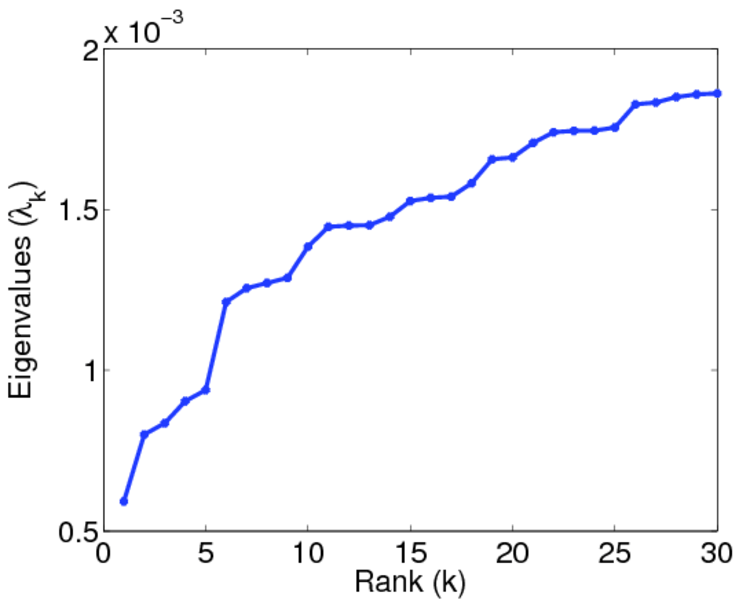
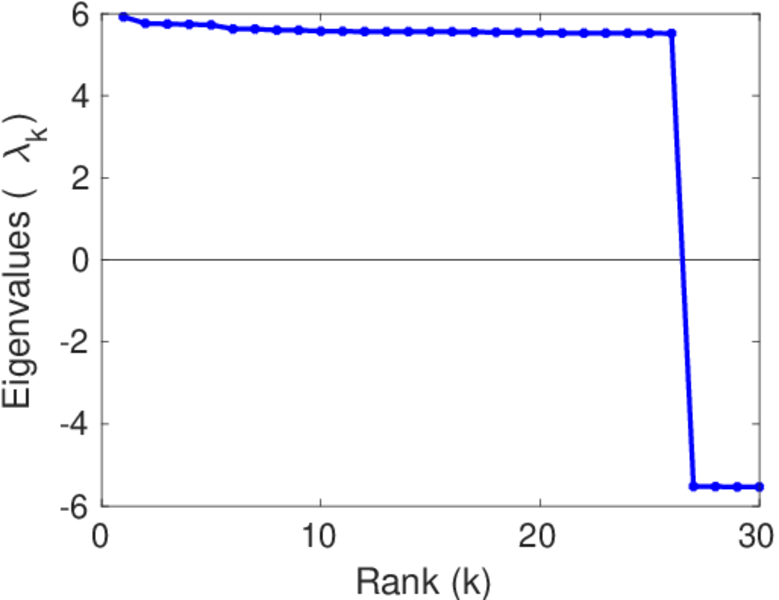
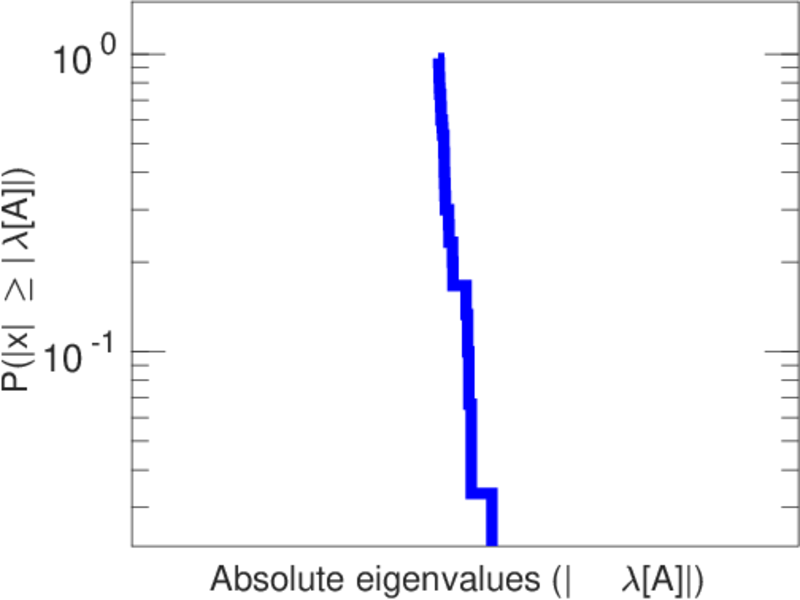
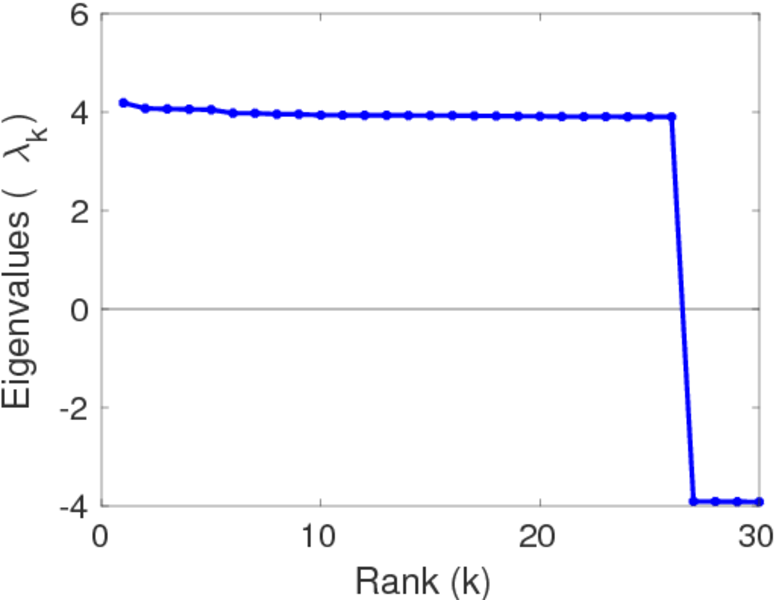
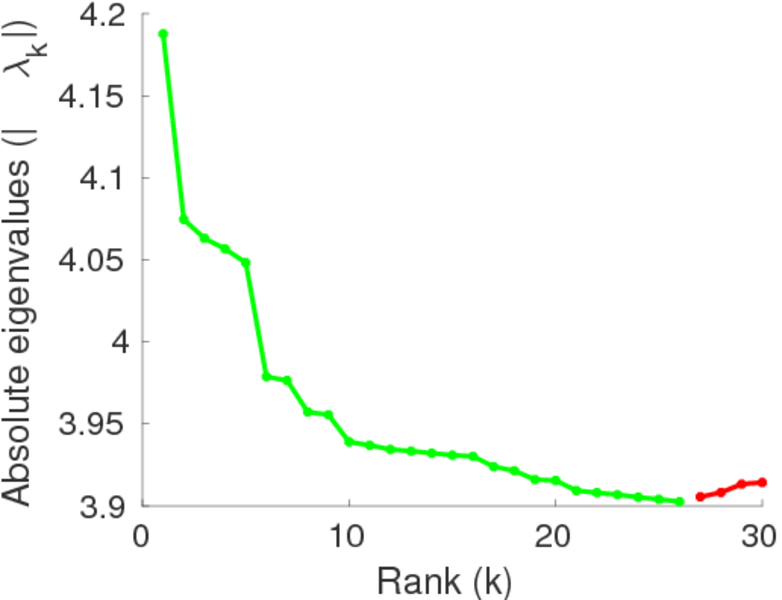
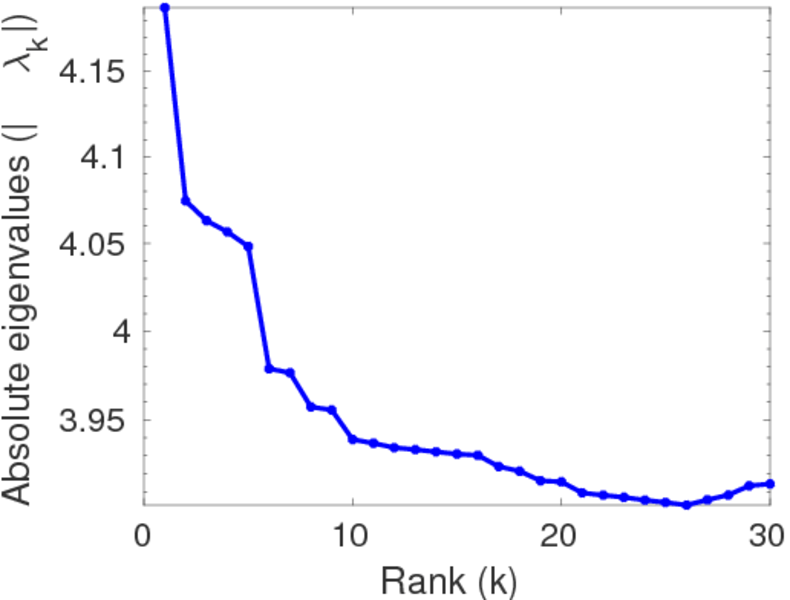
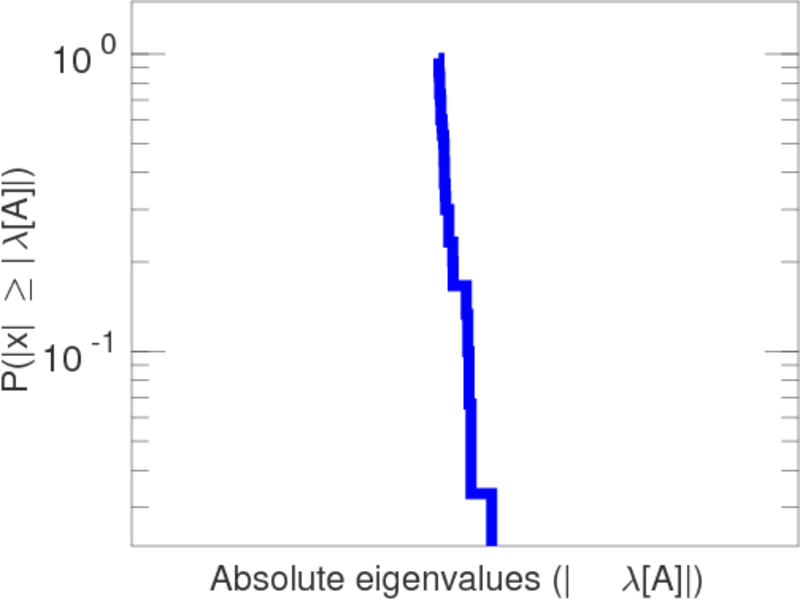
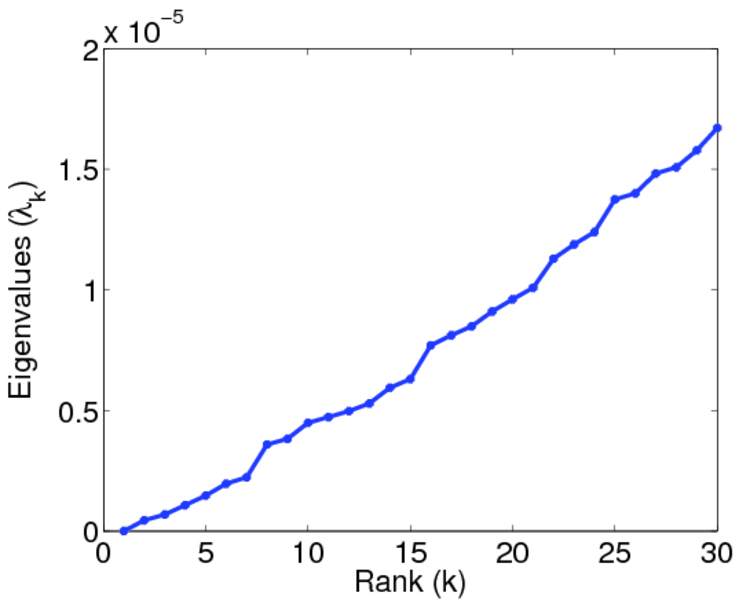
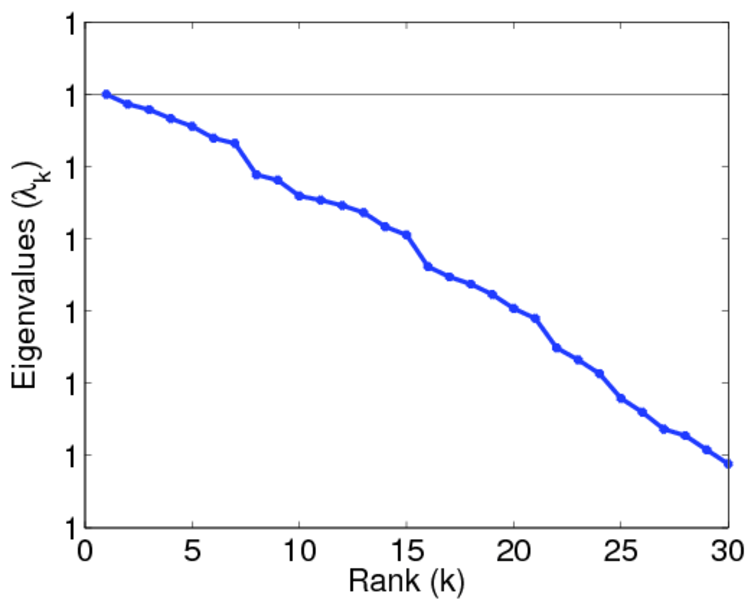
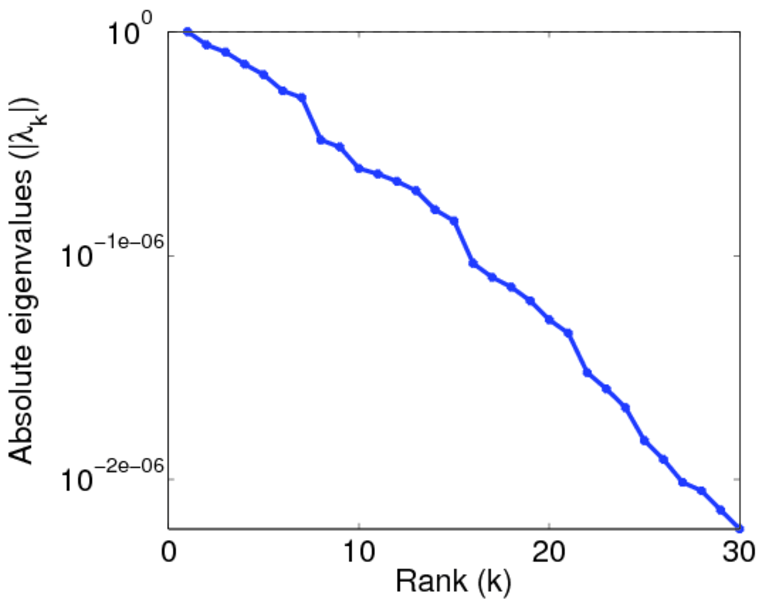
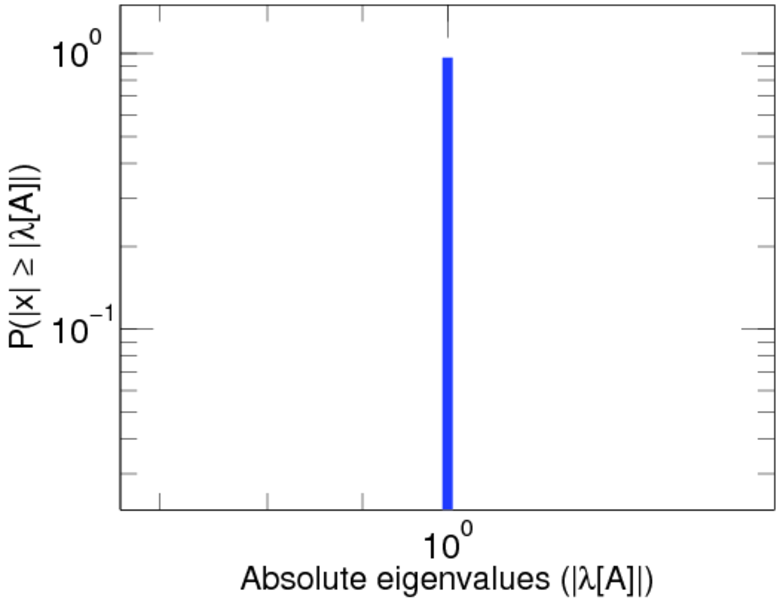
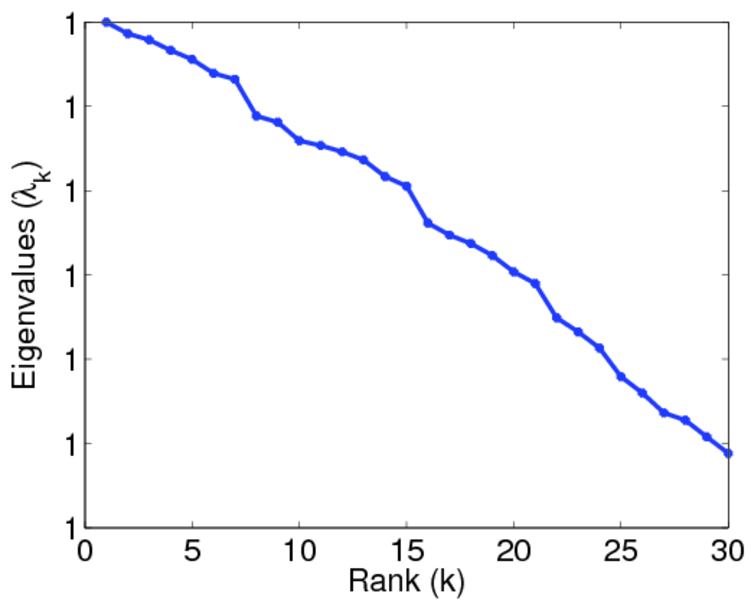
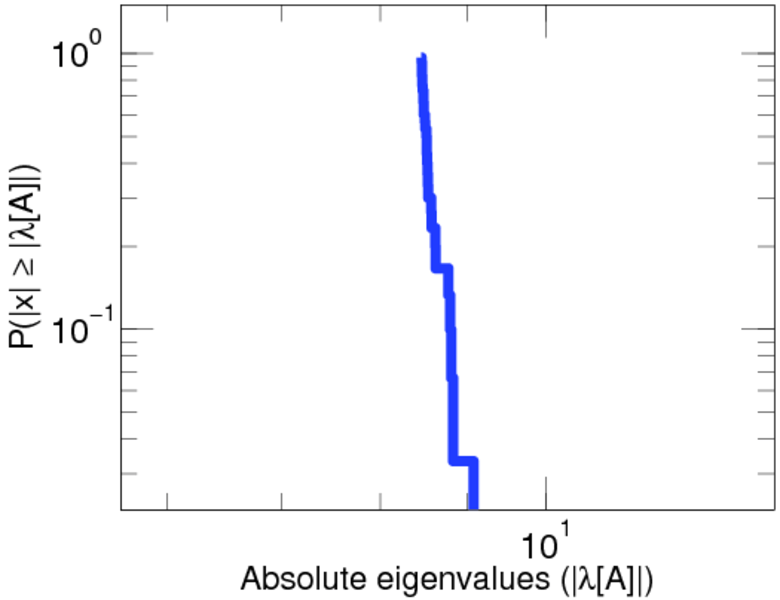
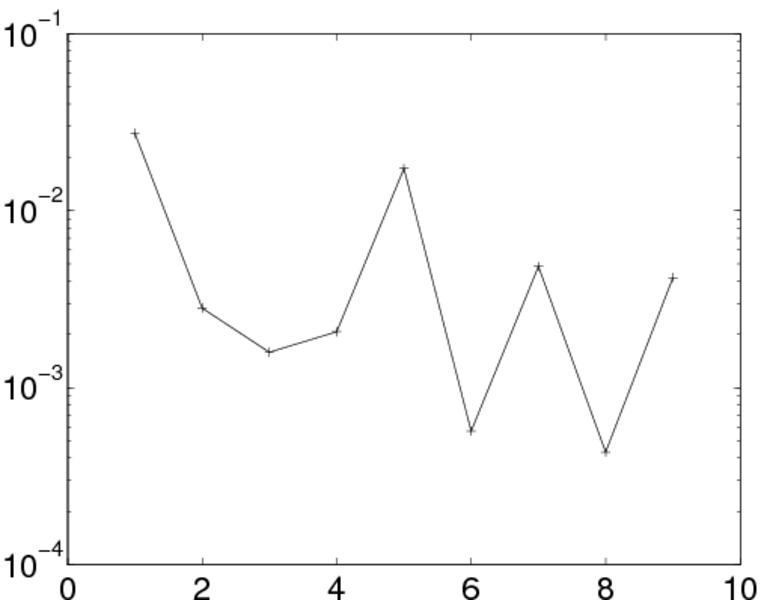
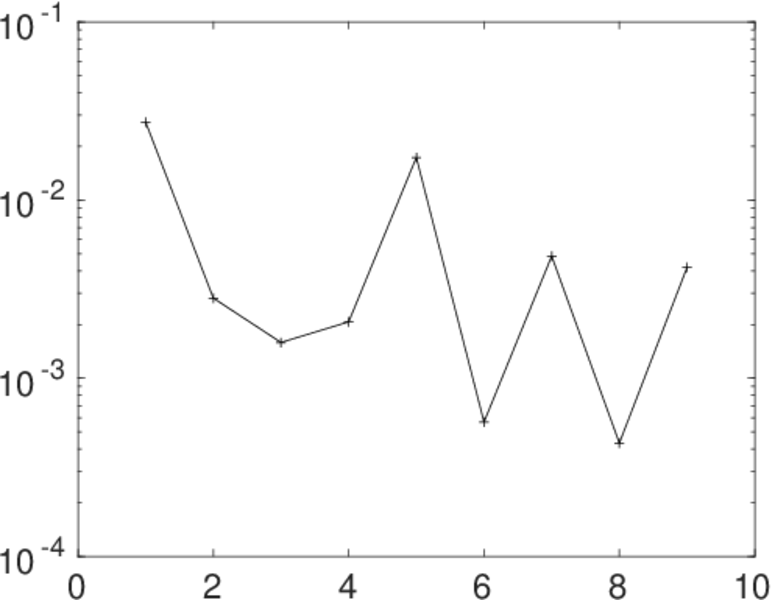
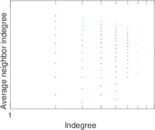
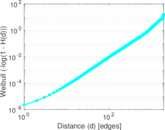
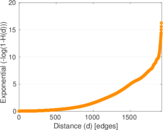
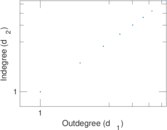
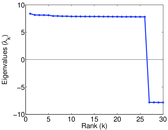
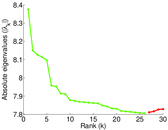
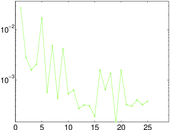
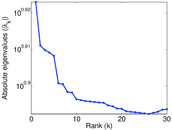
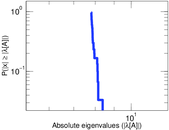
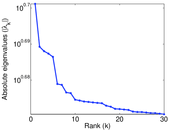
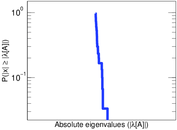
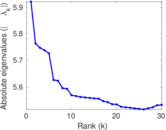
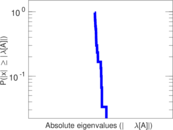
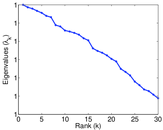
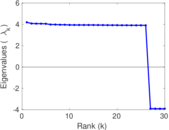
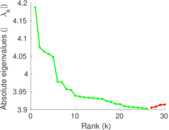
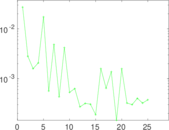
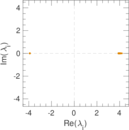
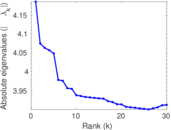
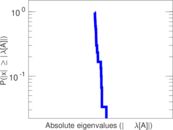
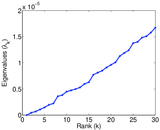
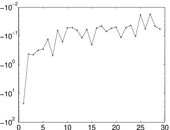
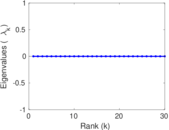
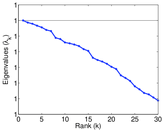
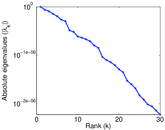
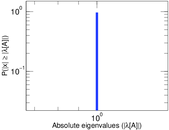
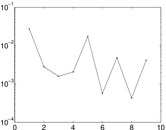
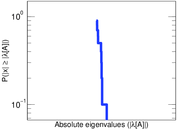
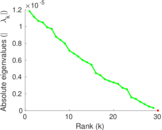
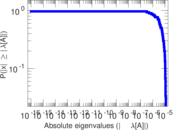
Plots


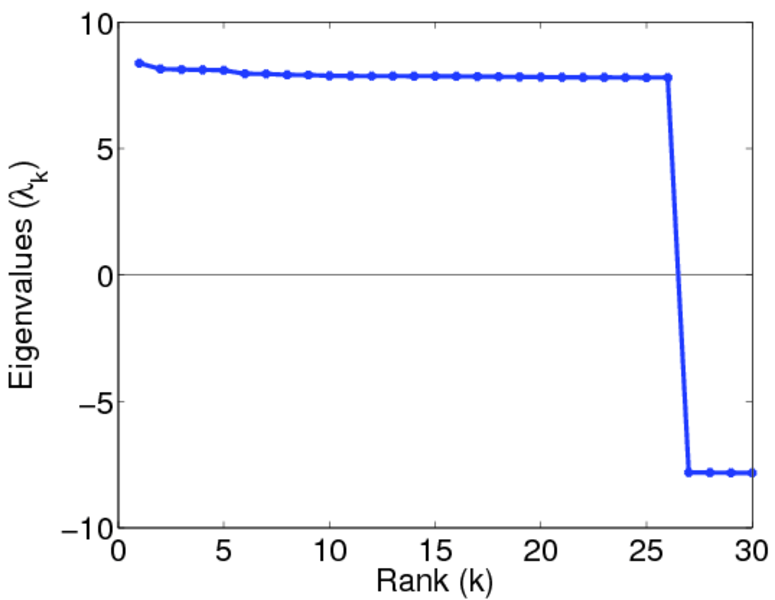
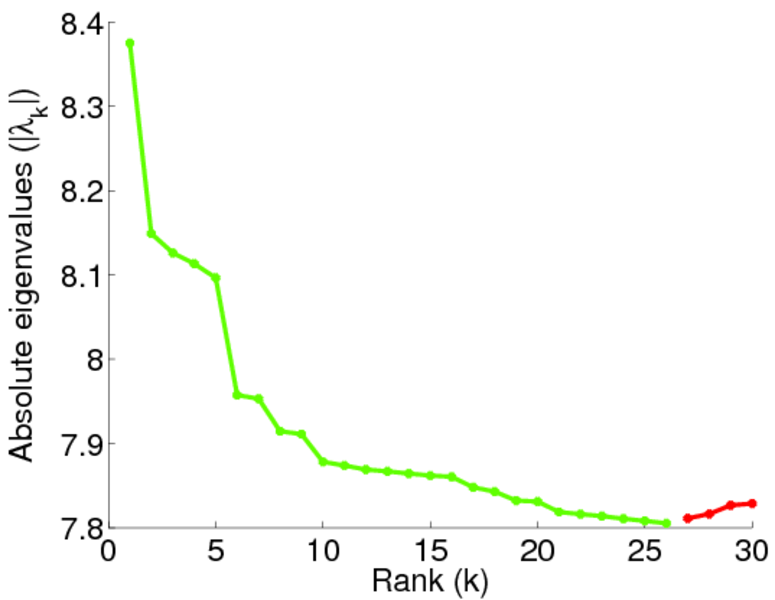
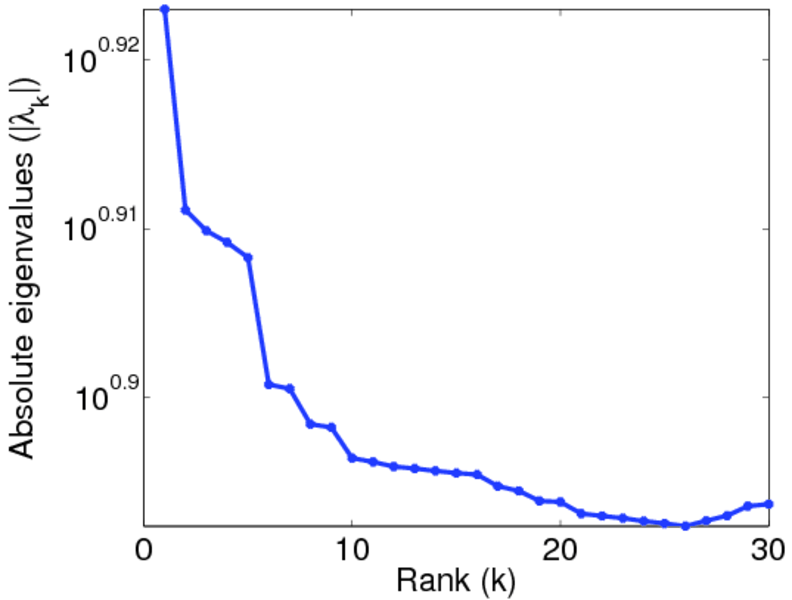
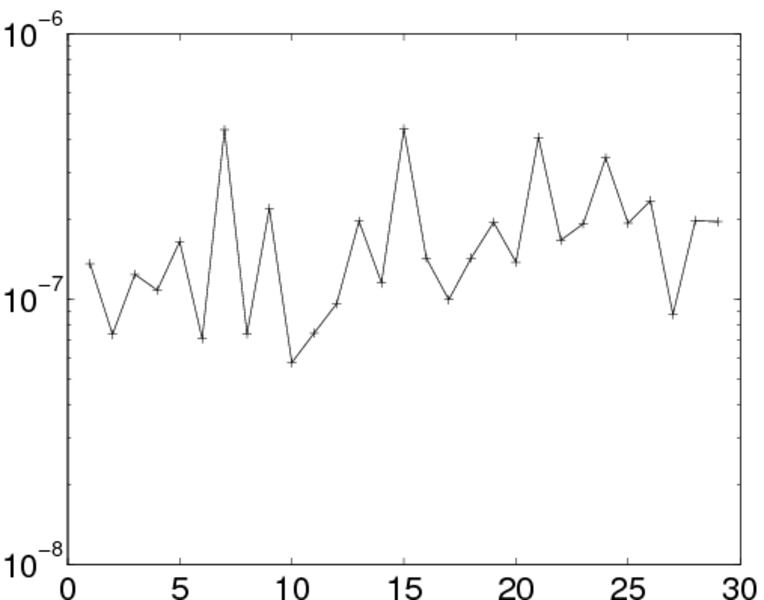
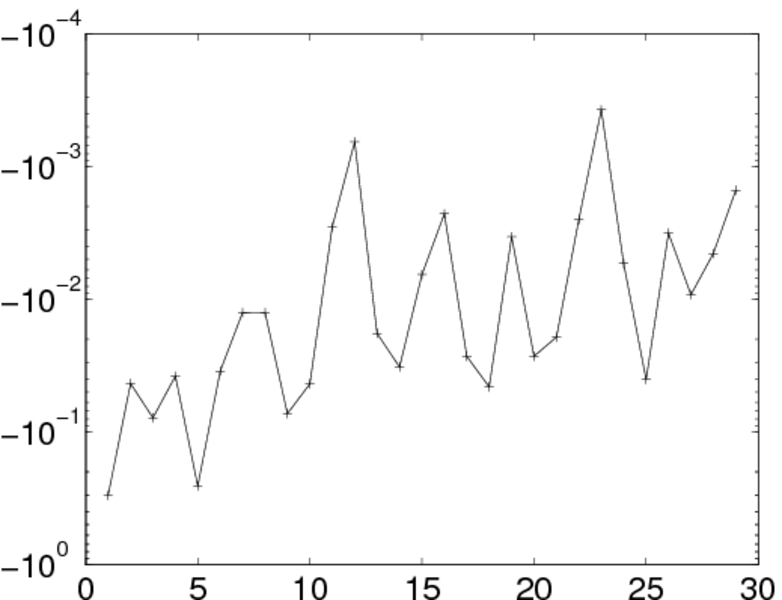
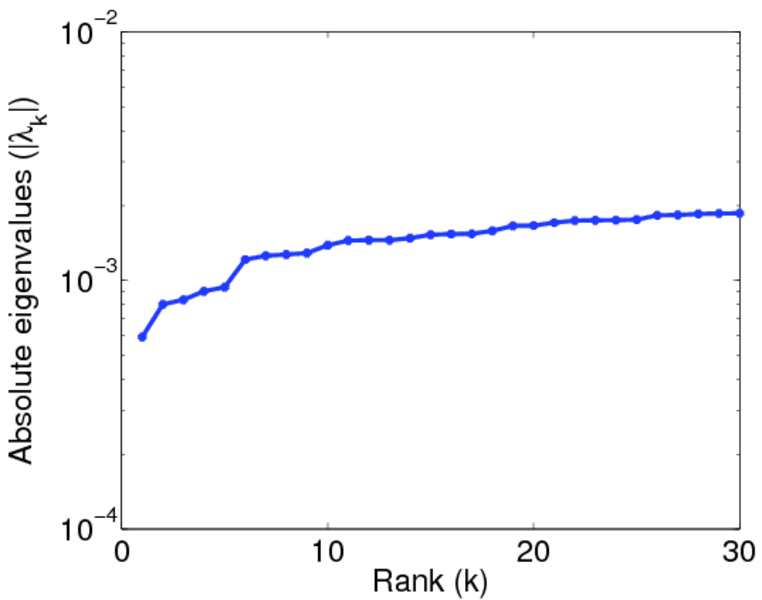
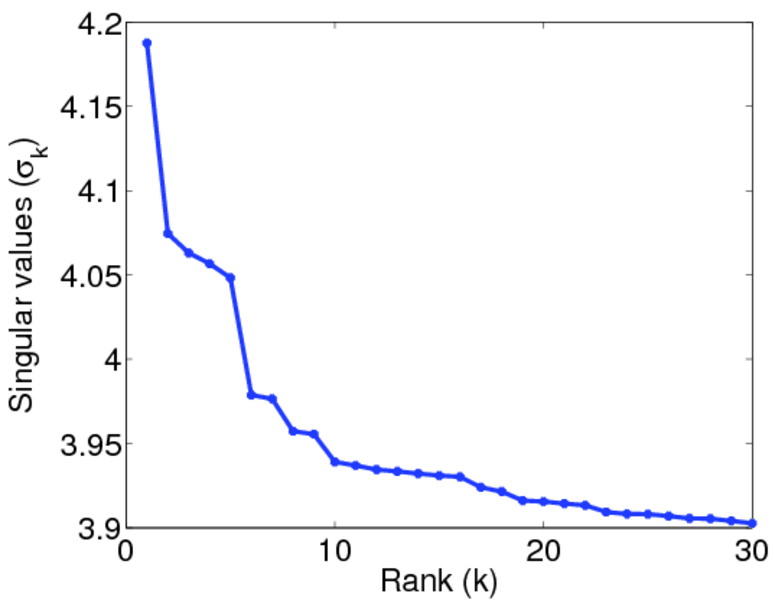
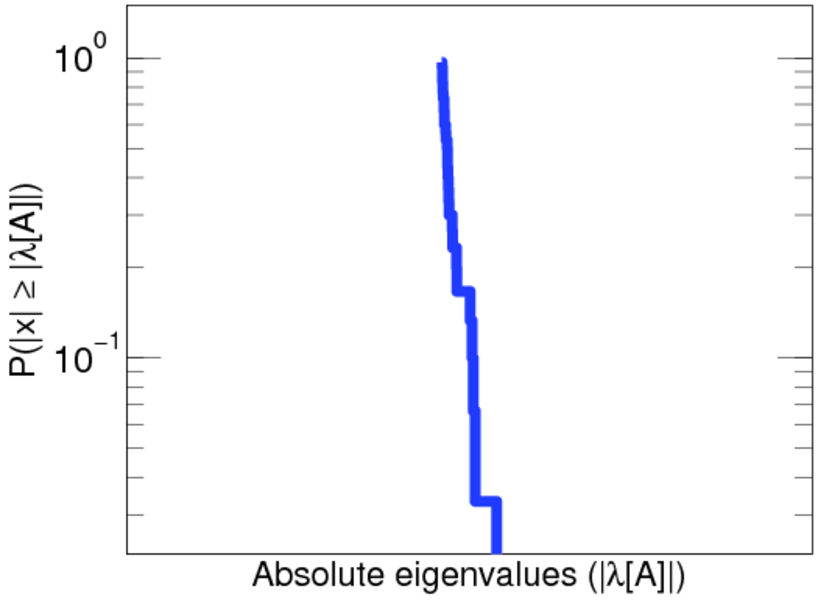
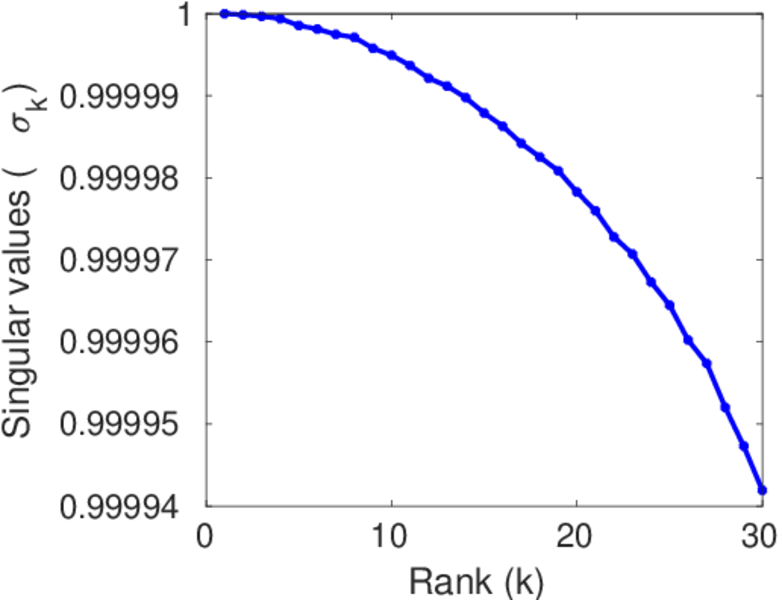
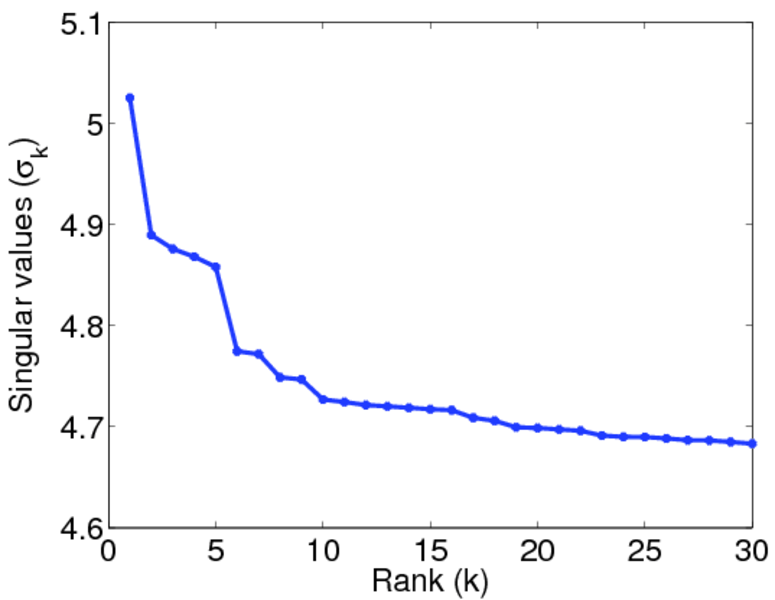
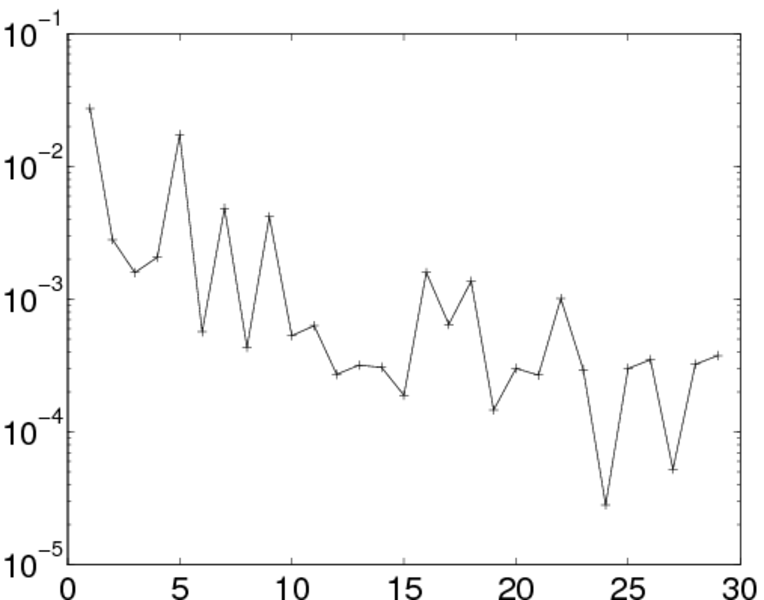
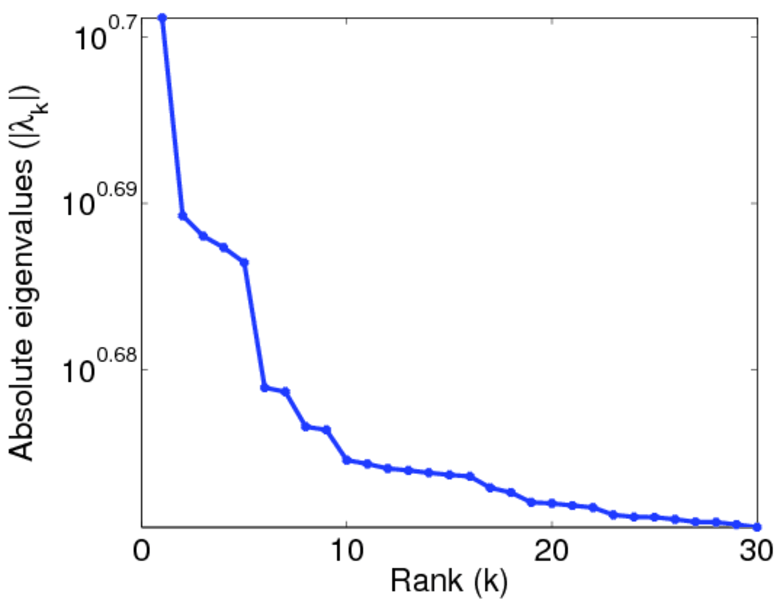
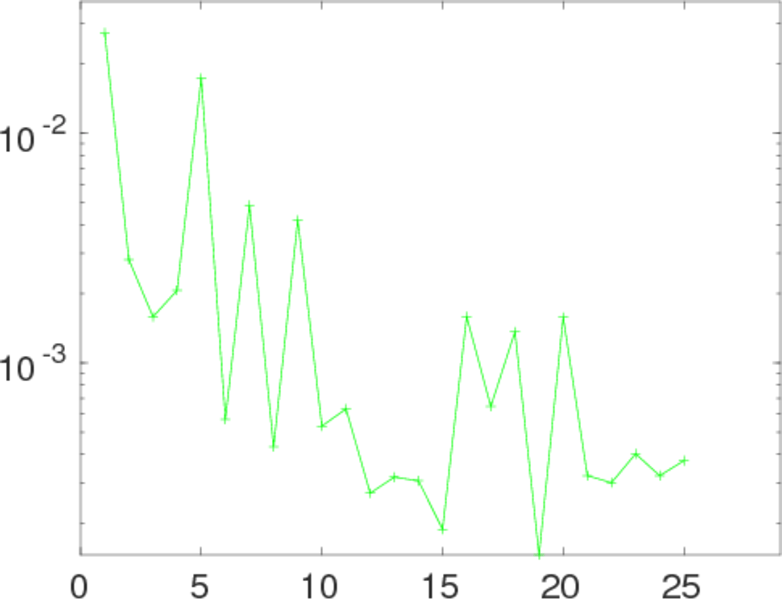
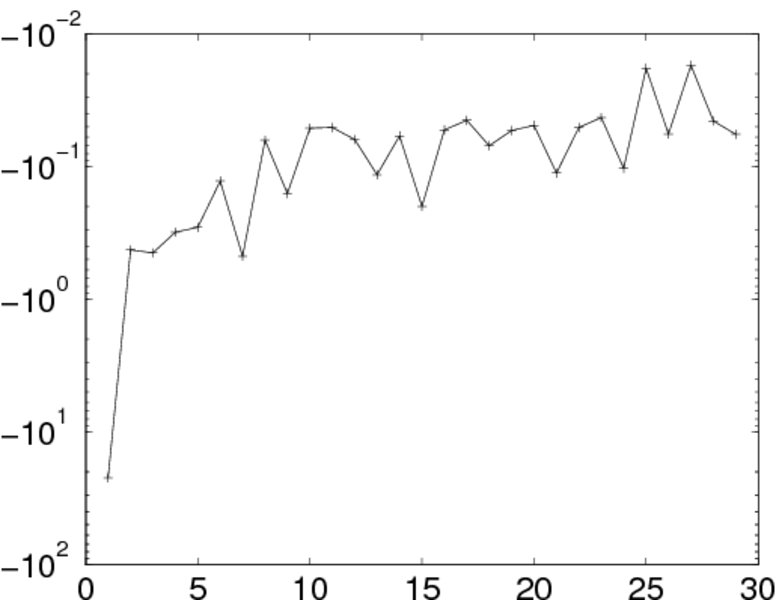
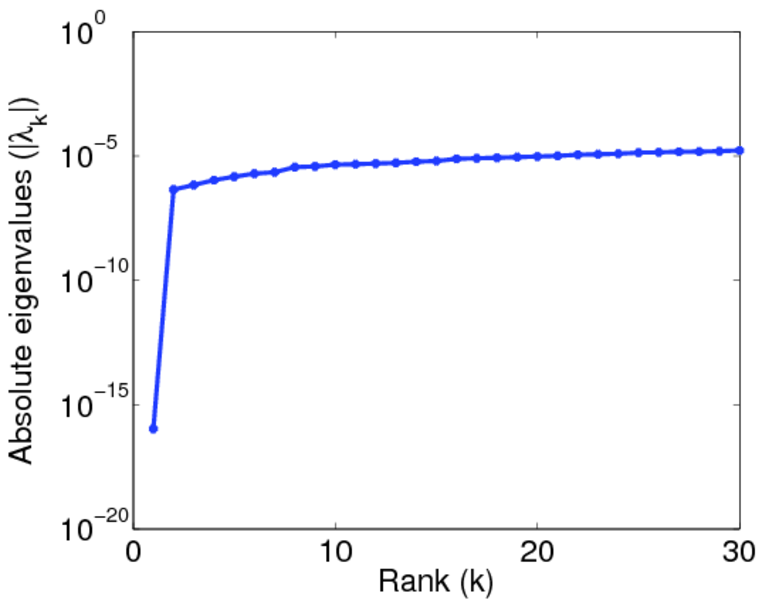
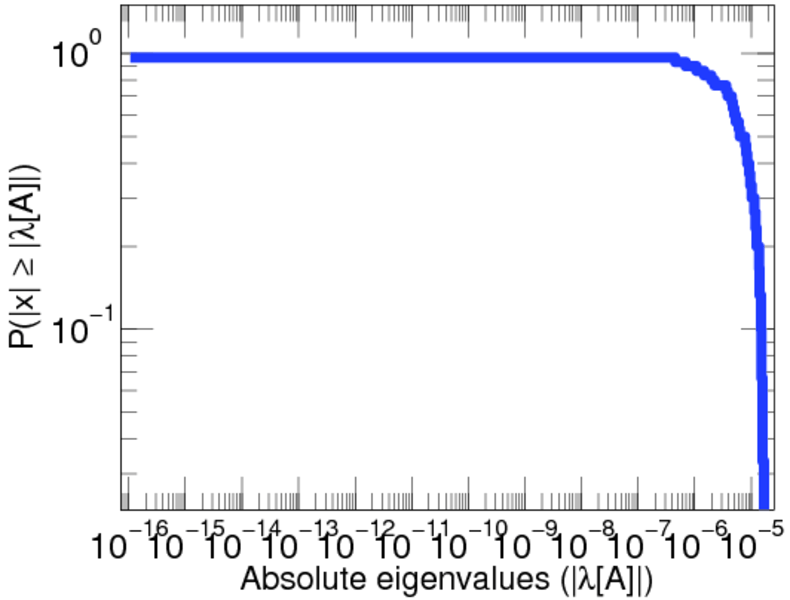
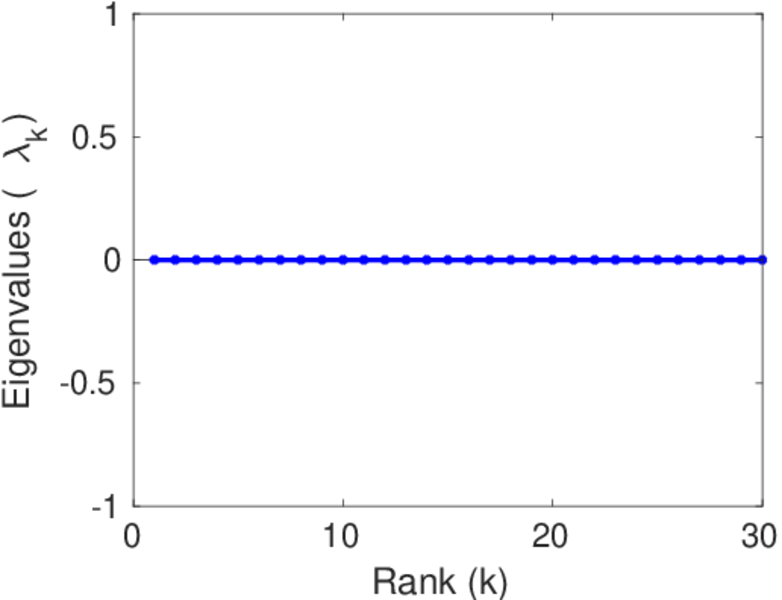
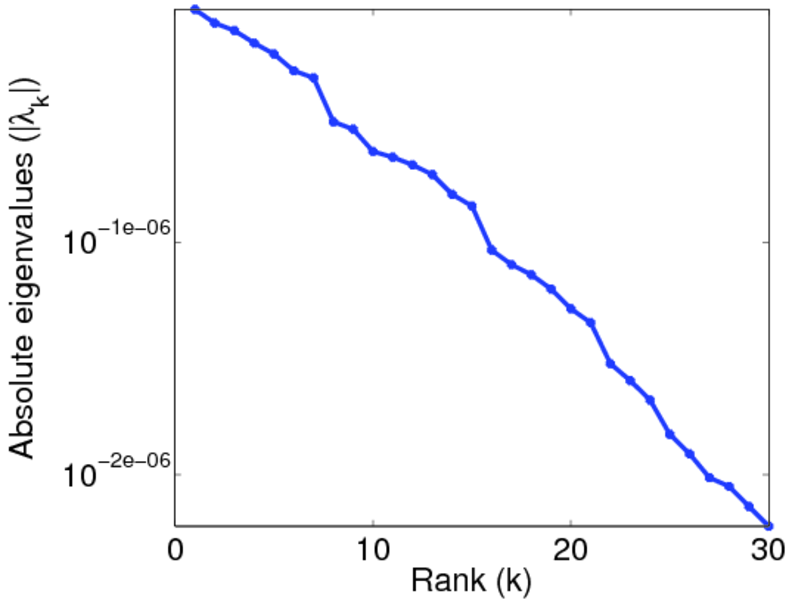
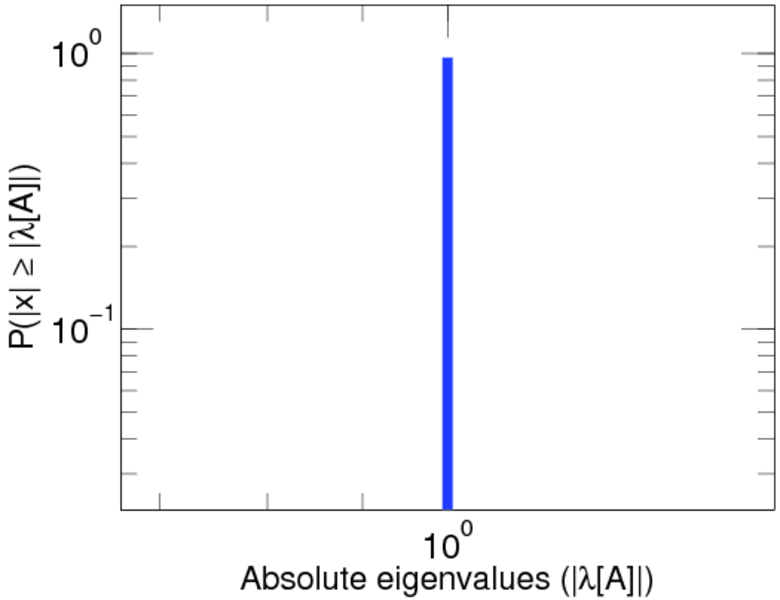
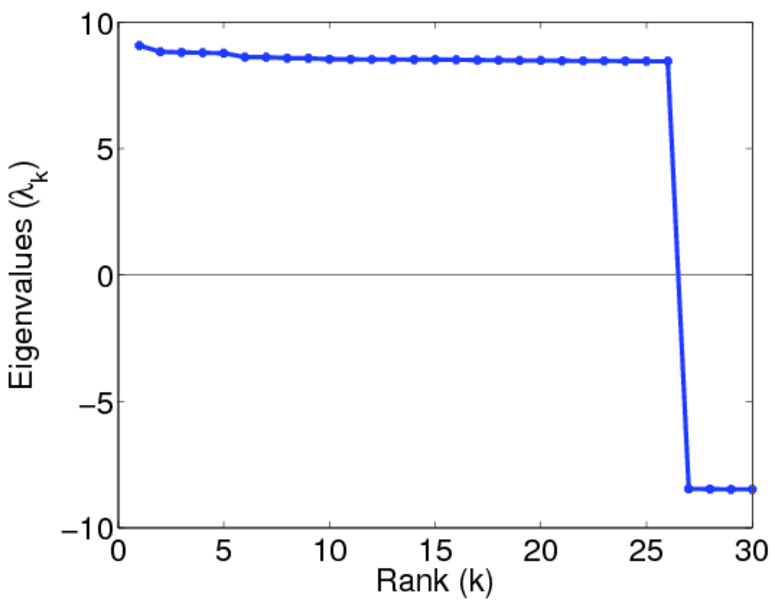
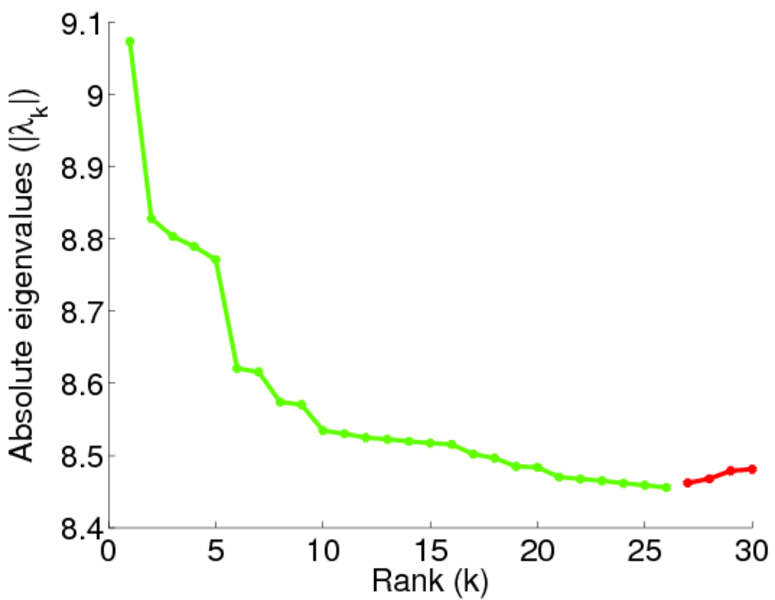
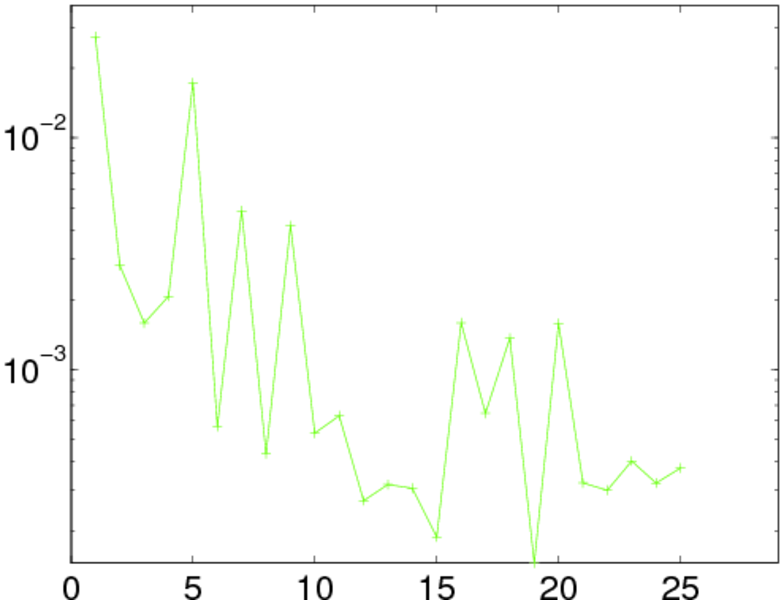
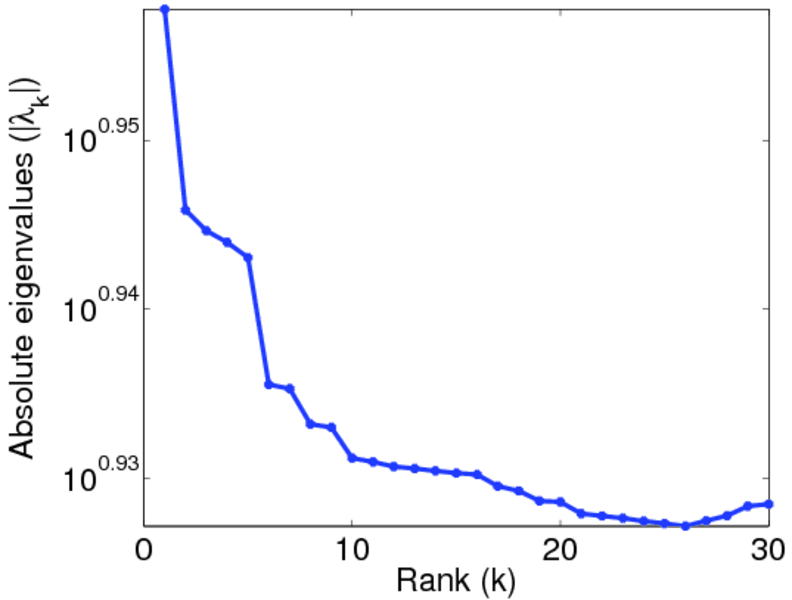
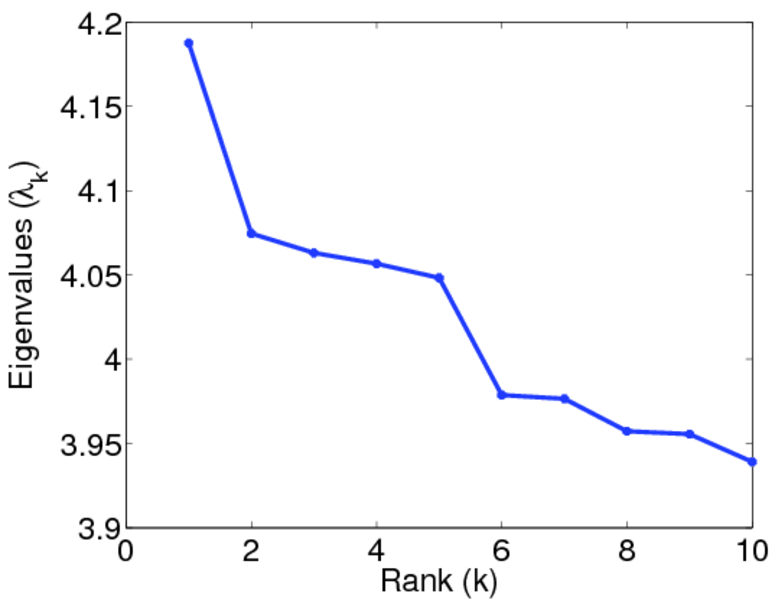
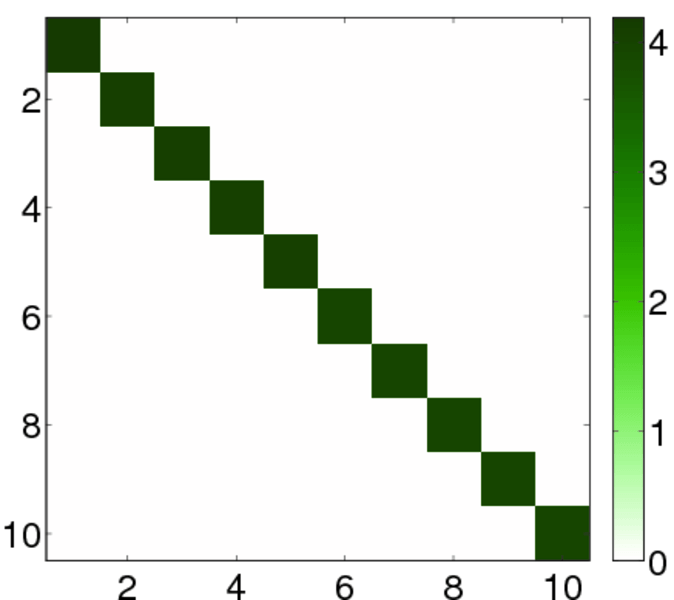
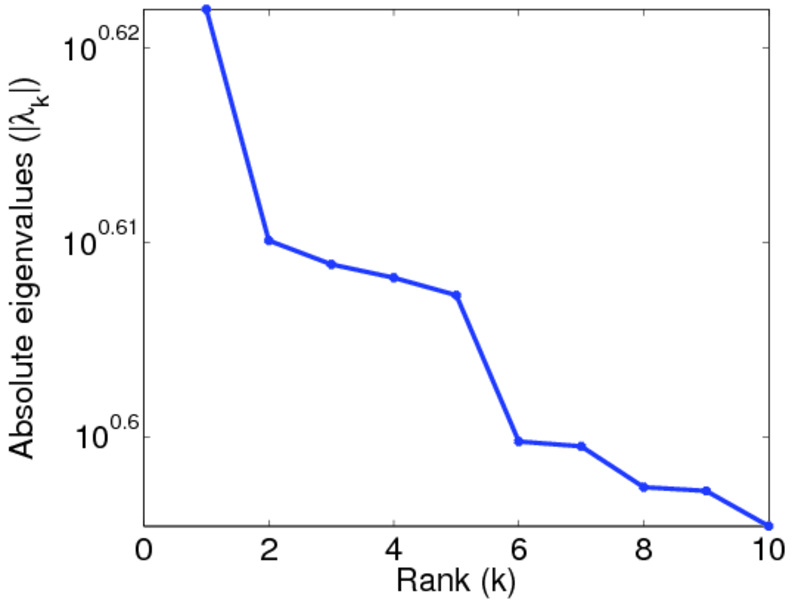
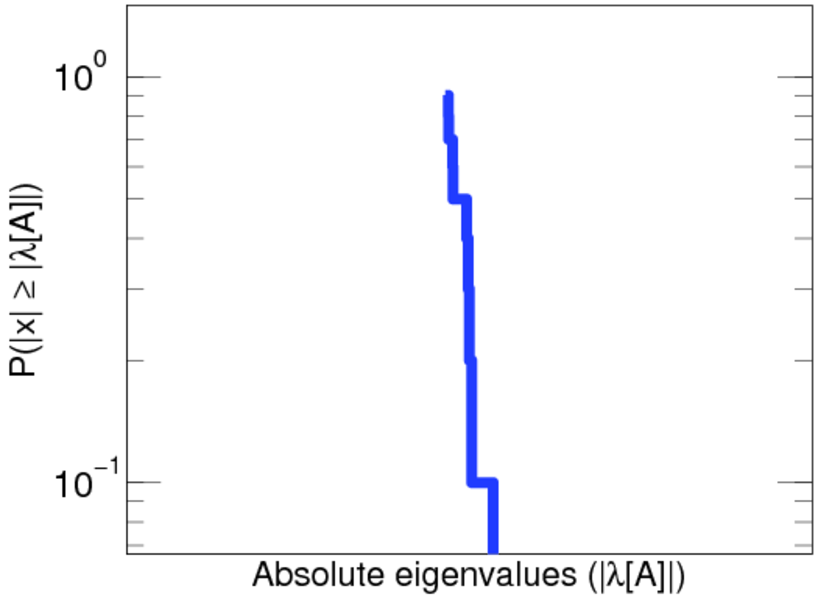
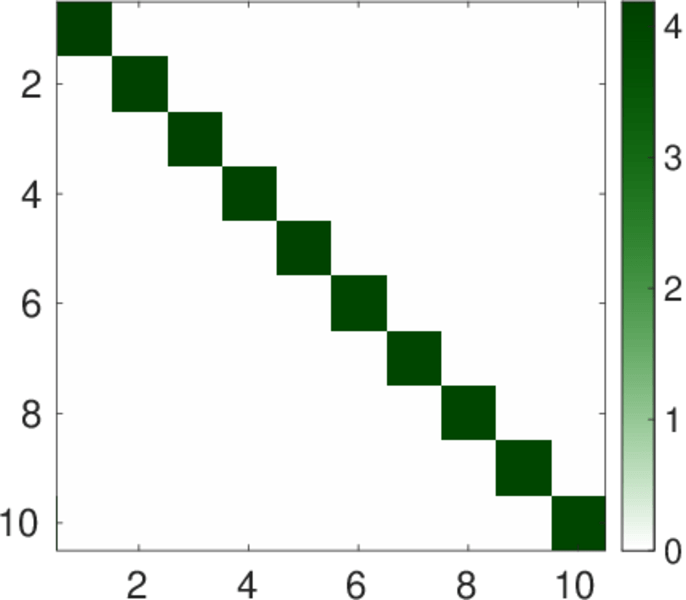
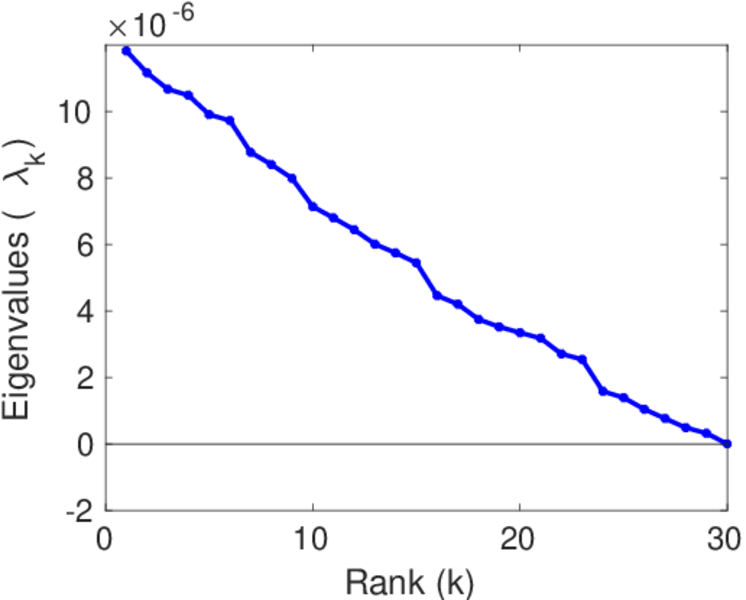
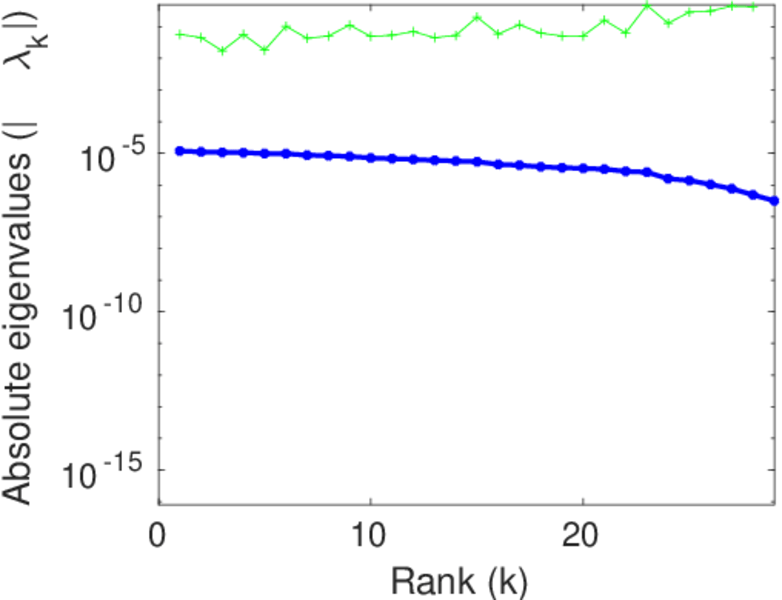
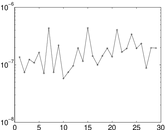
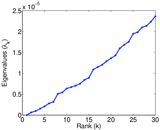
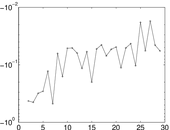
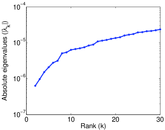
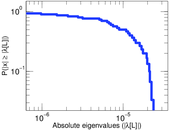
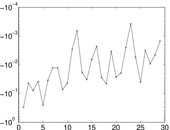
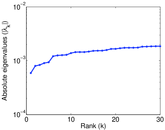
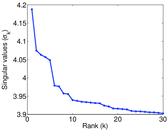
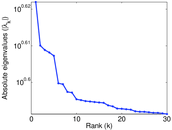
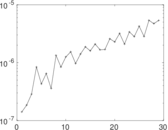
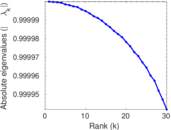
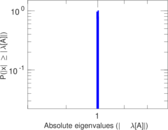
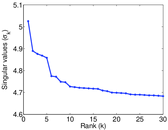
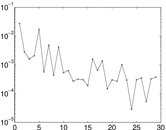
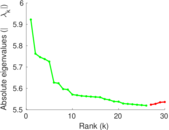
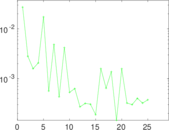
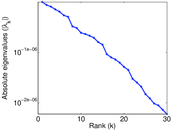
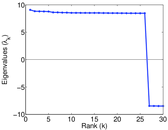
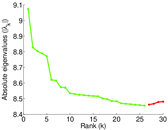
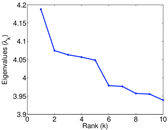
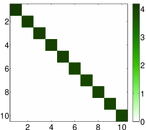
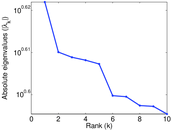
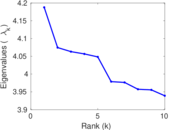
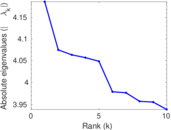
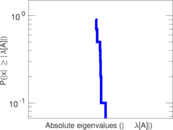
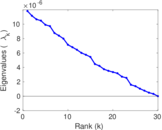
Matrix decompositions plots


Downloads
References
|
[1]
|
Jérôme Kunegis.
KONECT – The Koblenz Network Collection.
In Proc. Int. Conf. on World Wide Web Companion, pages
1343–1350, 2013.
[ http ]
|
 KONECT ‣ Networks ‣
Buy Me a Coffee
KONECT ‣ Networks ‣
Buy Me a Coffee