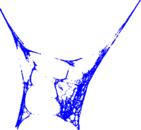
New York City
This is the directed road network from the 9th DIMACS Implementation Challenge,
for the area "New York City".
Metadata
Statistics
| Size | n = | 264,346
|
| Volume | m = | 730,100
|
| Loop count | l = | 0
|
| Wedge count | s = | 769,738
|
| Claw count | z = | 6,016,896
|
| Cross count | x = | 6,221,822
|
| Triangle count | t = | 6,529
|
| Square count | q = | 44,950
|
| 4-Tour count | T4 = | 4,168,652
|
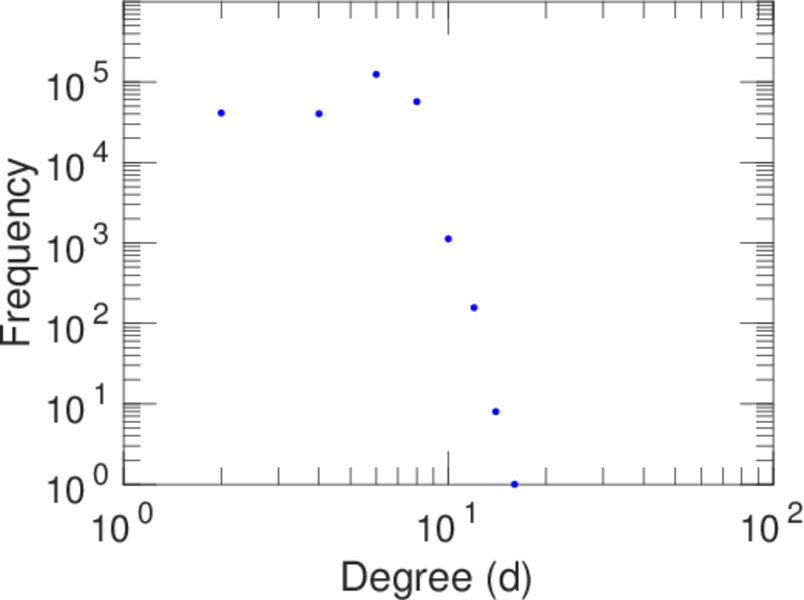
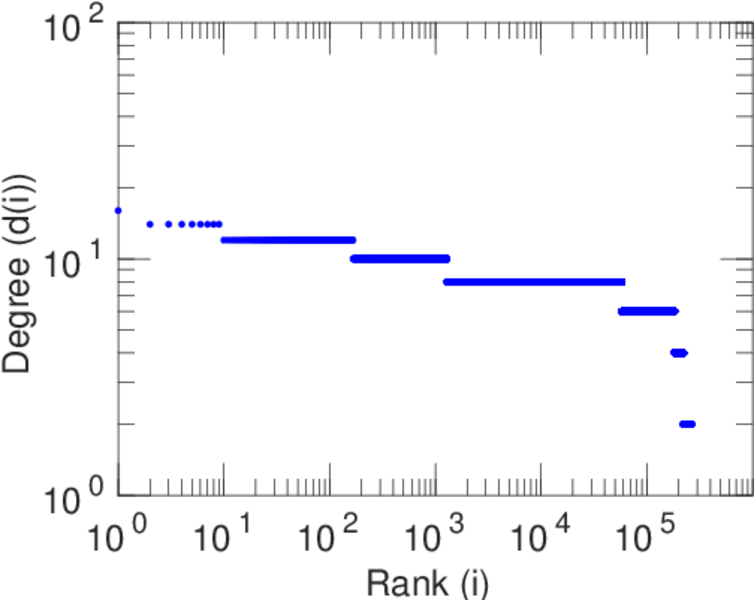
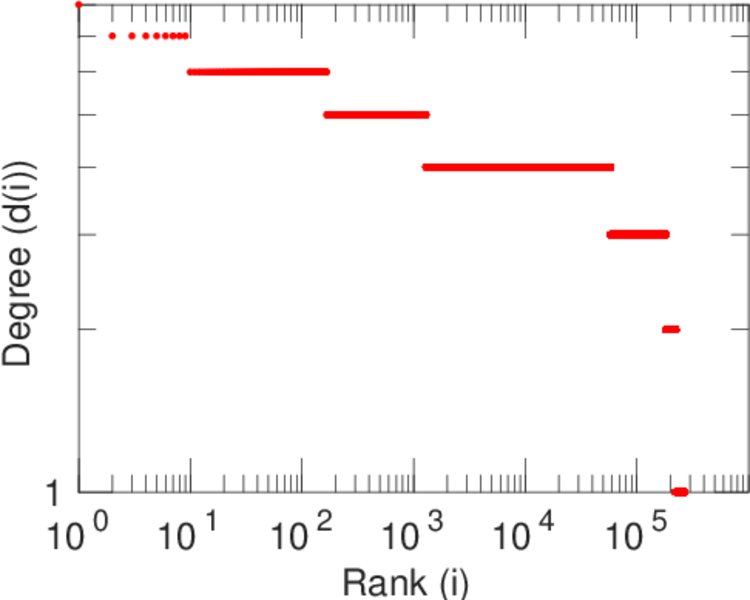
| Maximum degree | dmax = | 16
|
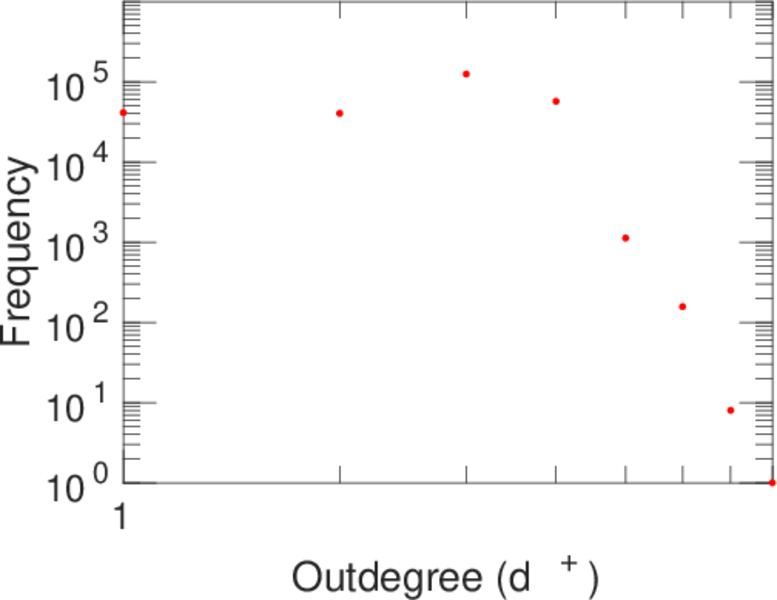
| Maximum outdegree | d+max = | 8
|
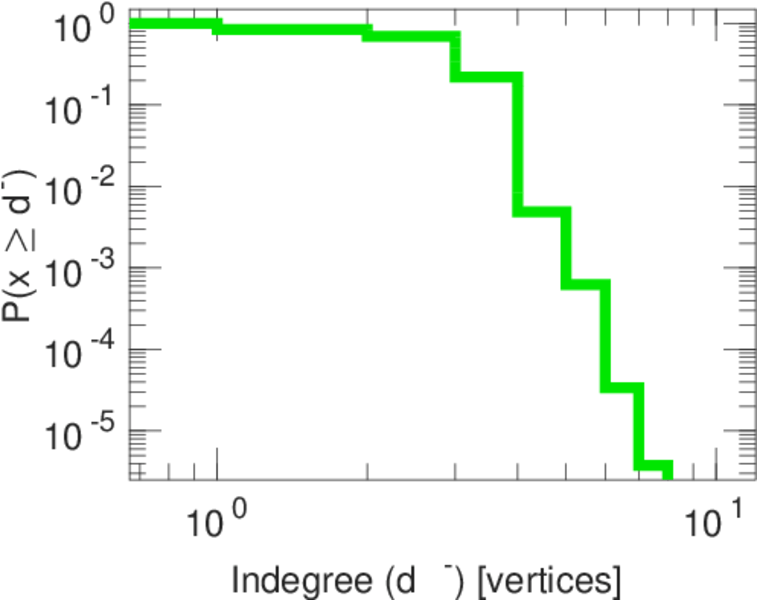
| Maximum indegree | d−max = | 8
|
| Average degree | d = | 5.523 82
|
| Fill | p = | 1.044 81 × 10−5
|
| Size of LCC | N = | 264,346
|
| Size of LSCC | Ns = | 264,346
|
| Relative size of LSCC | Nrs = | 1.000 00
|
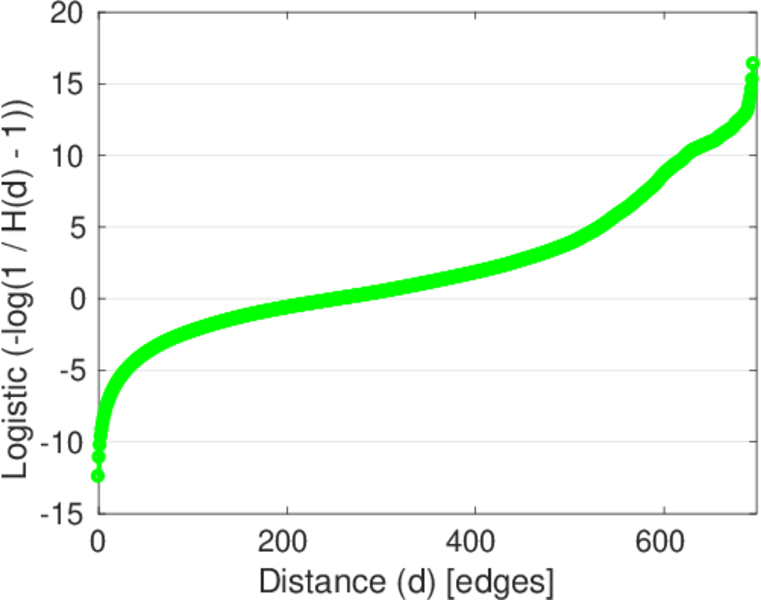
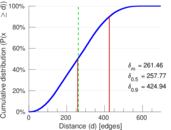
| Diameter | δ = | 720
|
| 50-Percentile effective diameter | δ0.5 = | 257.770
|
| 90-Percentile effective diameter | δ0.9 = | 424.937
|
| Median distance | δM = | 258
|
| Mean distance | δm = | 261.456
|
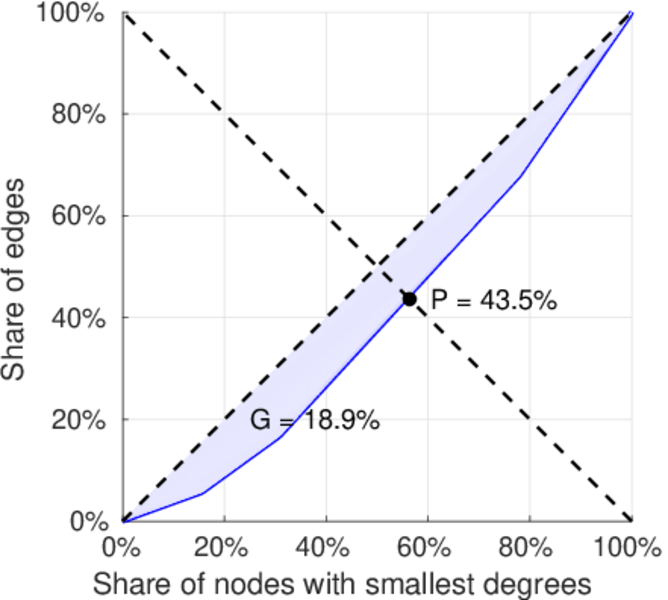
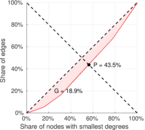
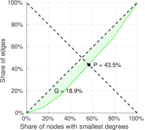
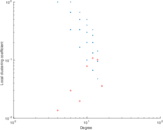
| Gini coefficient | G = | 0.189 062
|
| Balanced inequality ratio | P = | 0.434 795
|
| Outdegree balanced inequality ratio | P+ = | 0.434 795
|
| Indegree balanced inequality ratio | P− = | 0.434 795
|
| Relative edge distribution entropy | Her = | 0.994 341
|
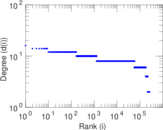
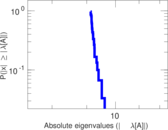
| Power law exponent | γ = | 2.074 97
|
| Tail power law exponent | γt = | 8.991 00
|
| Tail power law exponent with p | γ3 = | 8.991 00
|
| p-value | p = | 0.000 00
|
| Outdegree tail power law exponent with p | γ3,o = | 8.991 00
|
| Outdegree p-value | po = | 0.000 00
|
| Indegree tail power law exponent with p | γ3,i = | 8.991 00
|
| Indegree p-value | pi = | 0.000 00
|
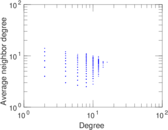
| Degree assortativity | ρ = | +0.178 503
|
| Degree assortativity p-value | pρ = | 0.000 00
|
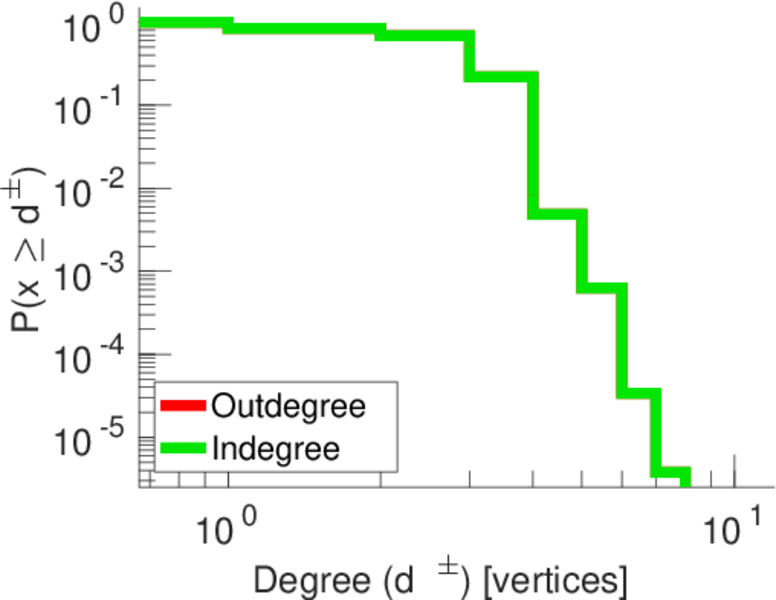
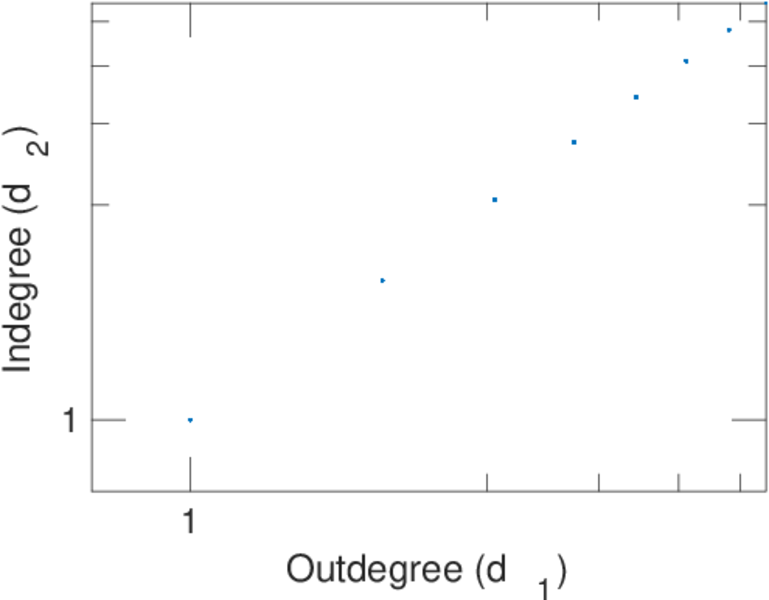
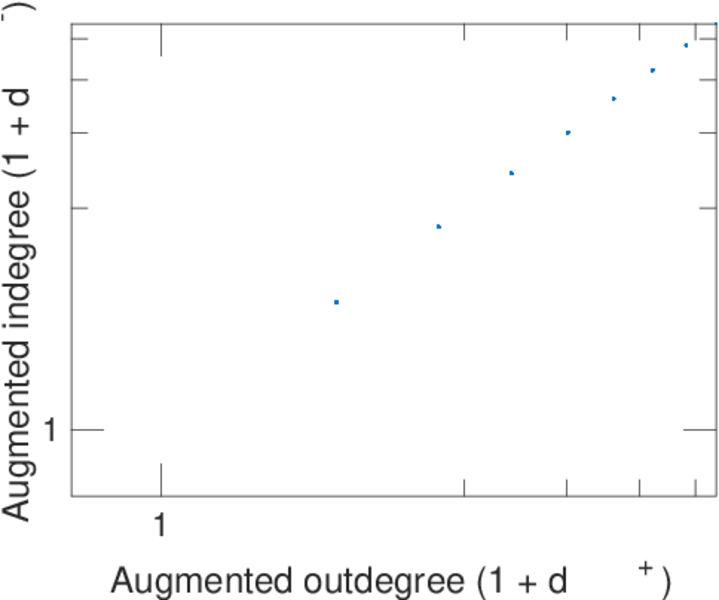
| In/outdegree correlation | ρ± = | +1.000 00
|
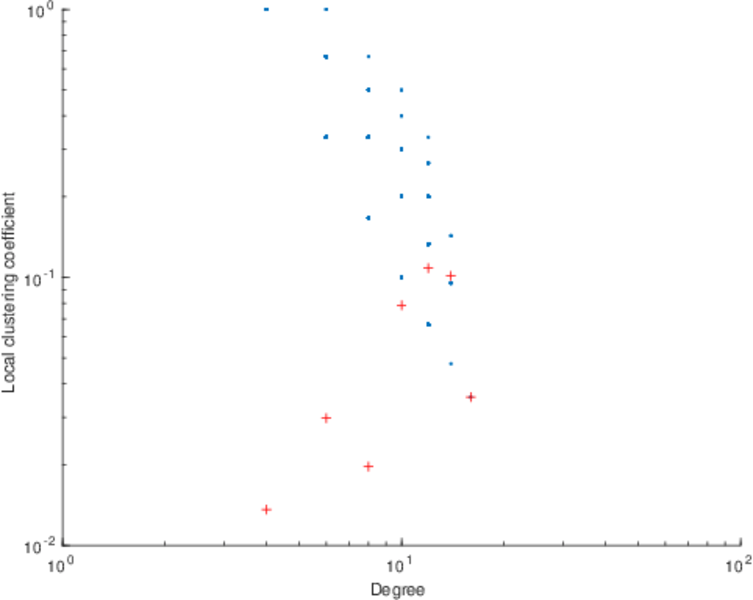
| Clustering coefficient | c = | 0.025 446 3
|
| Directed clustering coefficient | c± = | 0.025 446 3
|
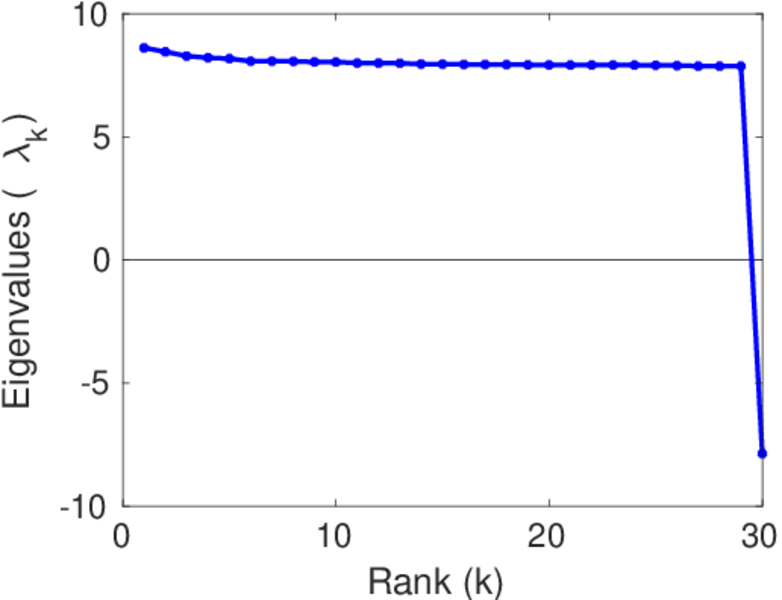
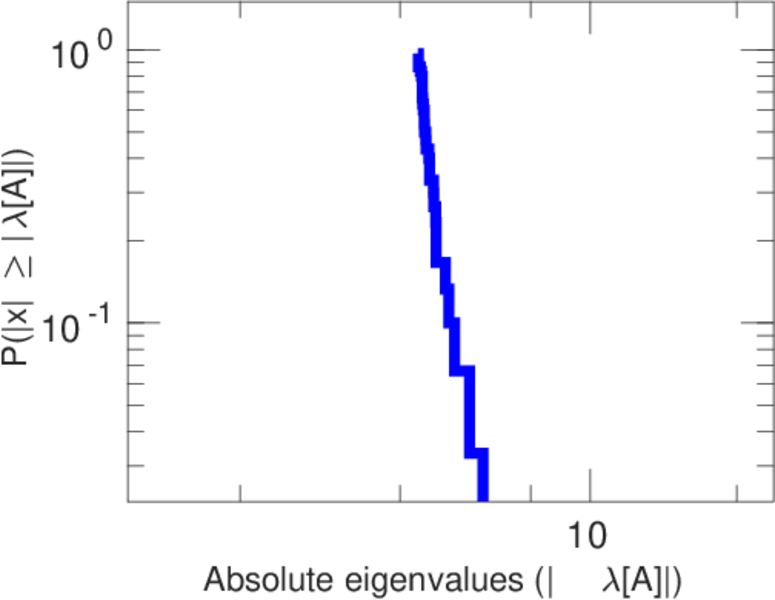
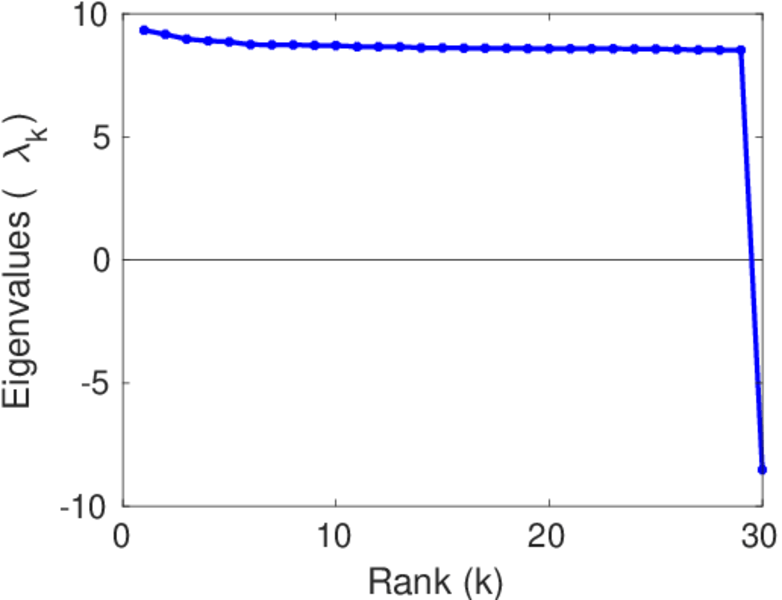
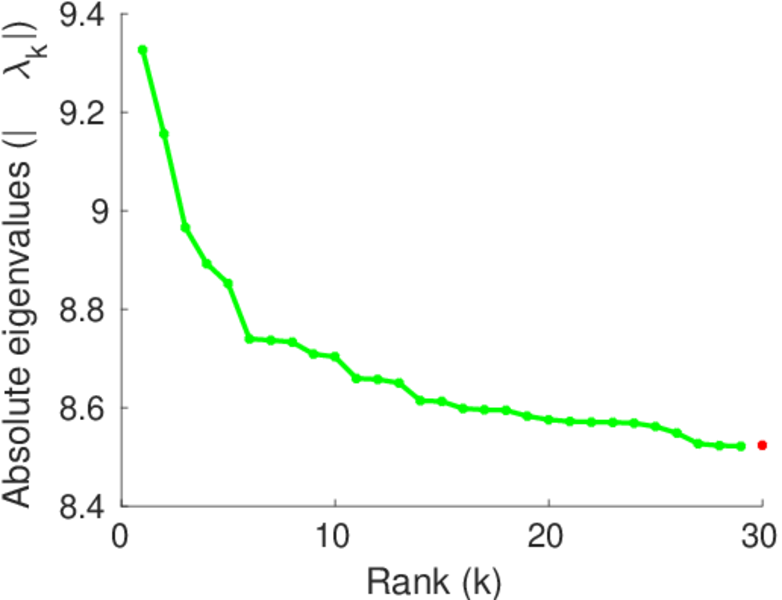
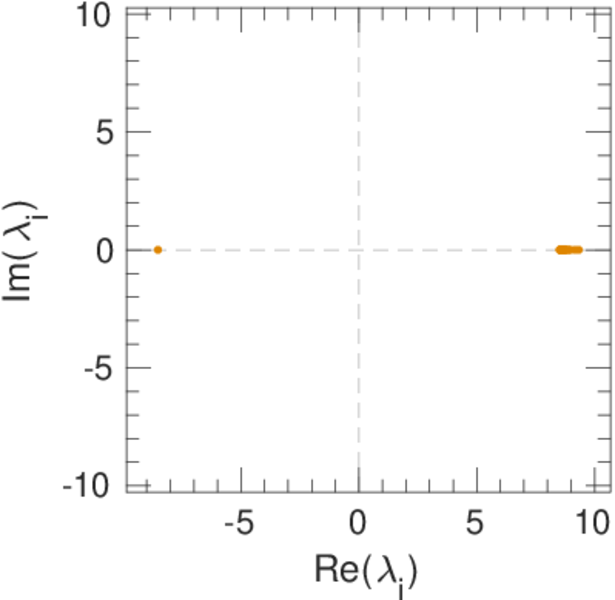
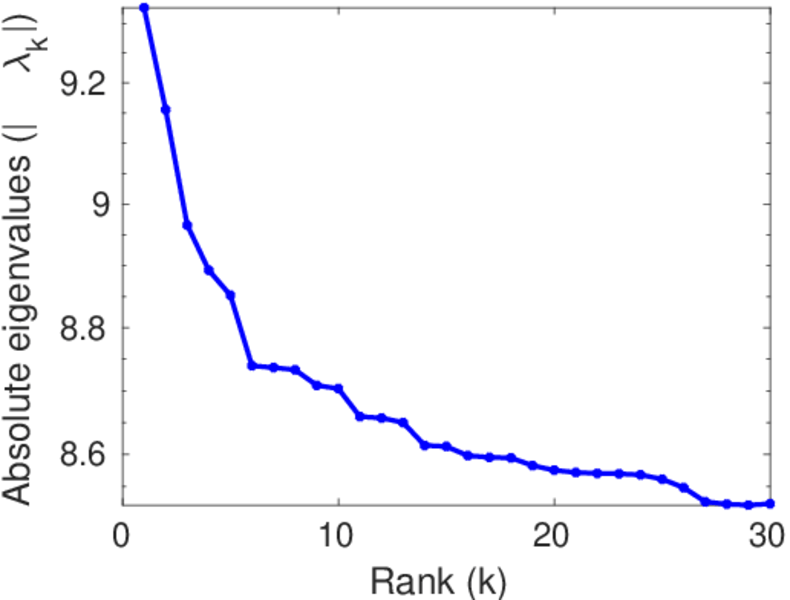
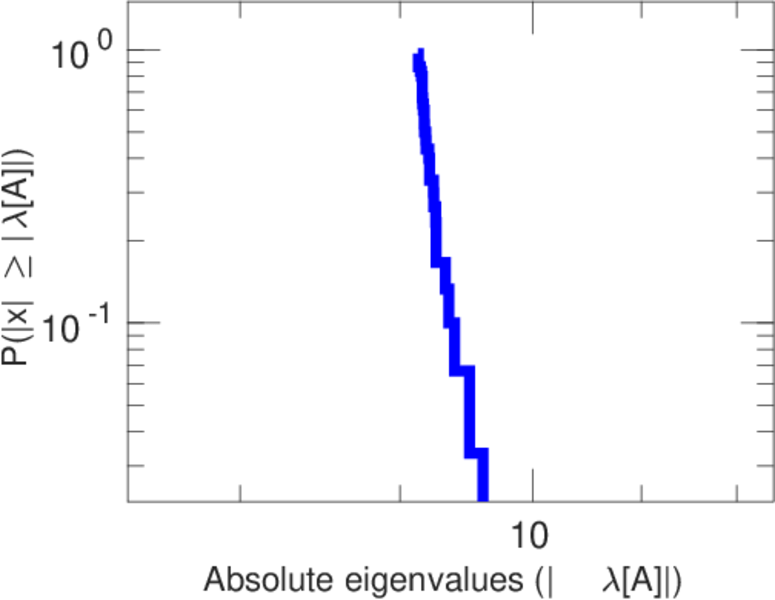
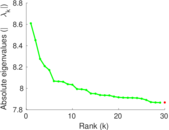
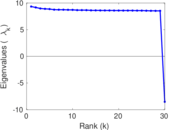
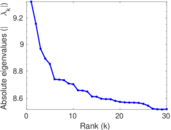
| Spectral norm | α = | 8.609 12
|
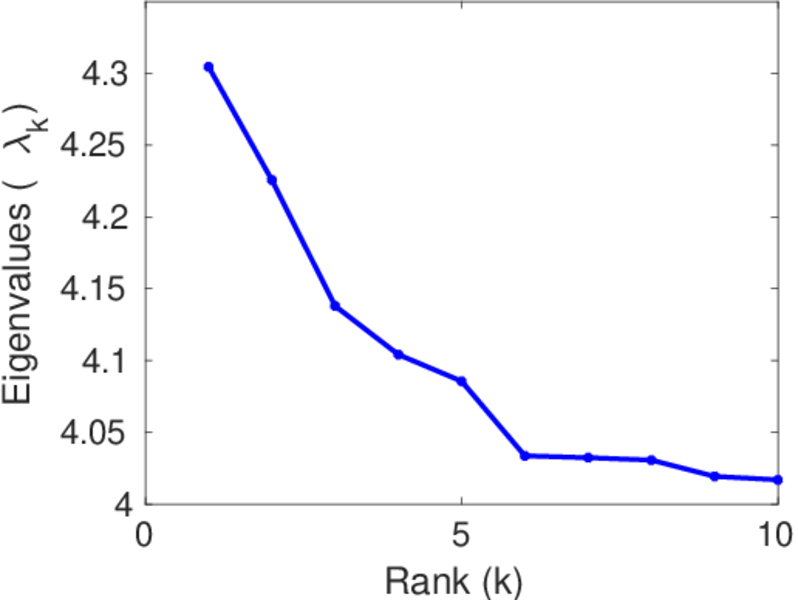
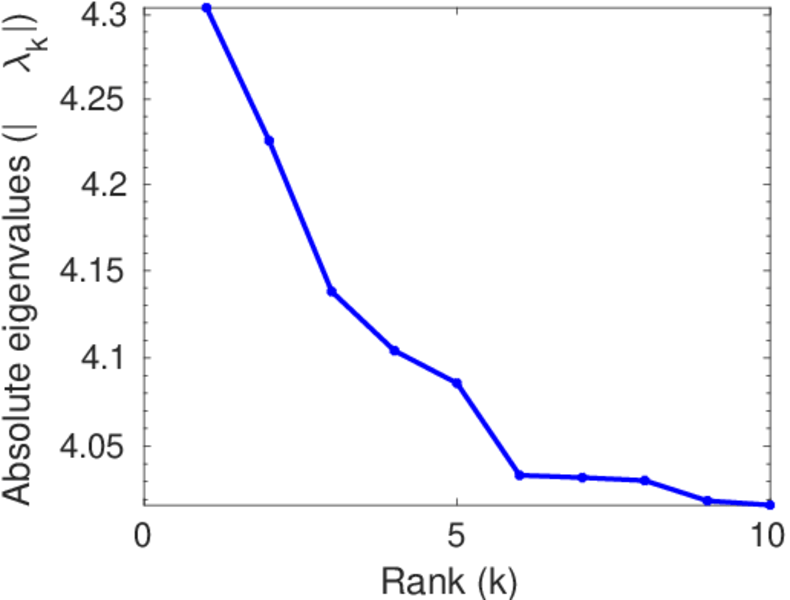
| Operator 2-norm | ν = | 4.304 56
|
| Cyclic eigenvalue | π = | 4.304 56
|
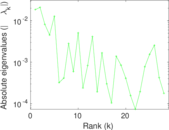
| Algebraic connectivity | a = | 6.328 77 × 10−6
|
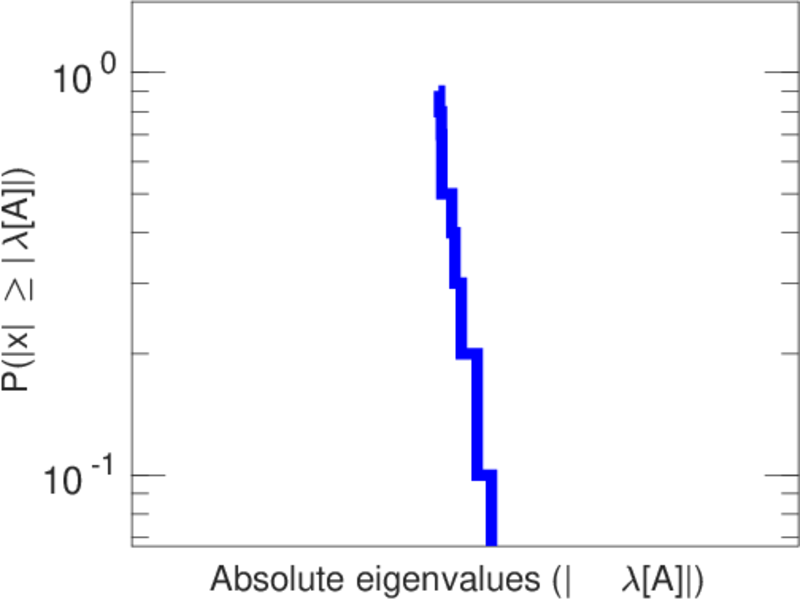
| Spectral separation | |λ1[A] / λ2[A]| = | 1.018 67
|
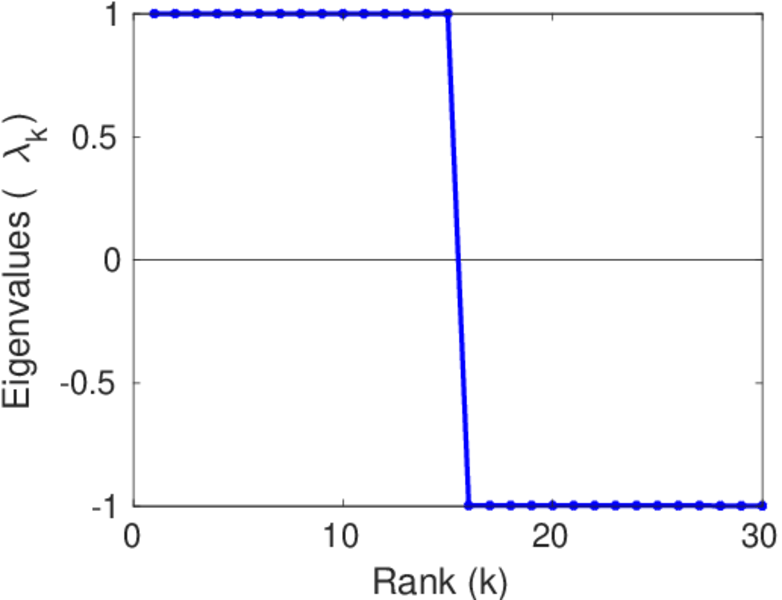
| Reciprocity | y = | 1.000 00
|
| Non-bipartivity | bA = | 0.086 135 1
|
| Normalized non-bipartivity | bN = | 0.000 780 111
|
| Algebraic non-bipartivity | χ = | 0.001 561 37
|
| Spectral bipartite frustration | bK = | 0.000 141 331
|
| Controllability | C = | 24,080
|
| Relative controllability | Cr = | 0.091 092 7
|
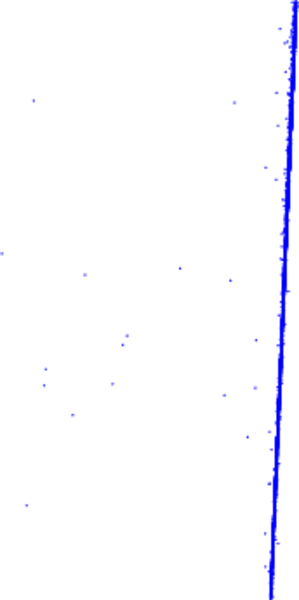
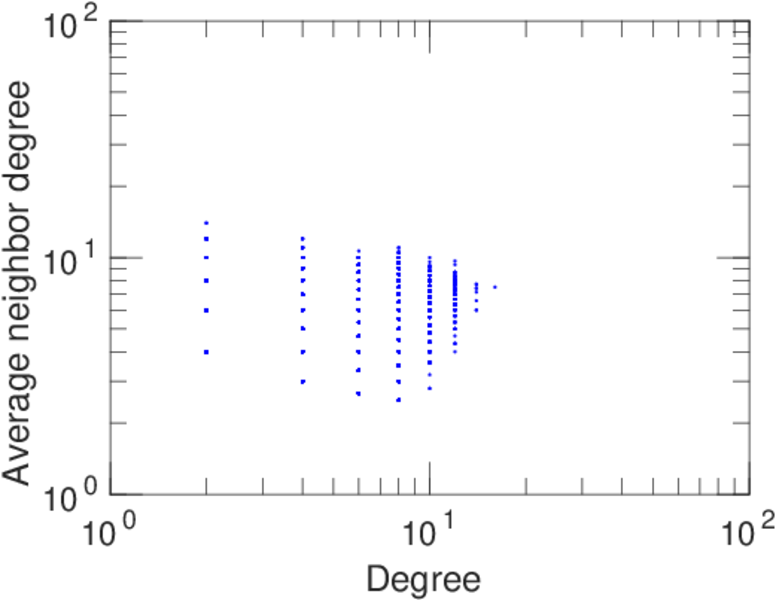
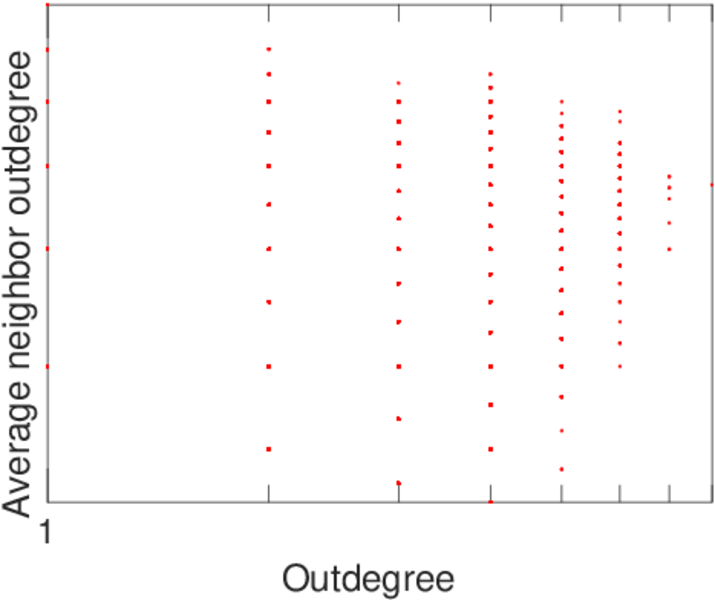
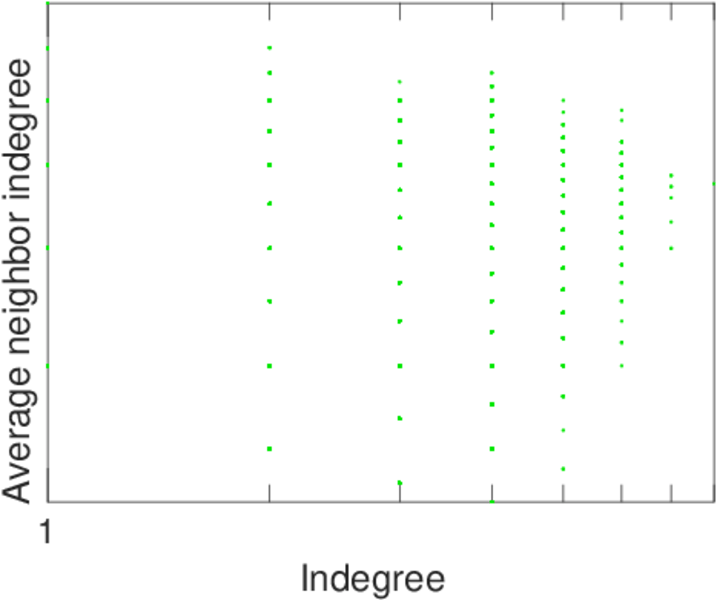
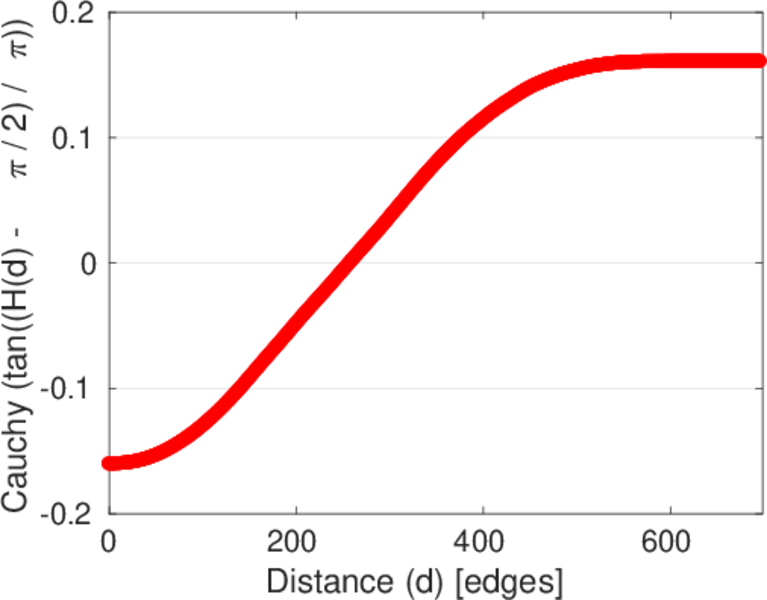
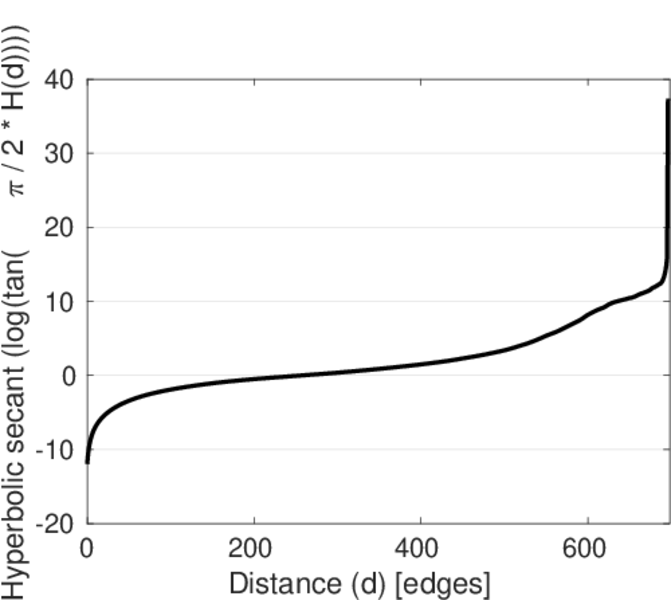
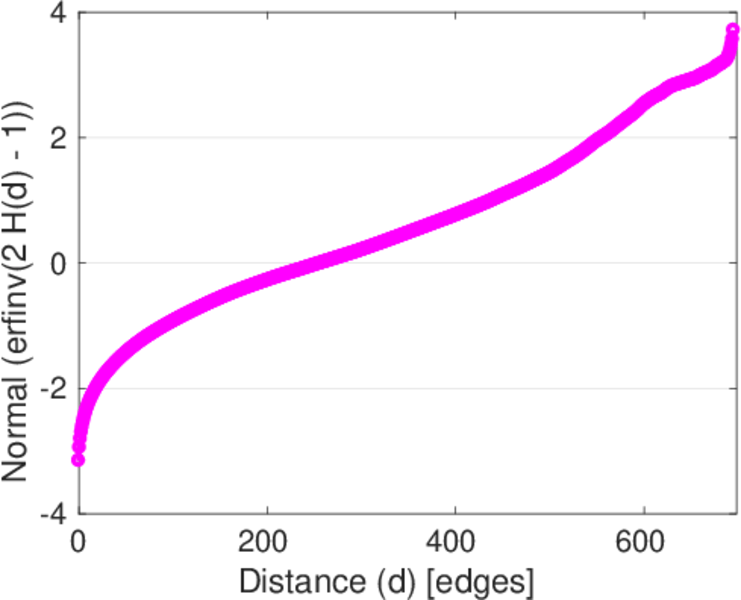
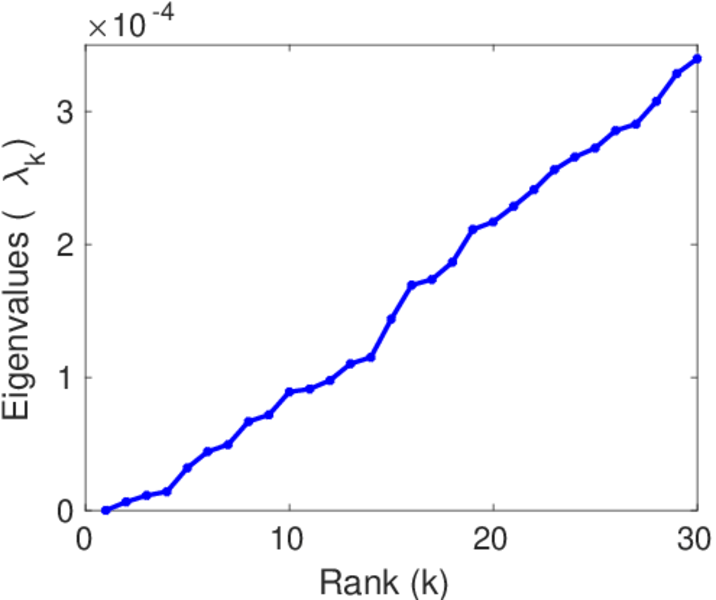
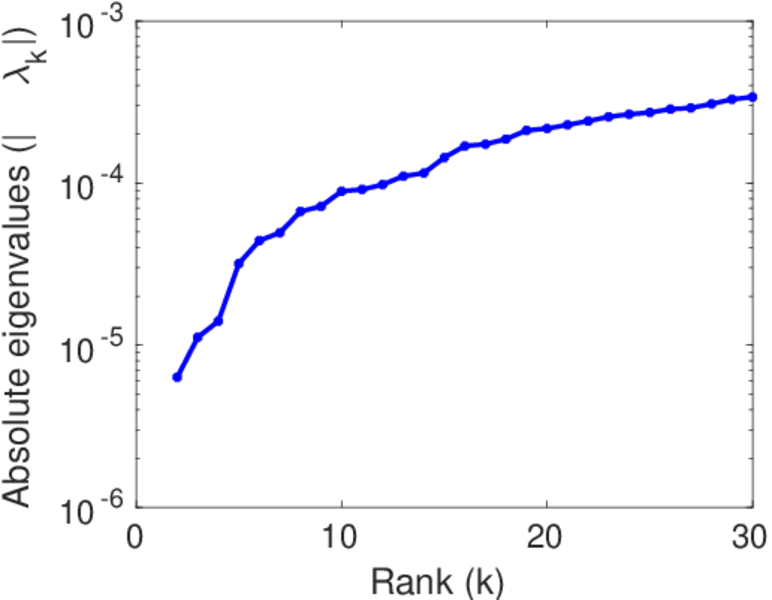
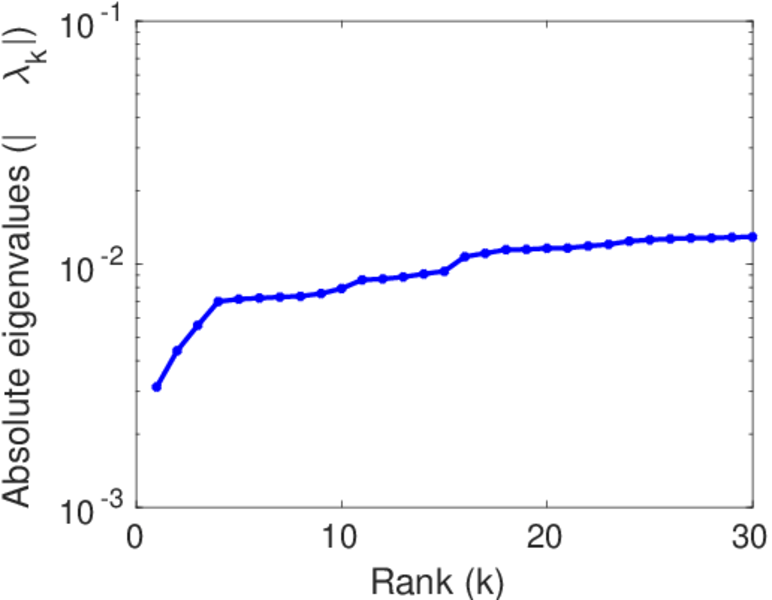
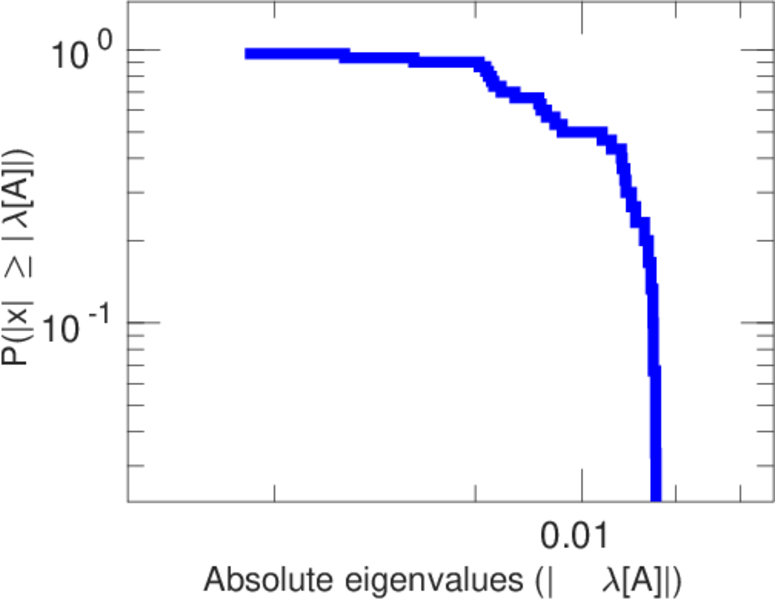
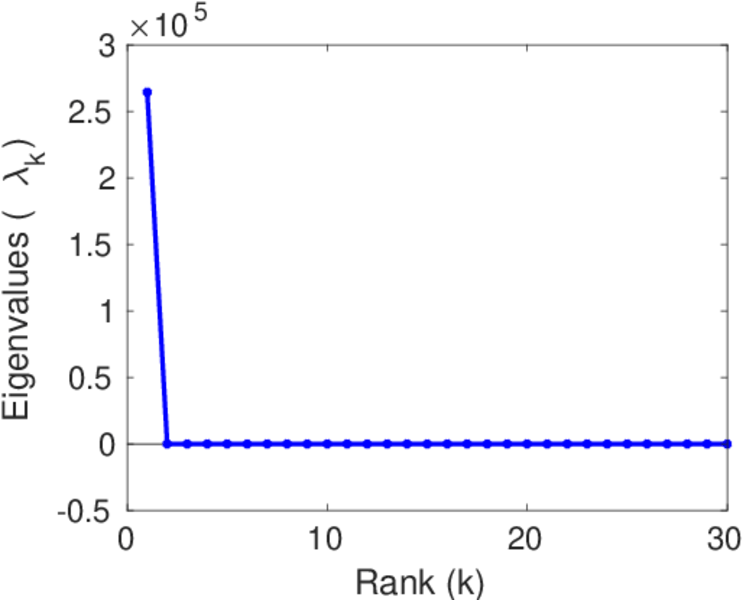
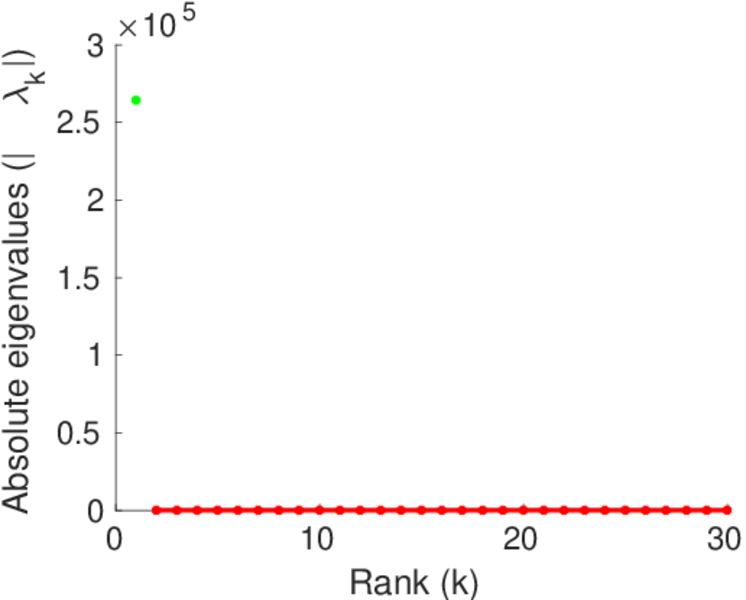
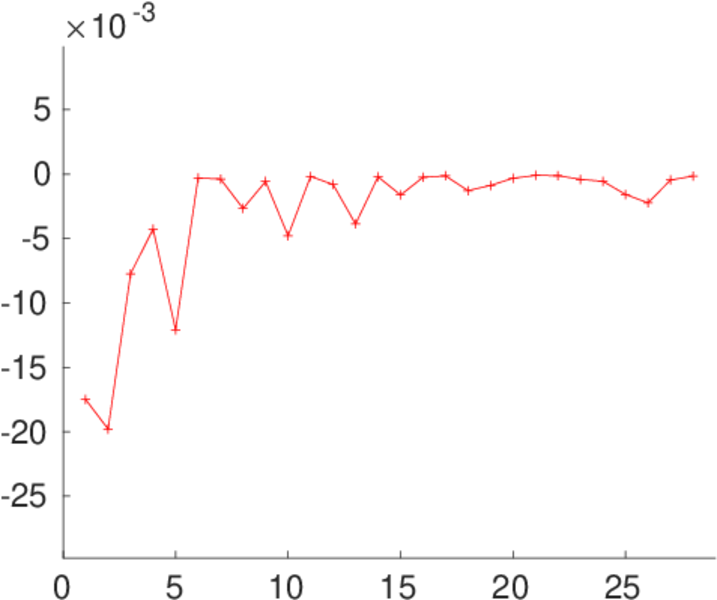
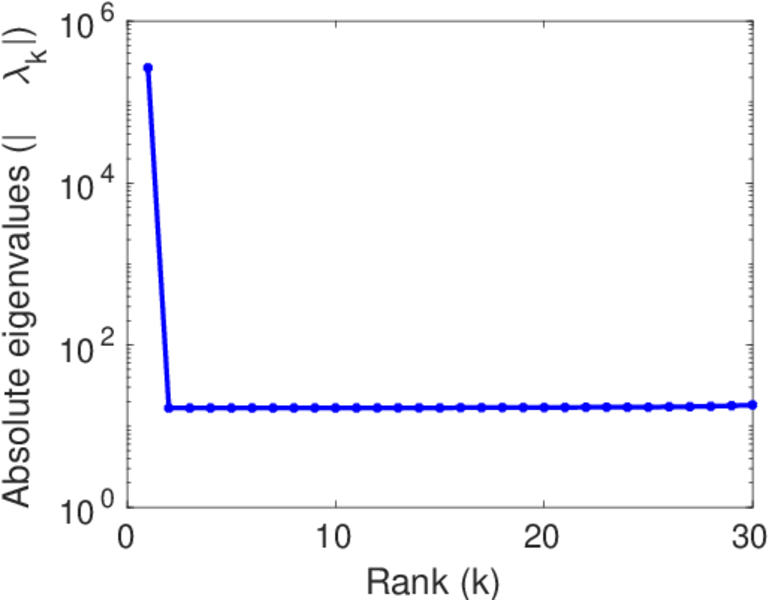
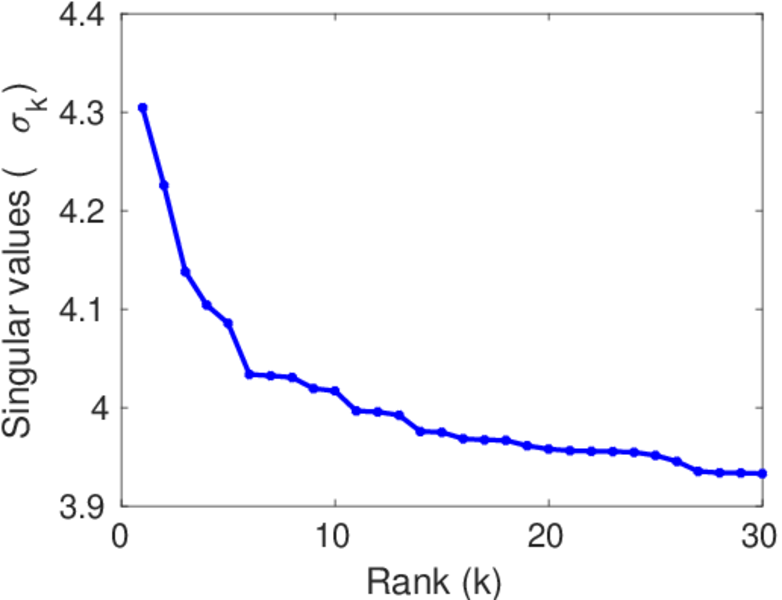
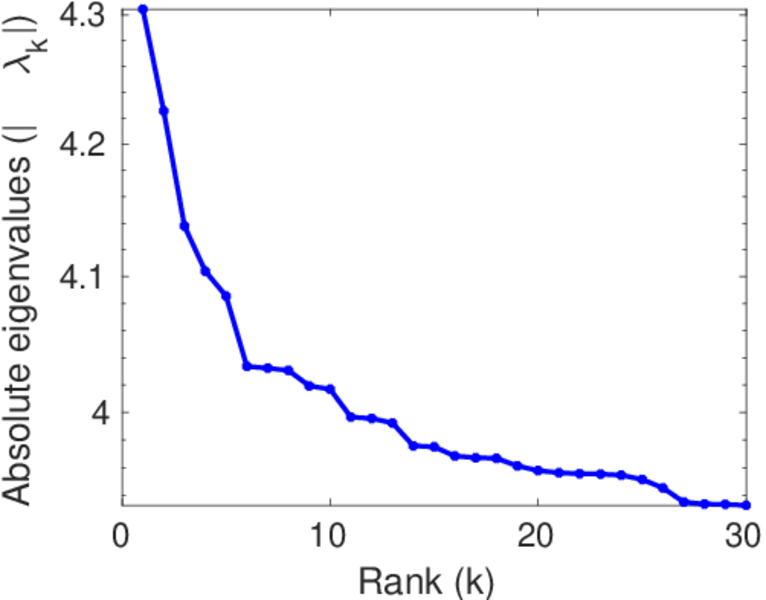
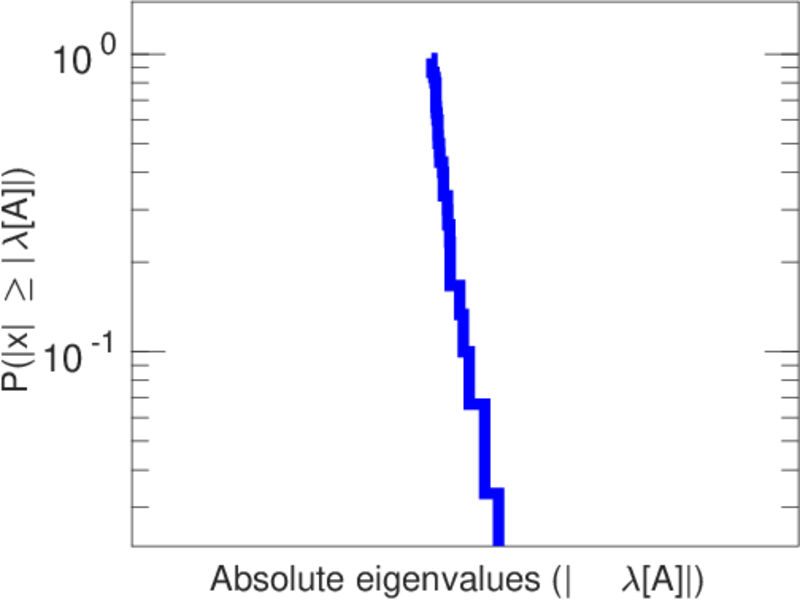
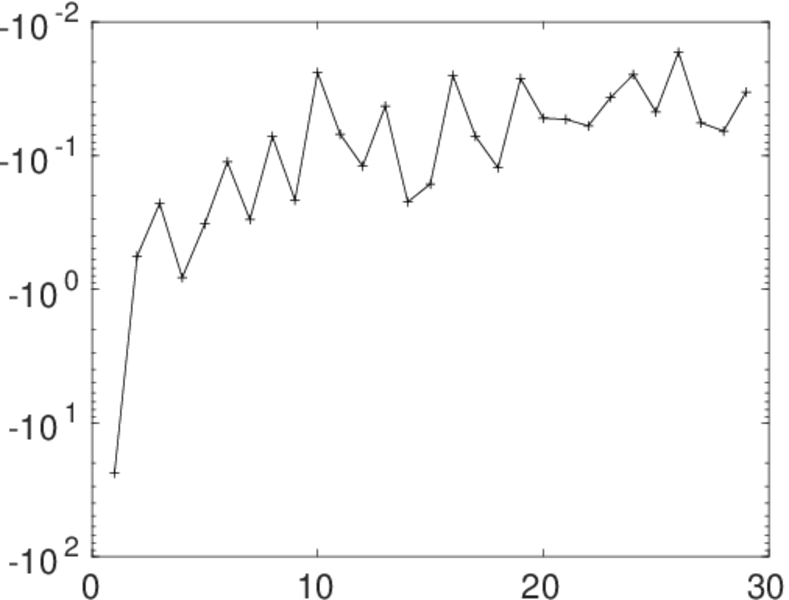
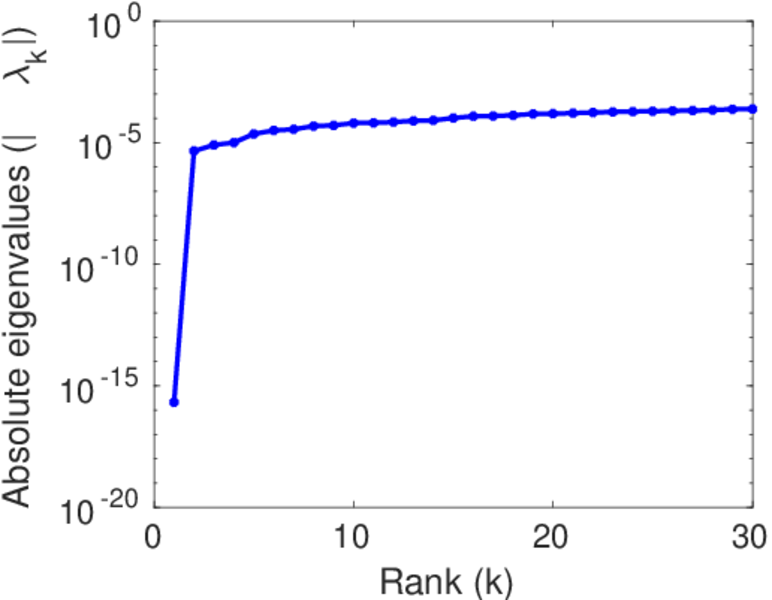
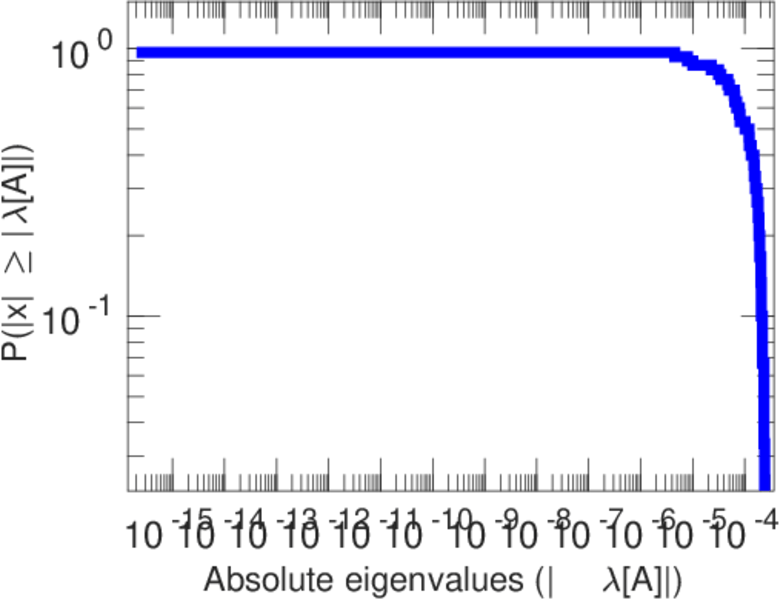
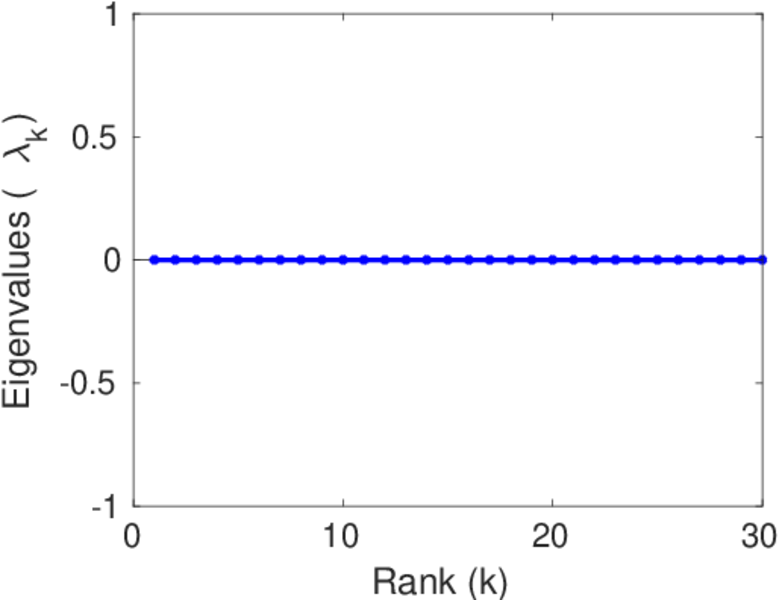
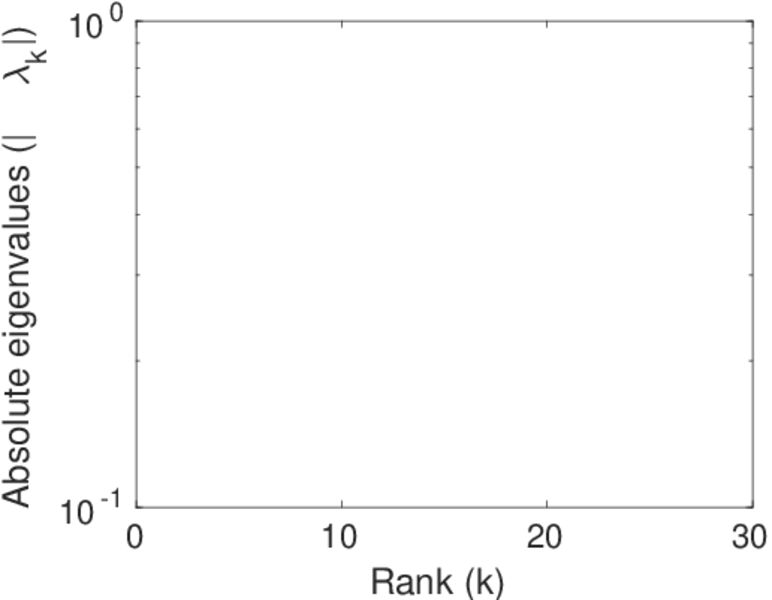
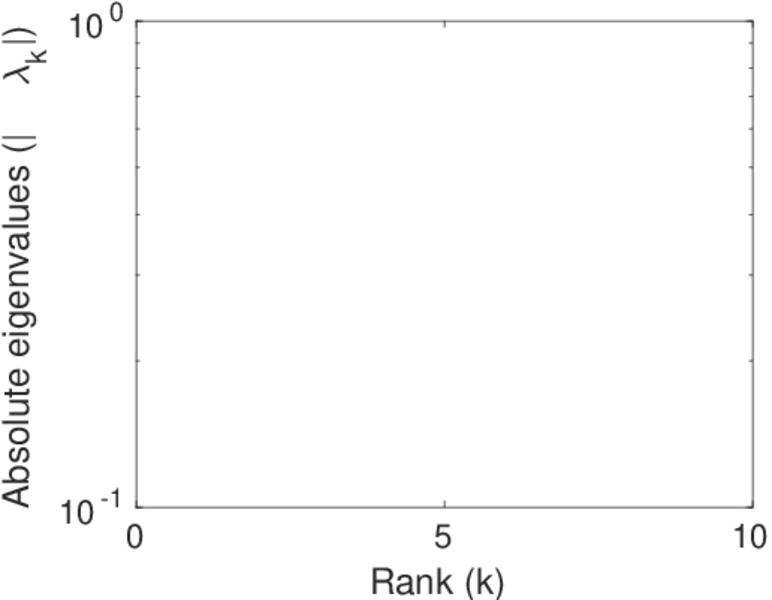
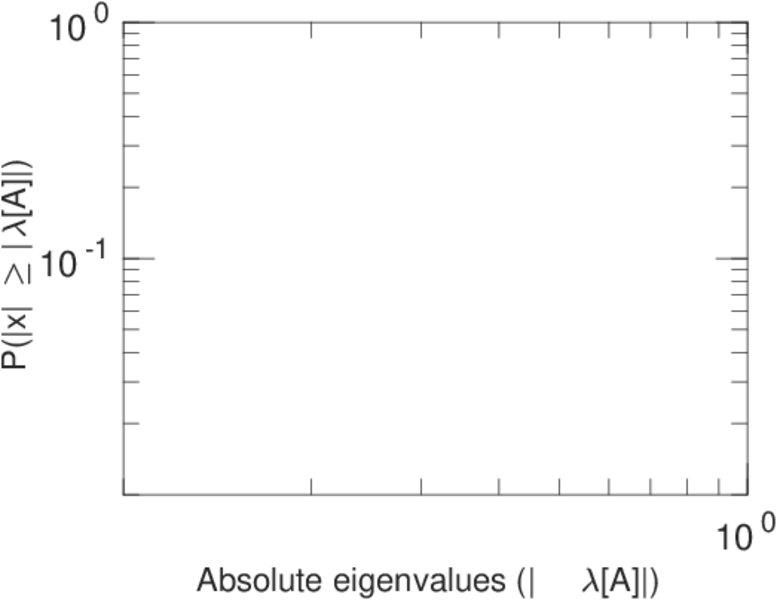
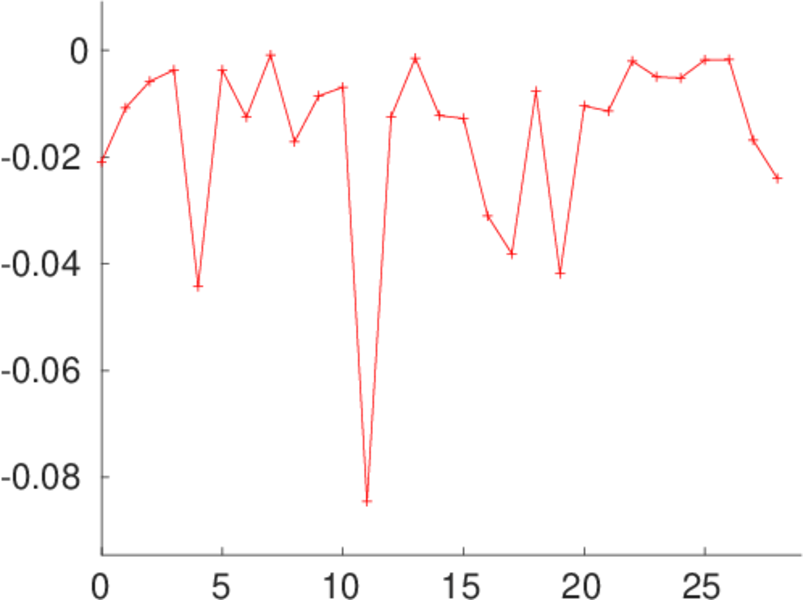
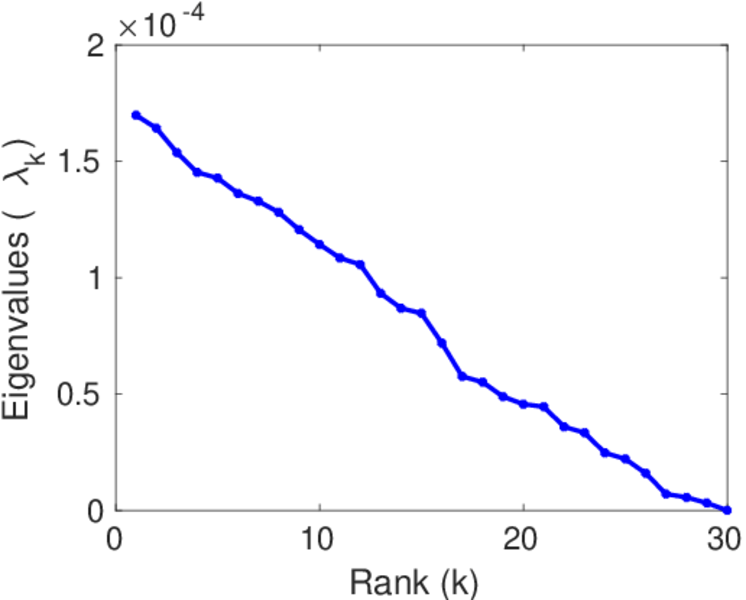
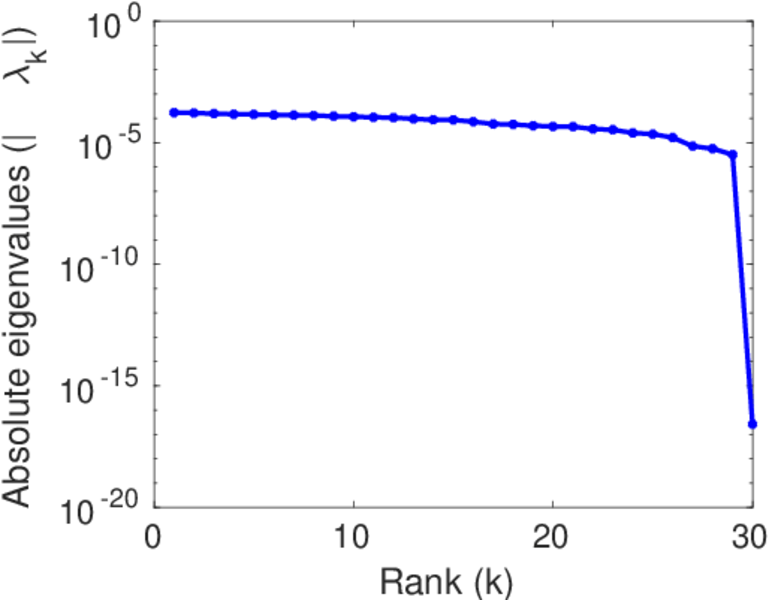
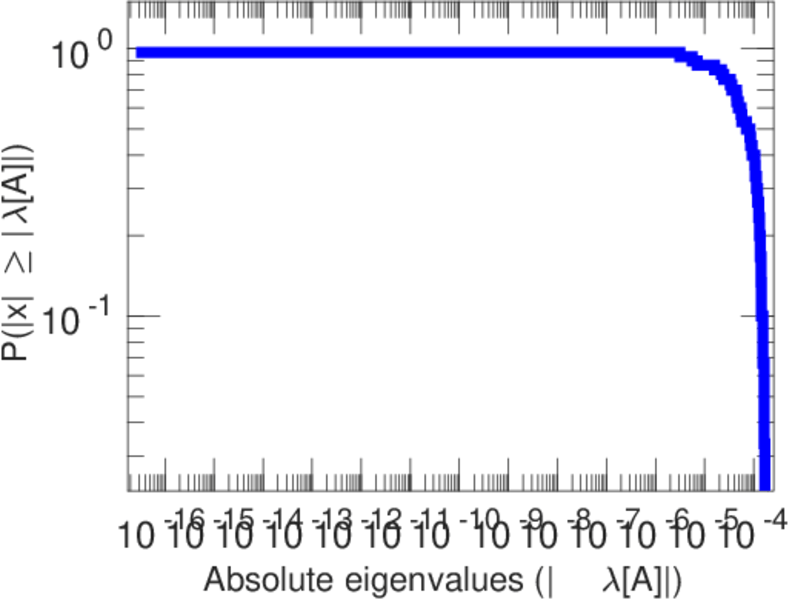
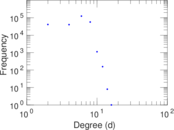
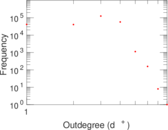
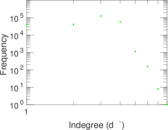
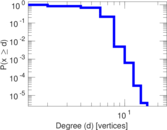
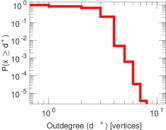
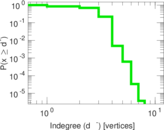
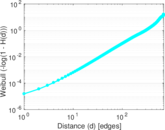
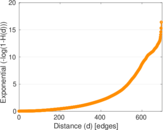
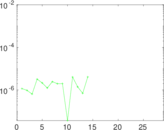
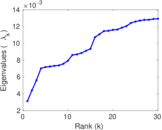
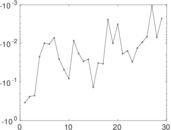
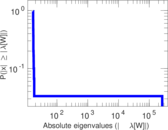
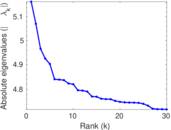
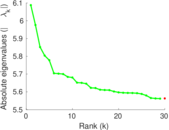
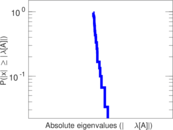
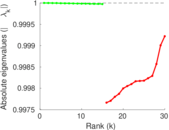
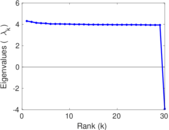
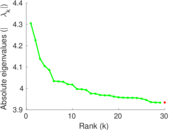
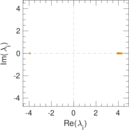
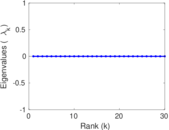
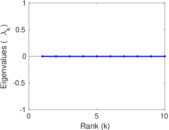
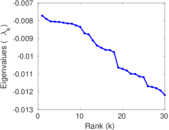
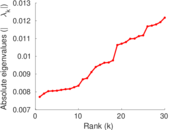
Plots


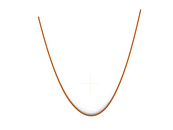


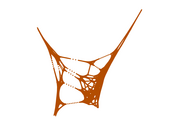

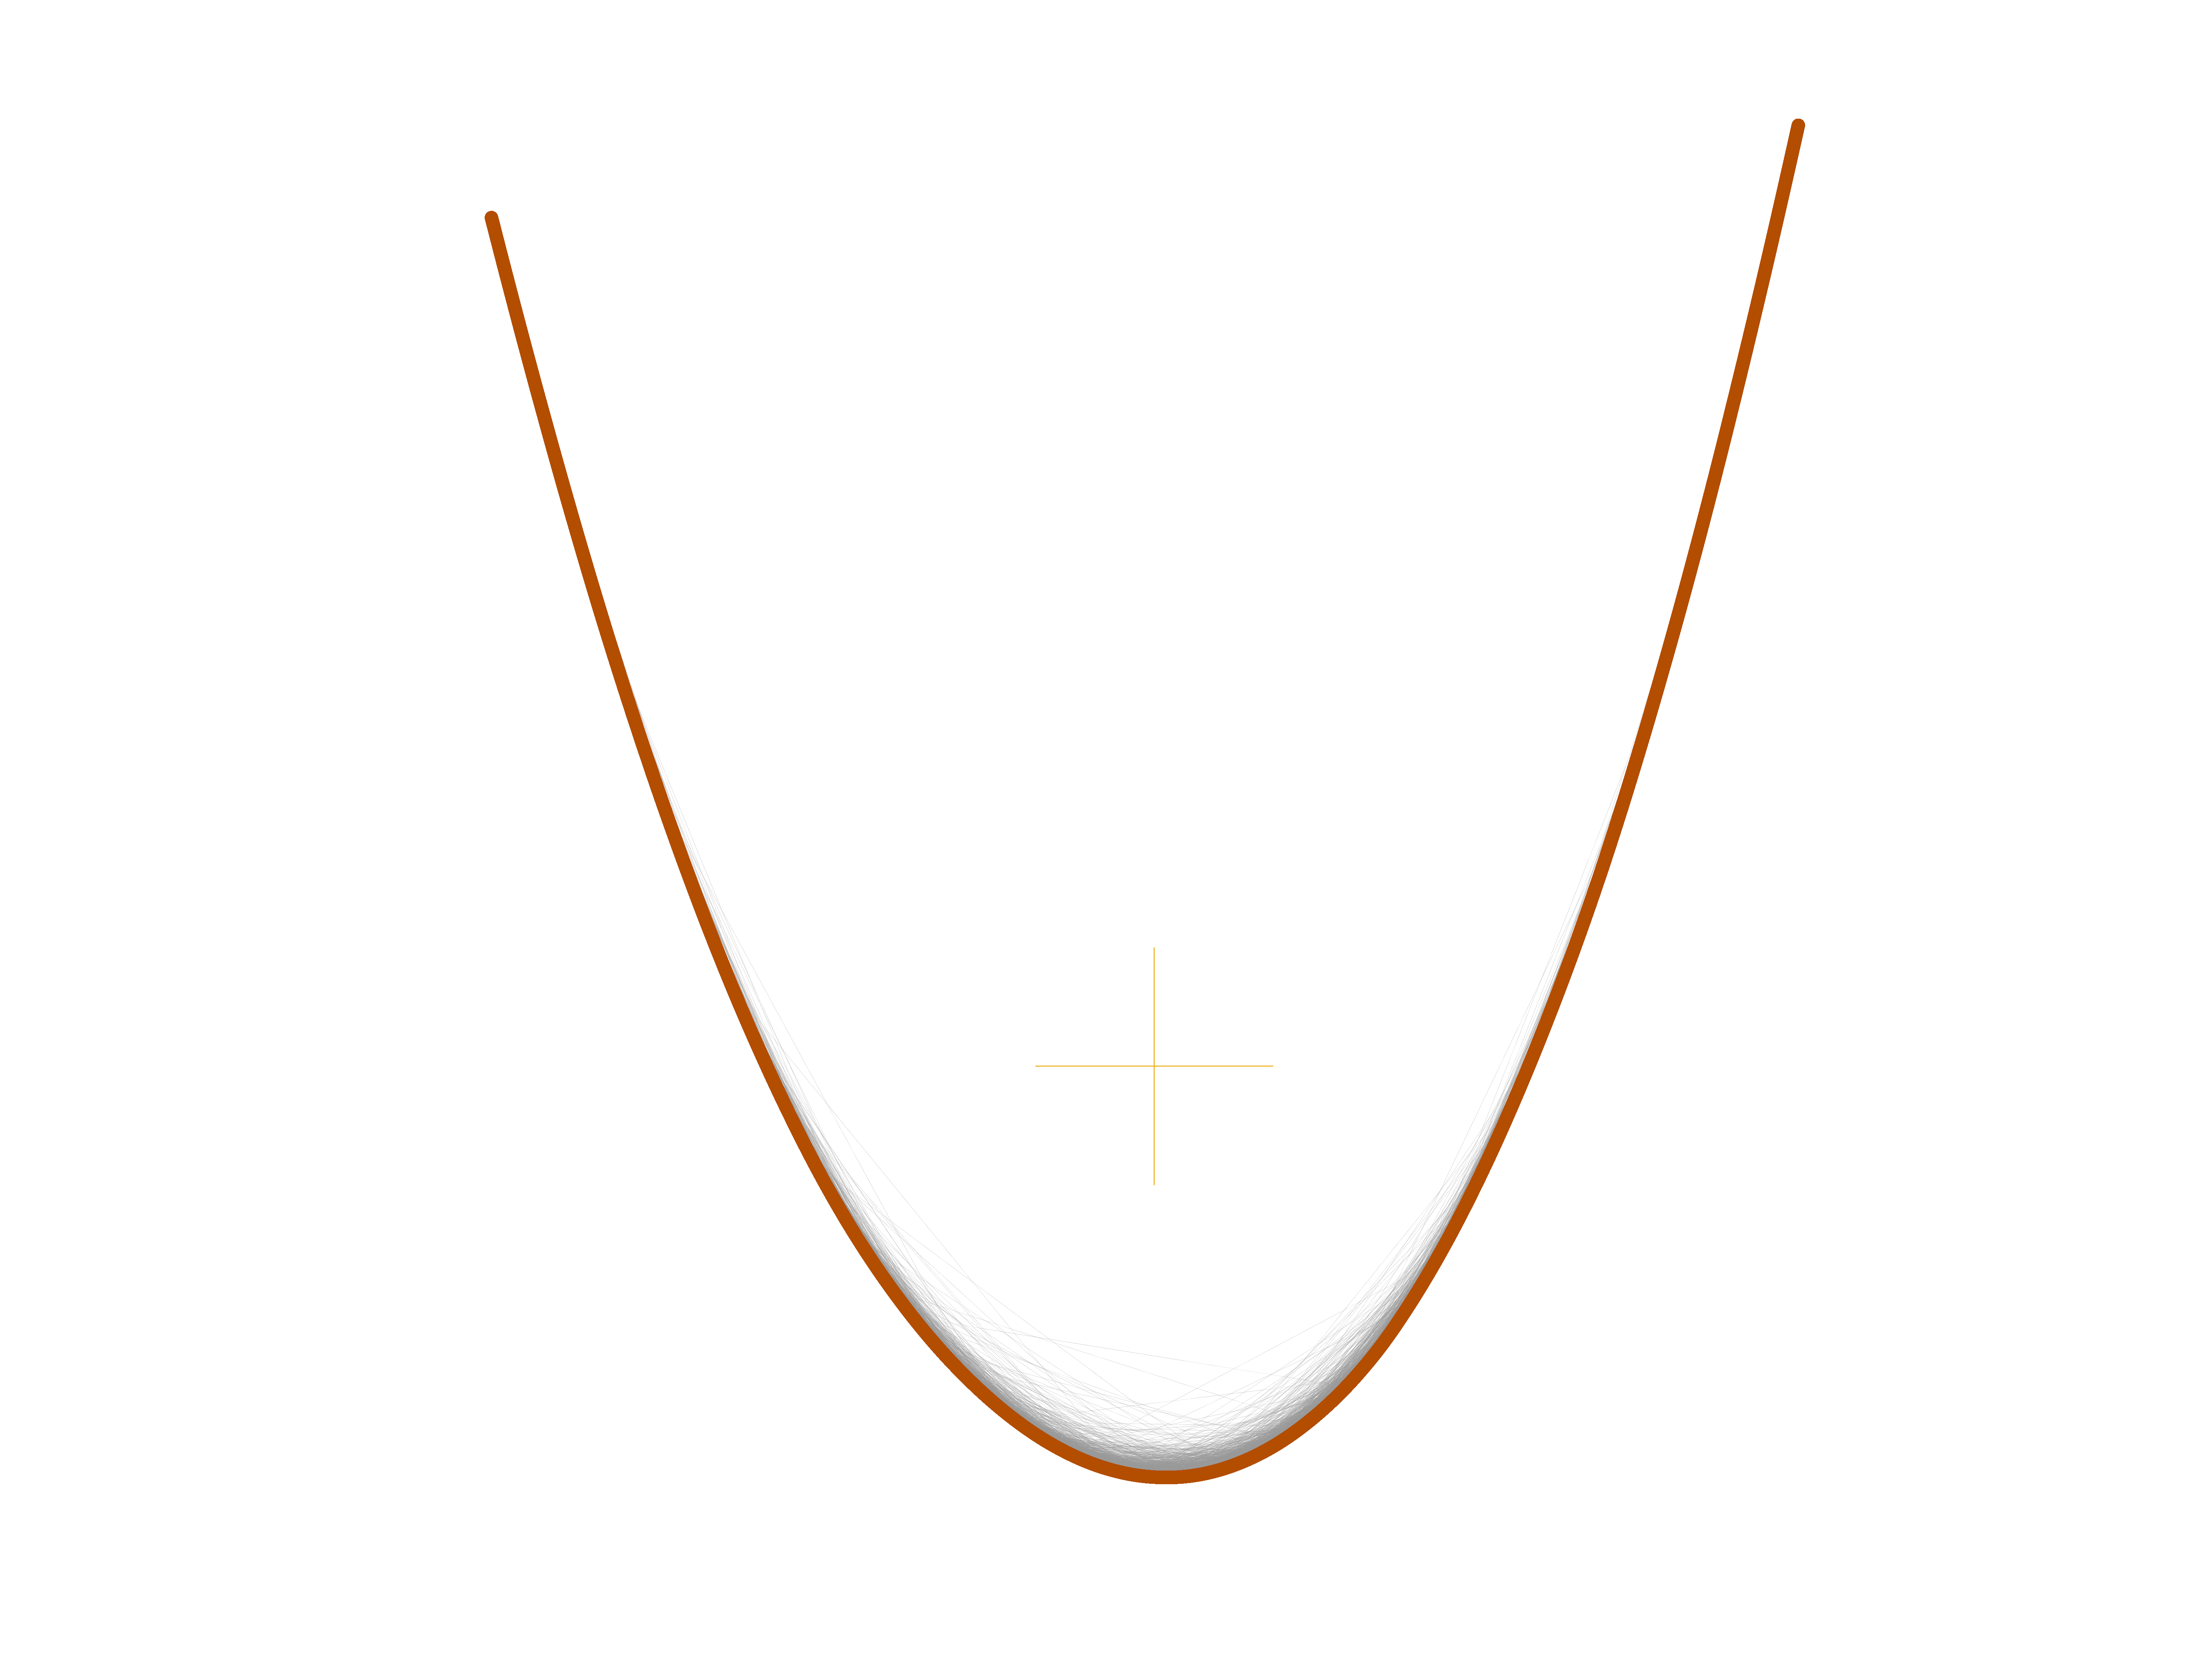
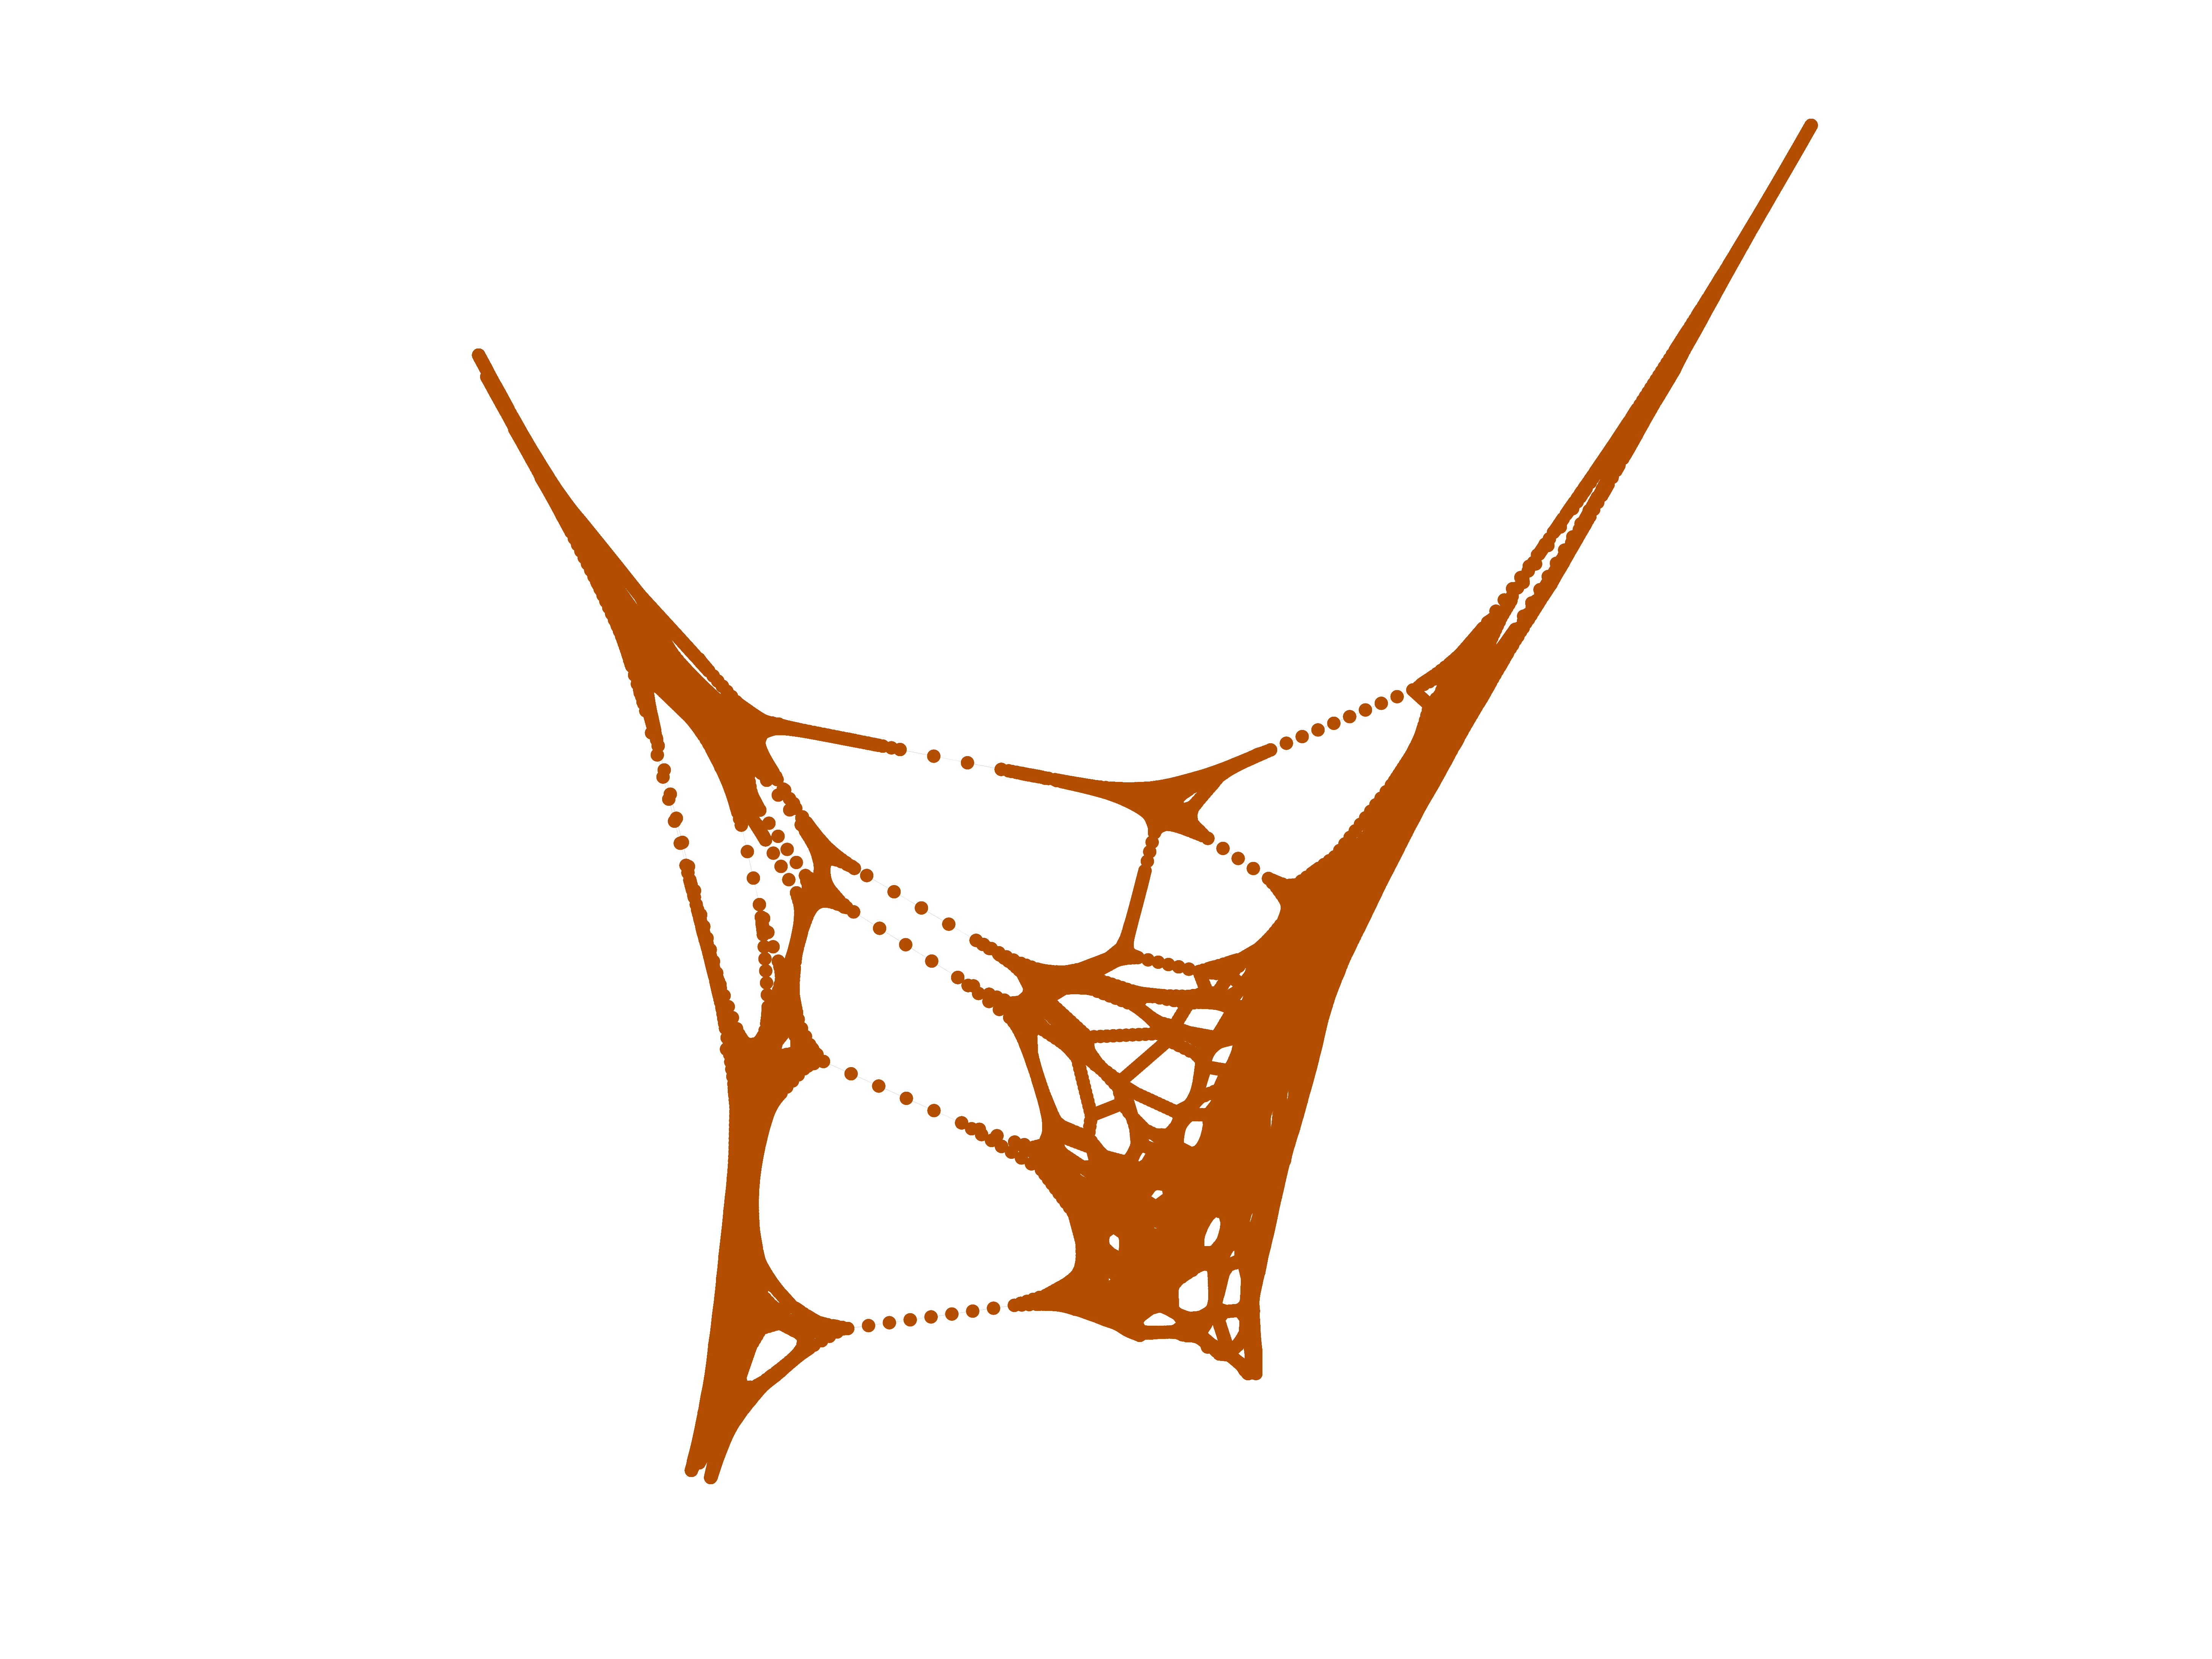
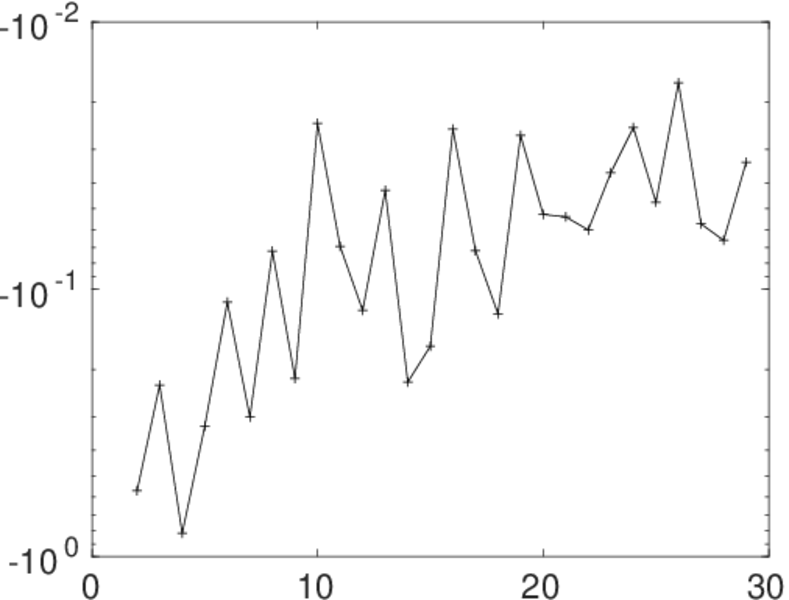
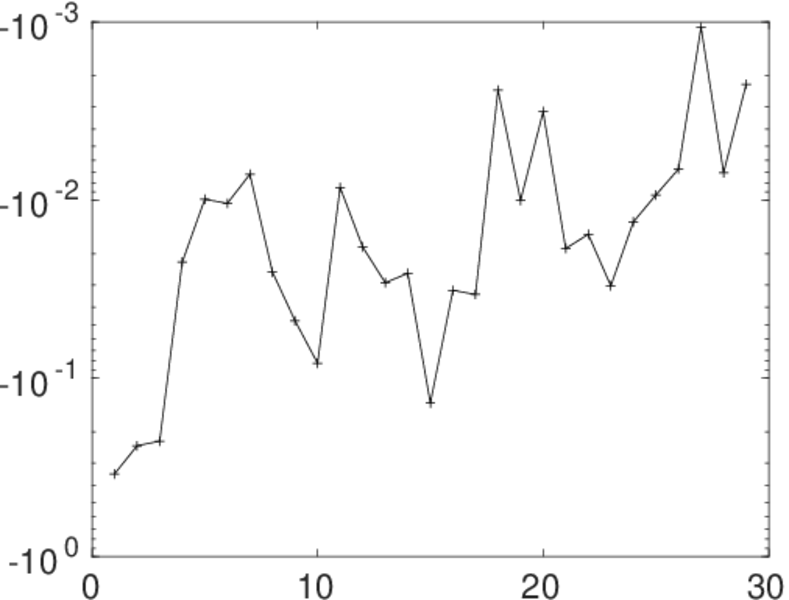
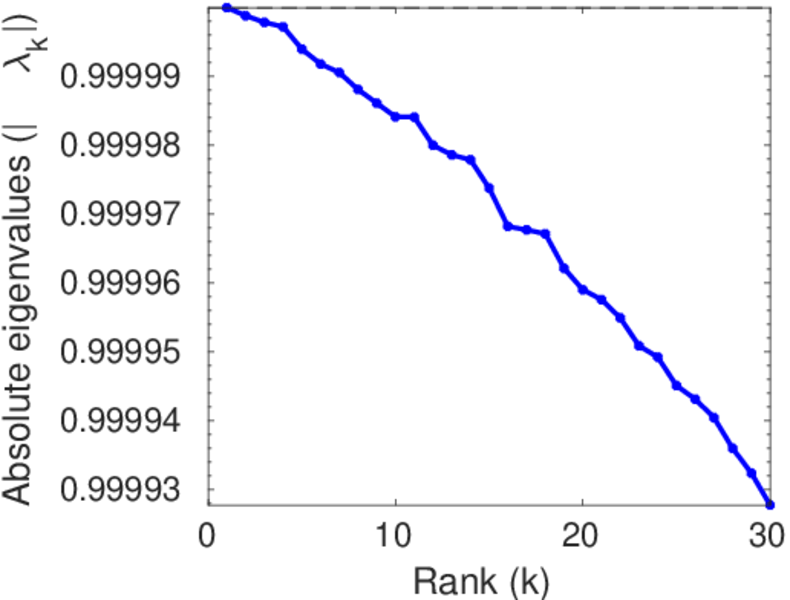
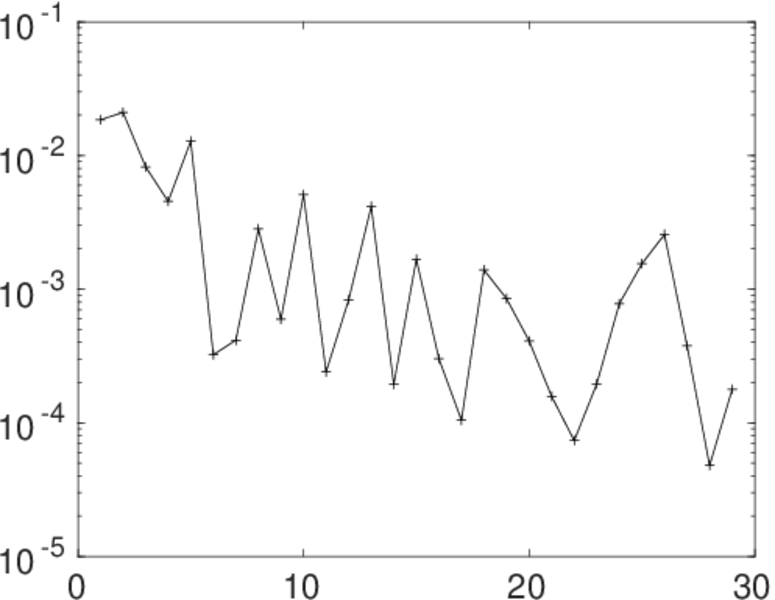
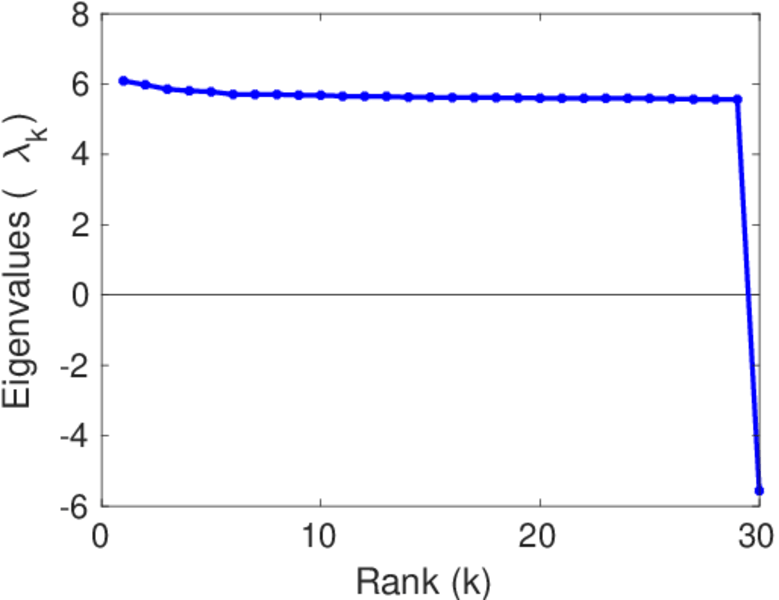
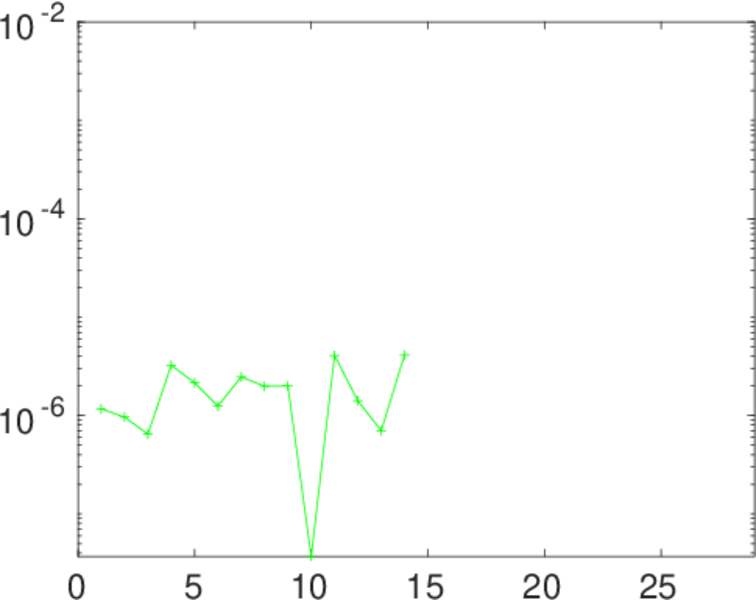
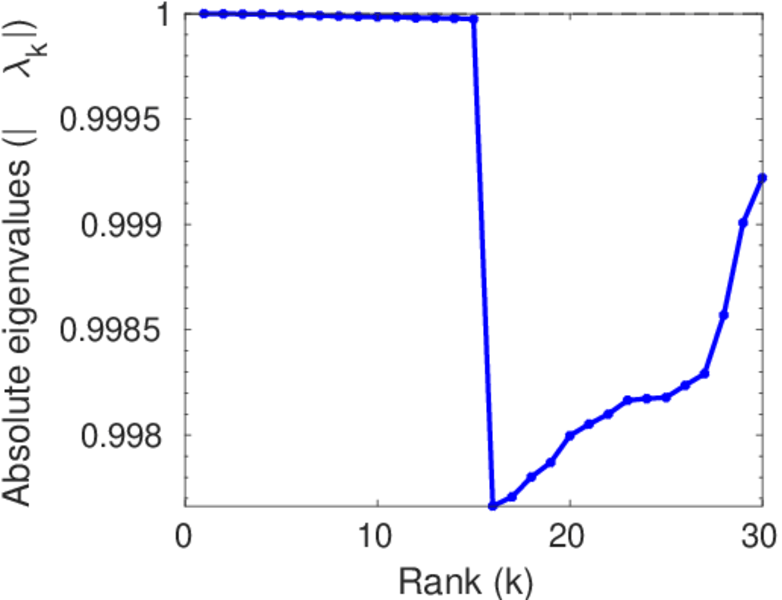
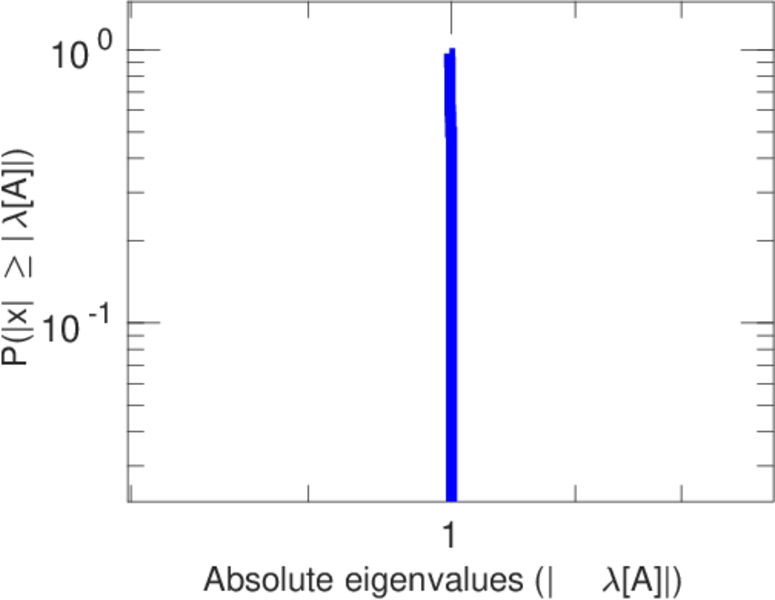
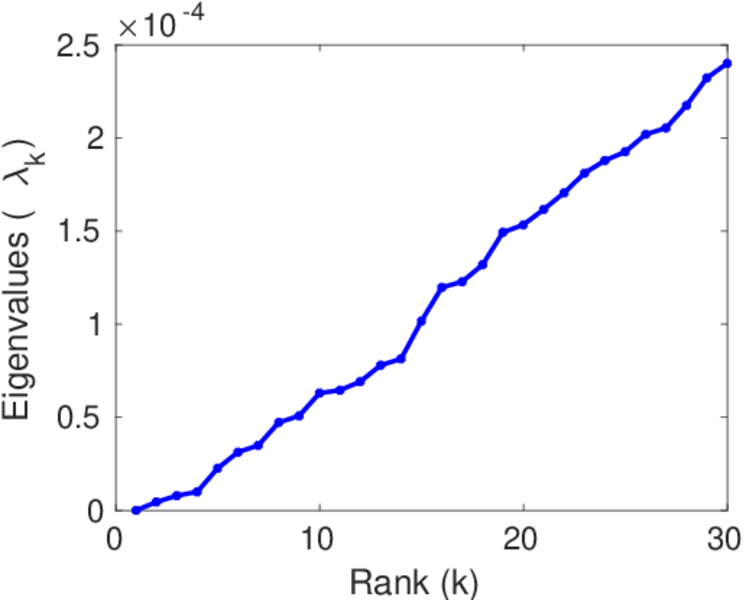
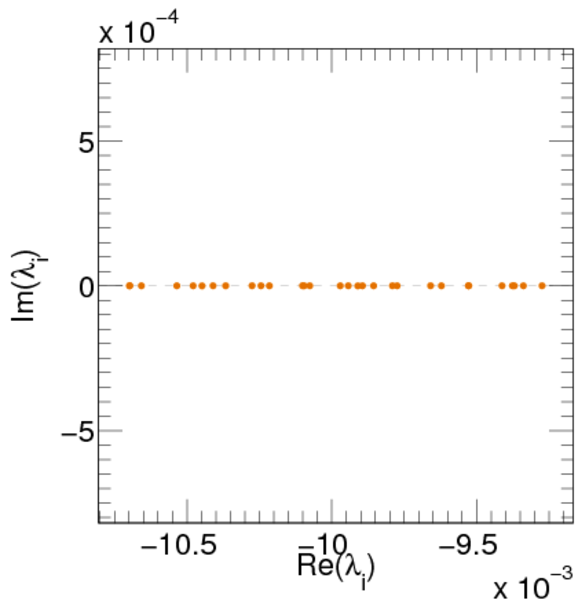
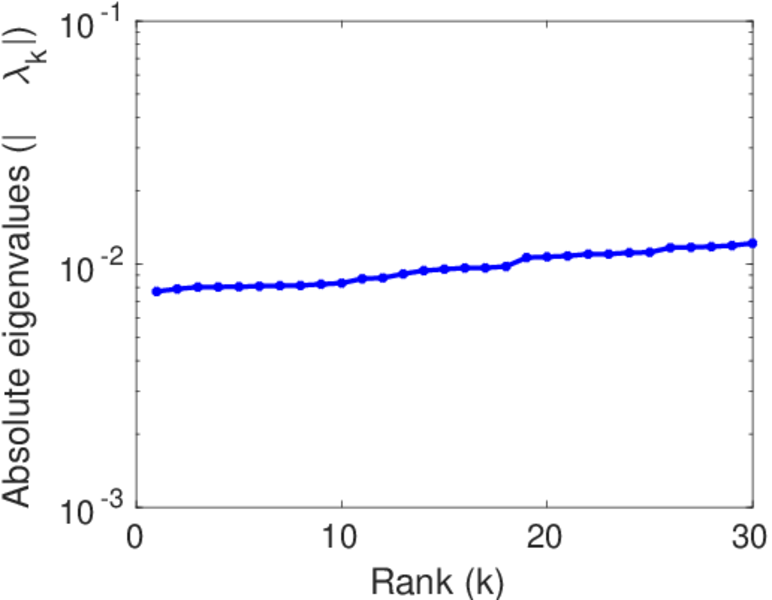
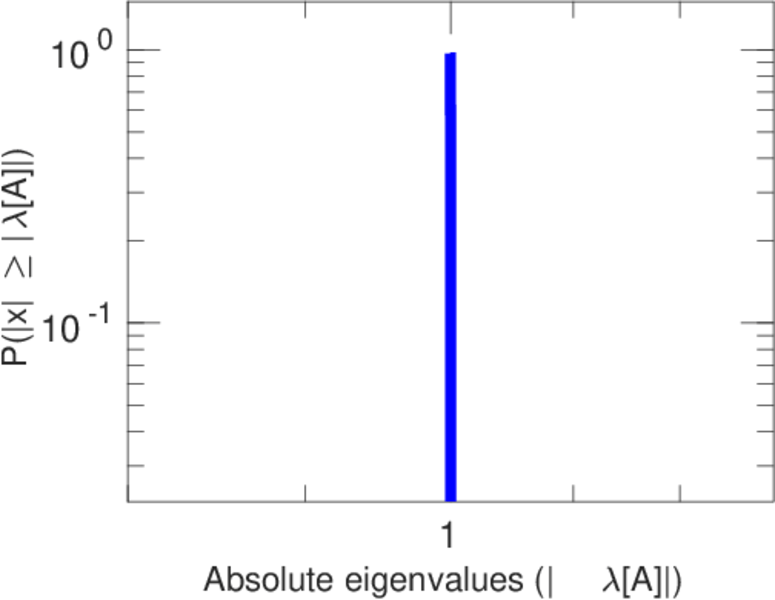
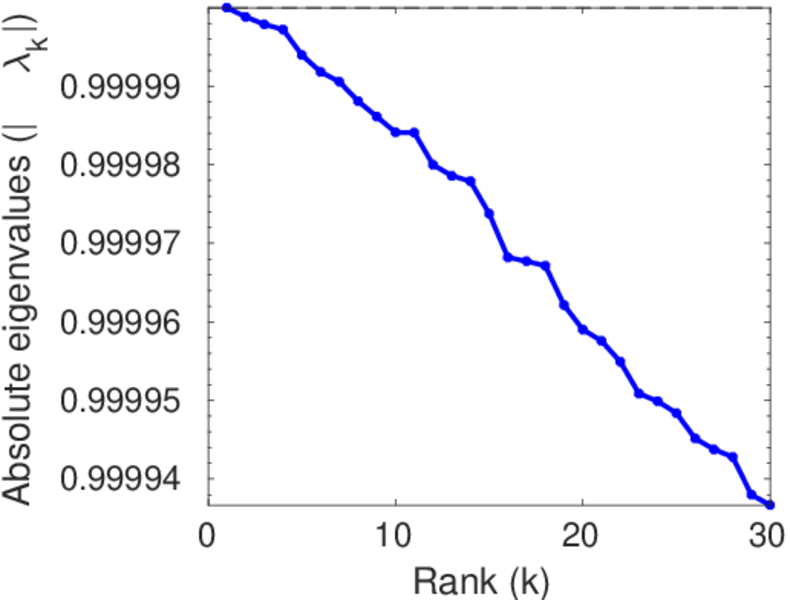
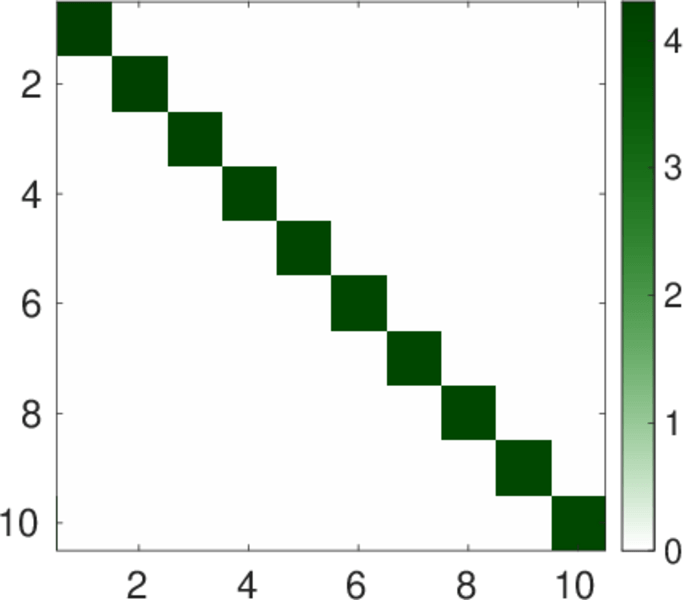
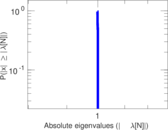
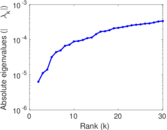
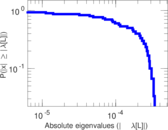
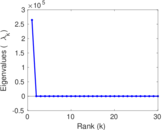
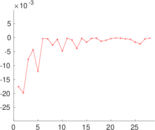
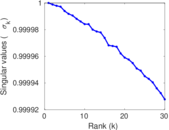
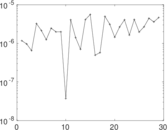
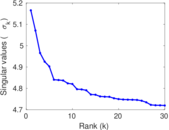
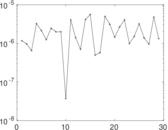
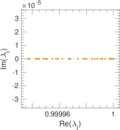
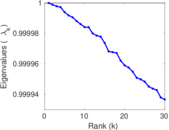
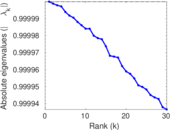
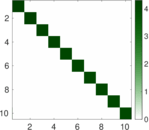
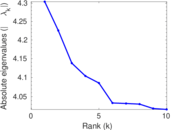
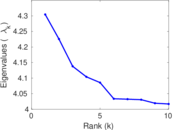
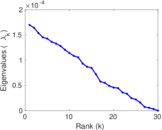
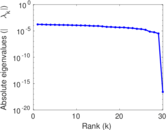
Matrix decompositions plots


Downloads
References
|
[1]
|
Jérôme Kunegis.
KONECT – The Koblenz Network Collection.
In Proc. Int. Conf. on World Wide Web Companion, pages
1343–1350, 2013.
[ http ]
|
 KONECT ‣ Networks ‣
Buy Me a Coffee
KONECT ‣ Networks ‣
Buy Me a Coffee