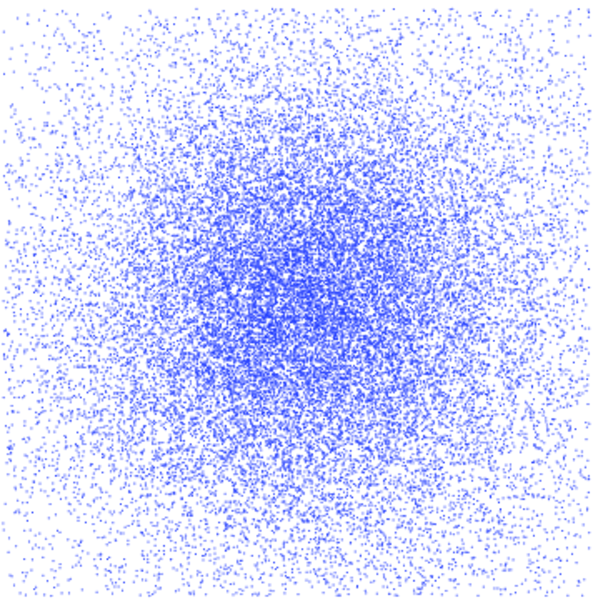
Western USA
This is the directed road network from the 9th DIMACS Implementation Challenge,
for the area "Western USA".
Metadata
Statistics
| Size | n = | 6,262,104
|
| Volume | m = | 15,119,284
|
| Loop count | l = | 0
|
| Wedge count | s = | 13,348,095
|
| Claw count | z = | 94,902,604
|
| Cross count | x = | 86,980,519
|
| Triangle count | t = | 136,115
|
| Square count | q = | 393,682
|
| 4-Tour count | T4 = | 71,661,120
|
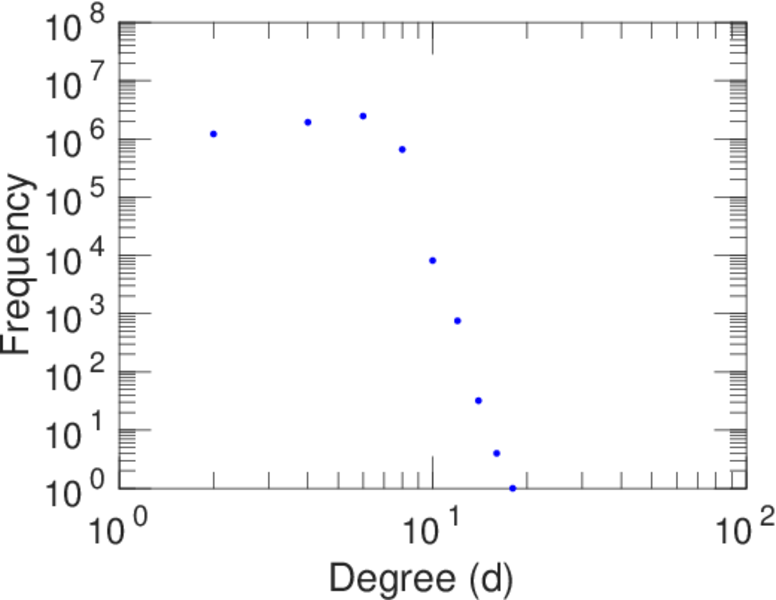
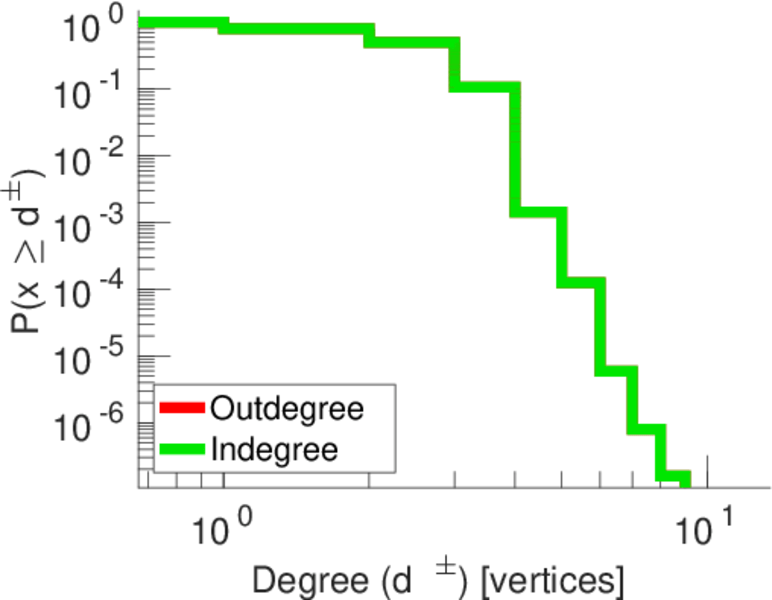
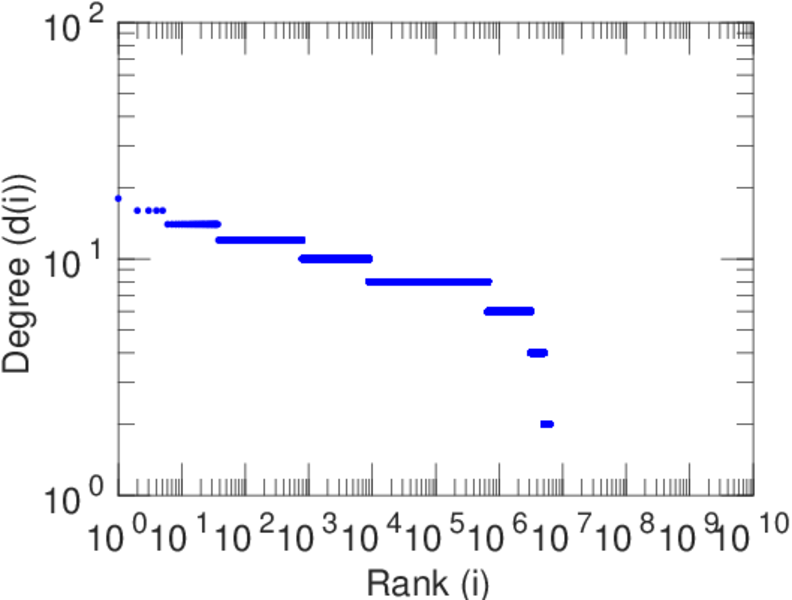
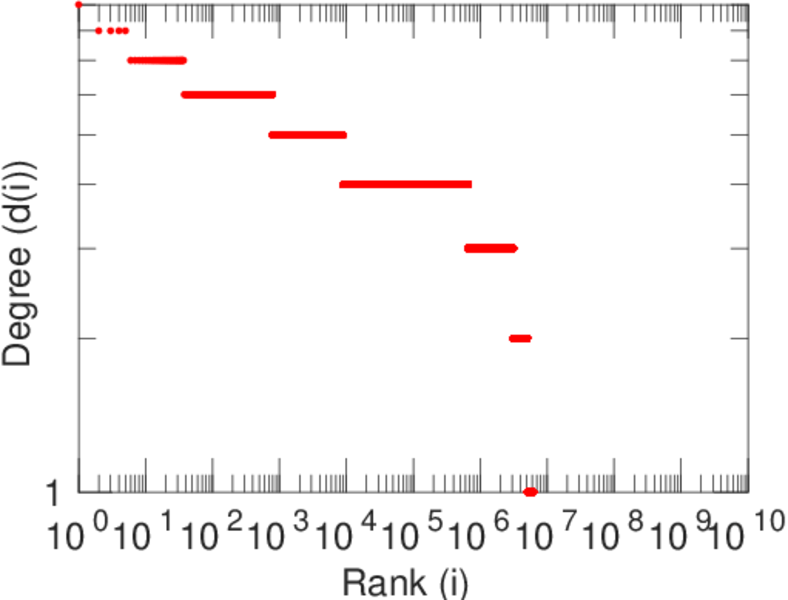
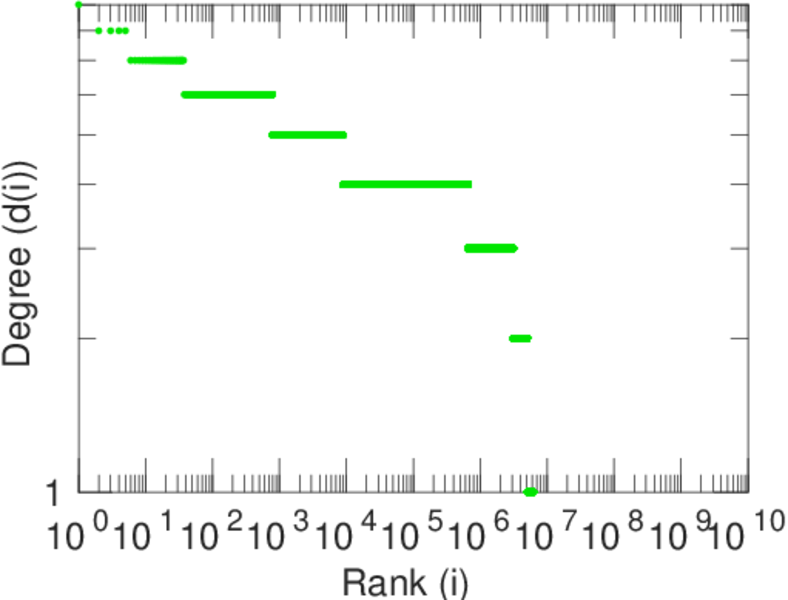
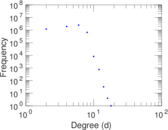
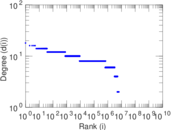
| Maximum degree | dmax = | 18
|
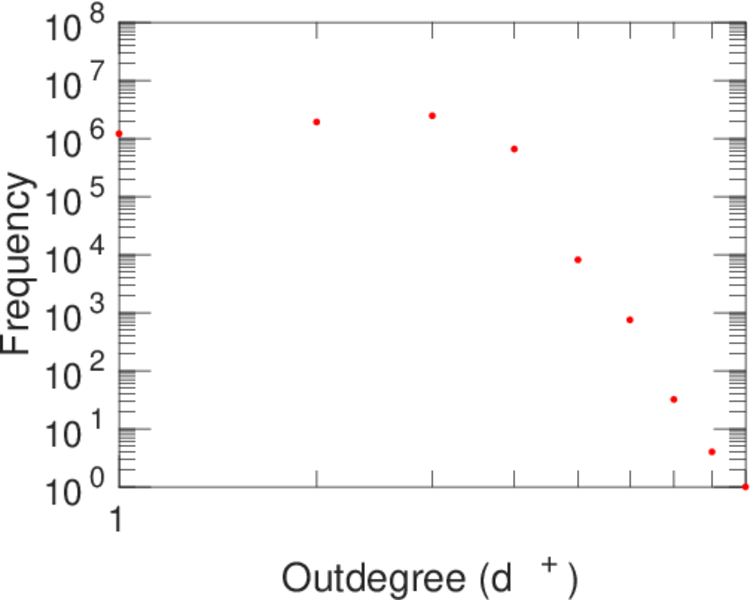
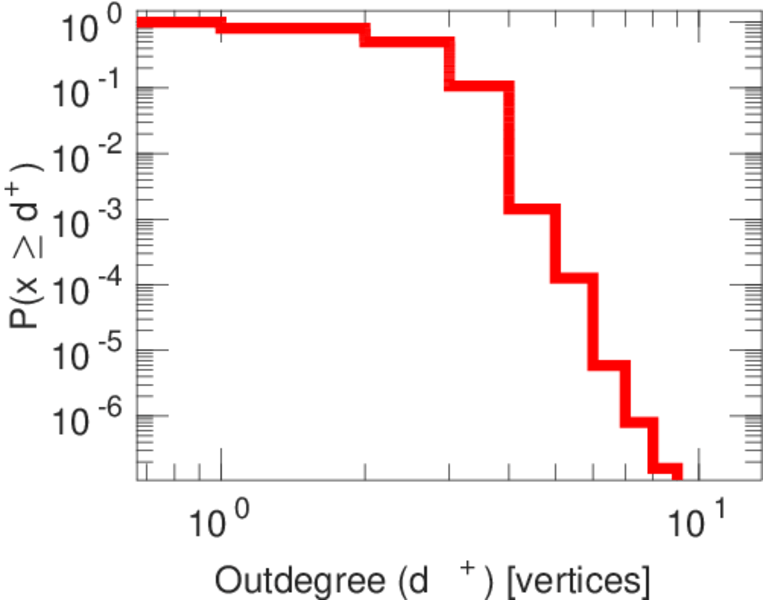
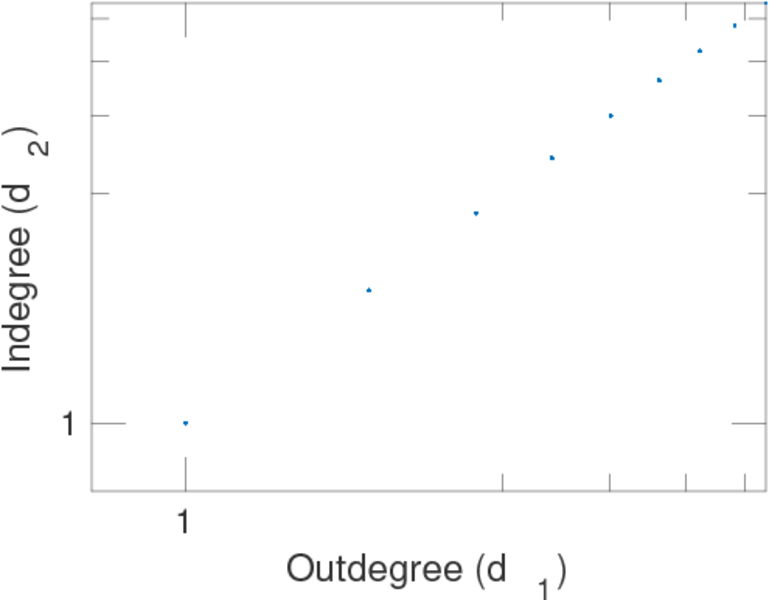
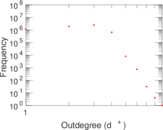
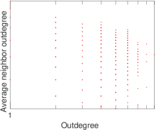
| Maximum outdegree | d+max = | 9
|
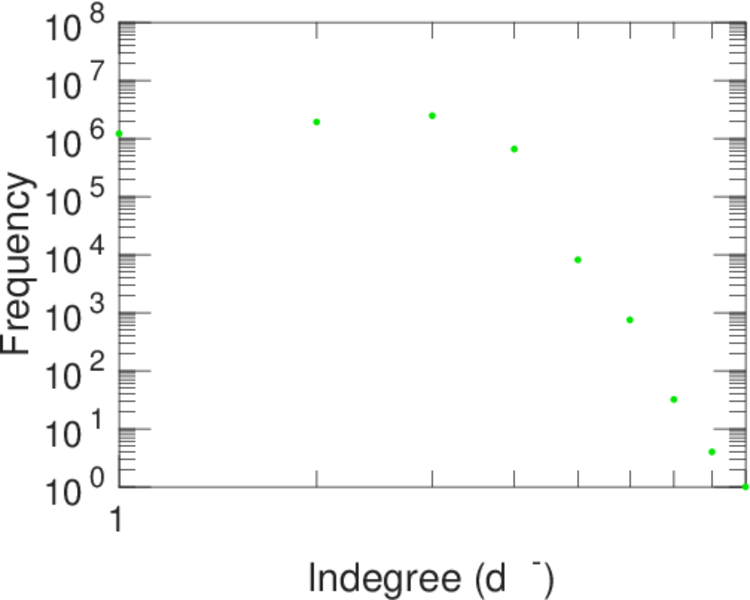
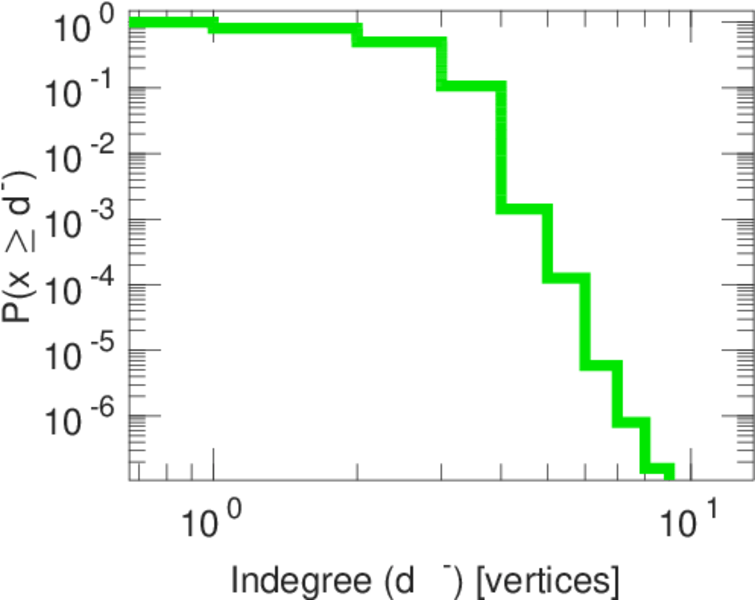
| Maximum indegree | d−max = | 9
|
| Average degree | d = | 4.828 82
|
| Fill | p = | 3.855 59 × 10−7
|
| Size of LCC | N = | 6,262,104
|
| Size of LSCC | Ns = | 6,262,104
|
| Relative size of LSCC | Nrs = | 1.000 00
|
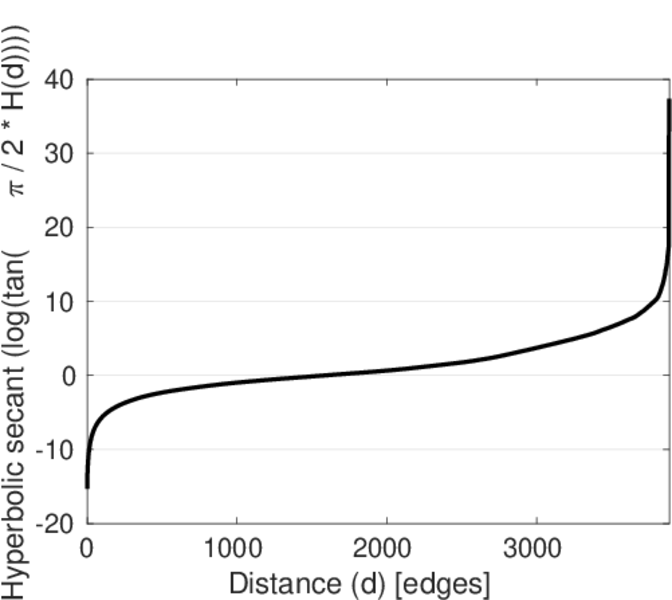
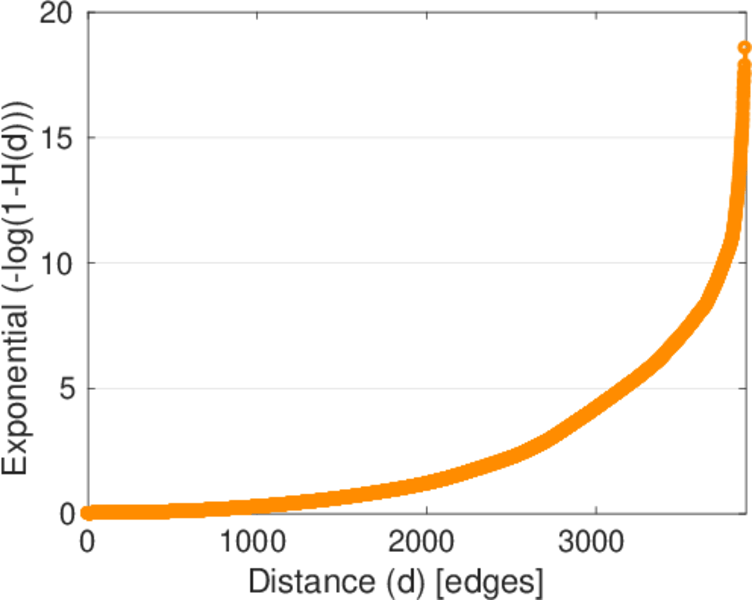
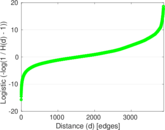
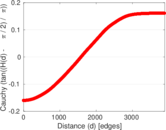
| Diameter | δ = | 4,420
|
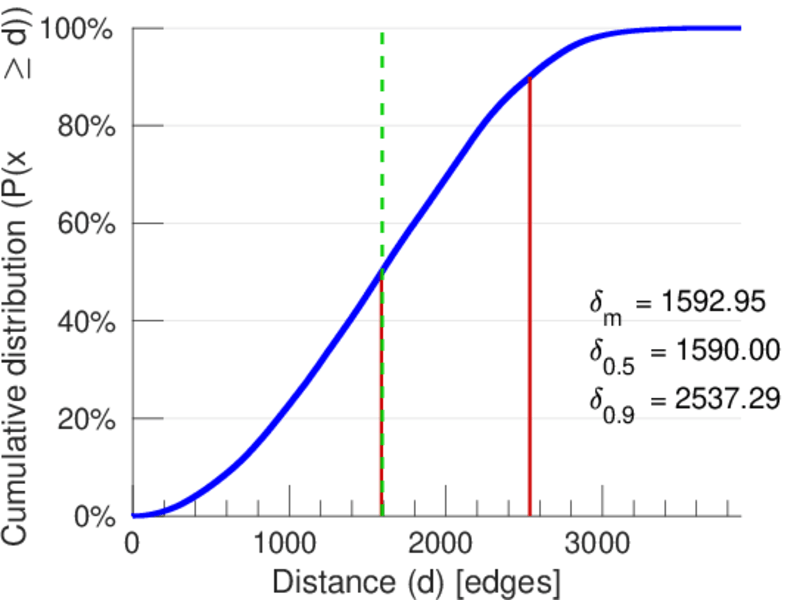
| 50-Percentile effective diameter | δ0.5 = | 1,590.00
|
| 90-Percentile effective diameter | δ0.9 = | 2,537.29
|
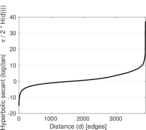
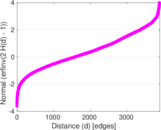
| Median distance | δM = | 1,590
|
| Mean distance | δm = | 1,592.95
|
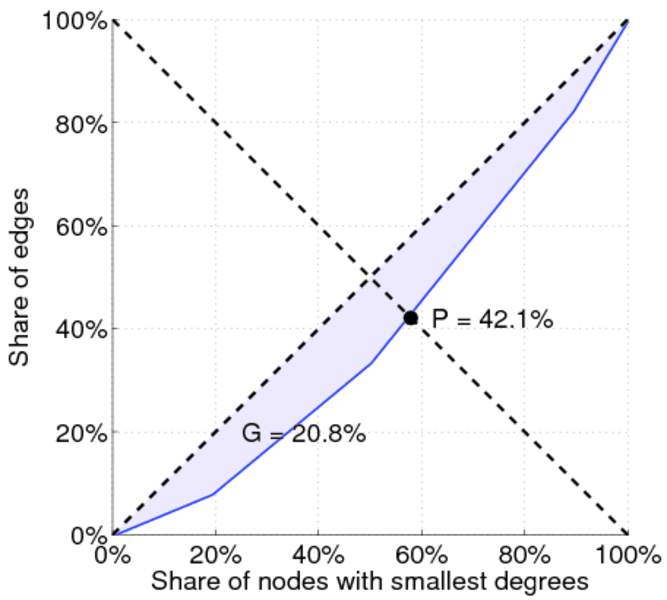
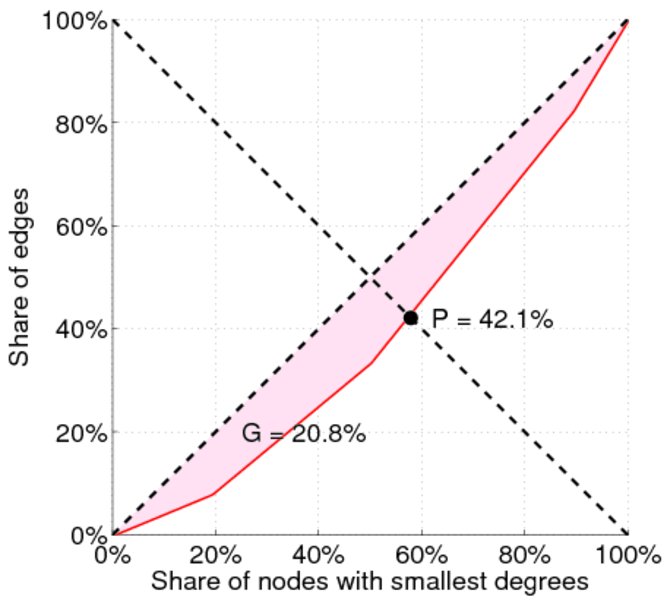
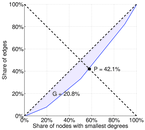
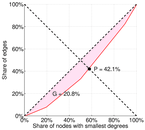
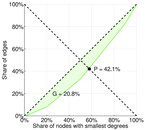
| Gini coefficient | G = | 0.208 097
|
| Balanced inequality ratio | P = | 0.421 020
|
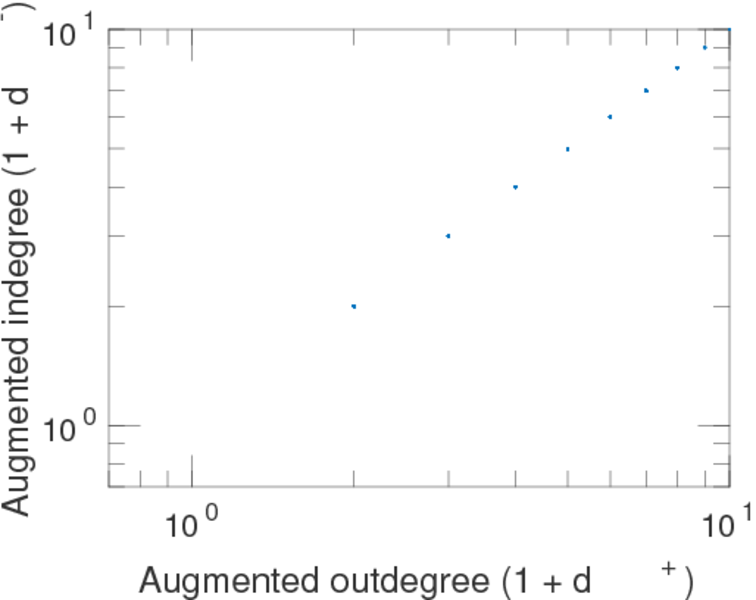
| Outdegree balanced inequality ratio | P+ = | 0.421 020
|
| Indegree balanced inequality ratio | P− = | 0.421 020
|
| Relative edge distribution entropy | Her = | 0.995 036
|
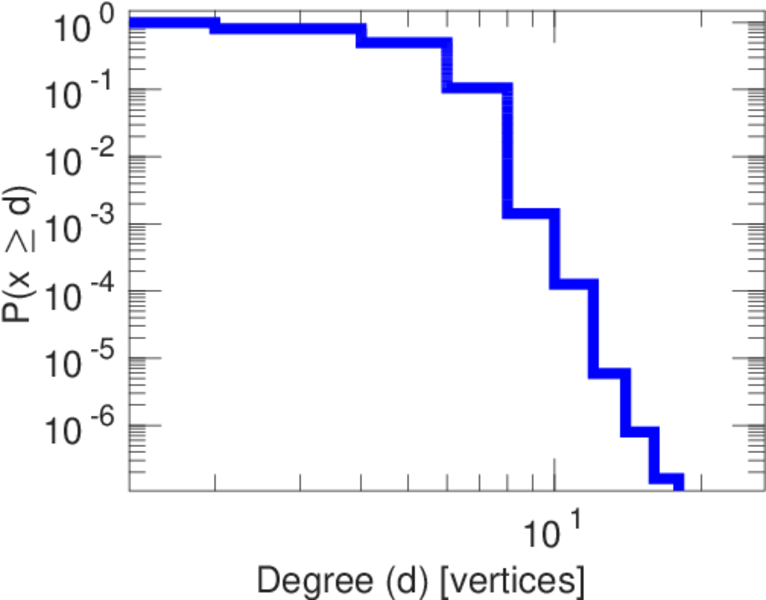
| Power law exponent | γ = | 2.261 36
|
| Tail power law exponent | γt = | 6.601 00
|
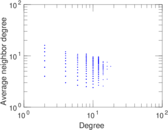
| Degree assortativity | ρ = | +0.078 943 8
|
| Degree assortativity p-value | pρ = | 0.000 00
|
| Clustering coefficient | c = | 0.030 592 0
|
| Directed clustering coefficient | c± = | 0.030 592 0
|
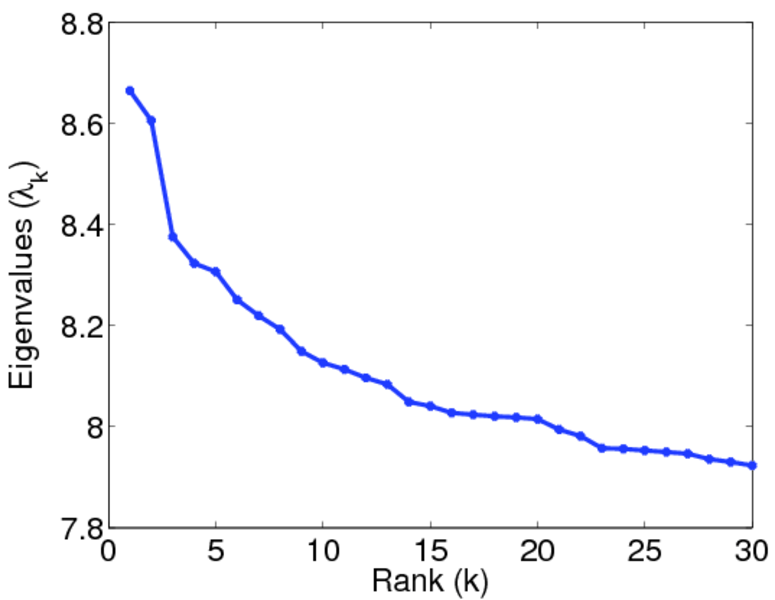
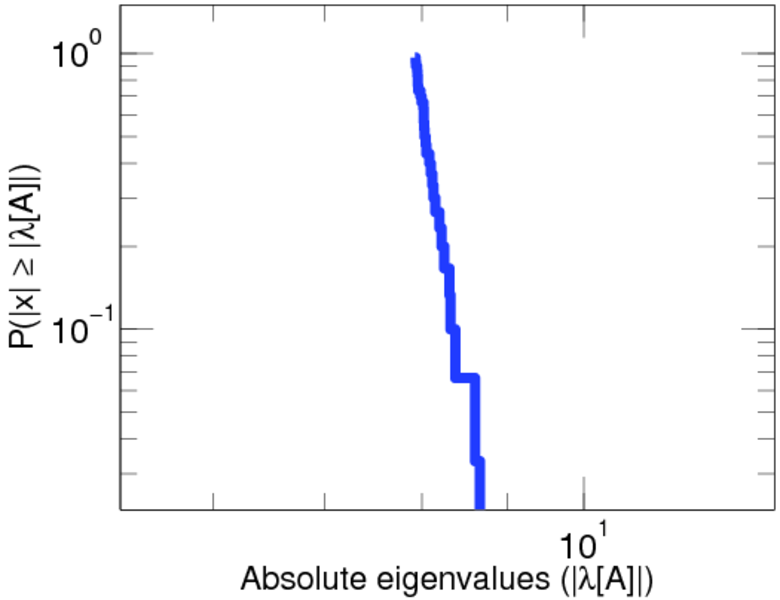
| Spectral norm | α = | 8.664 63
|
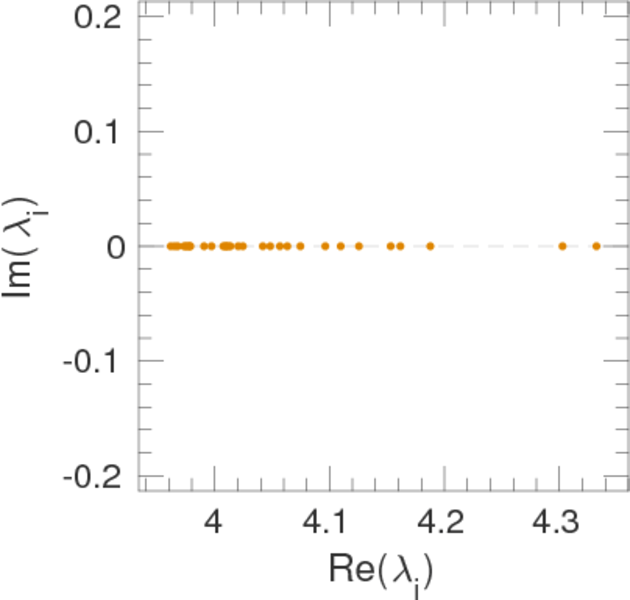
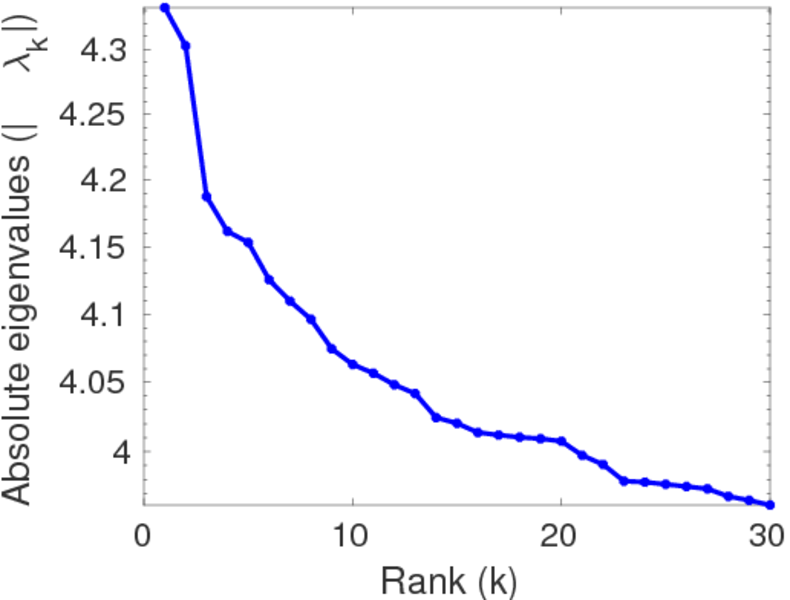
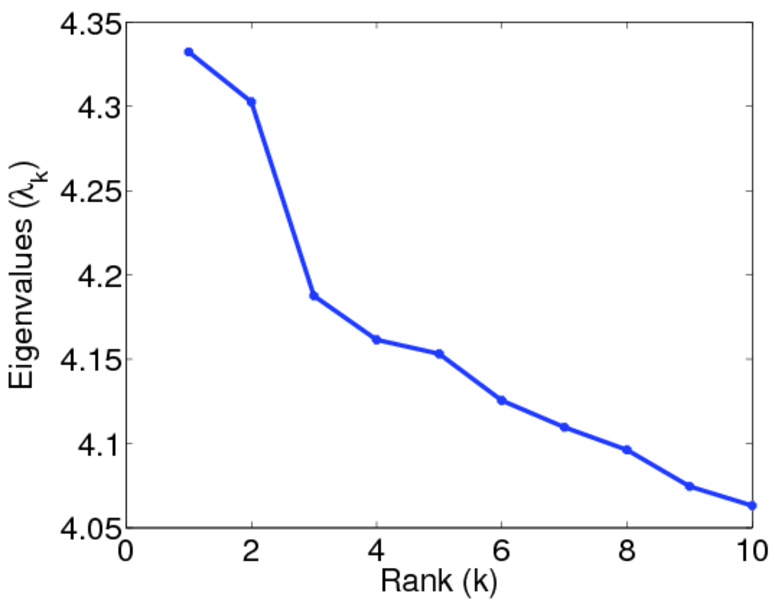
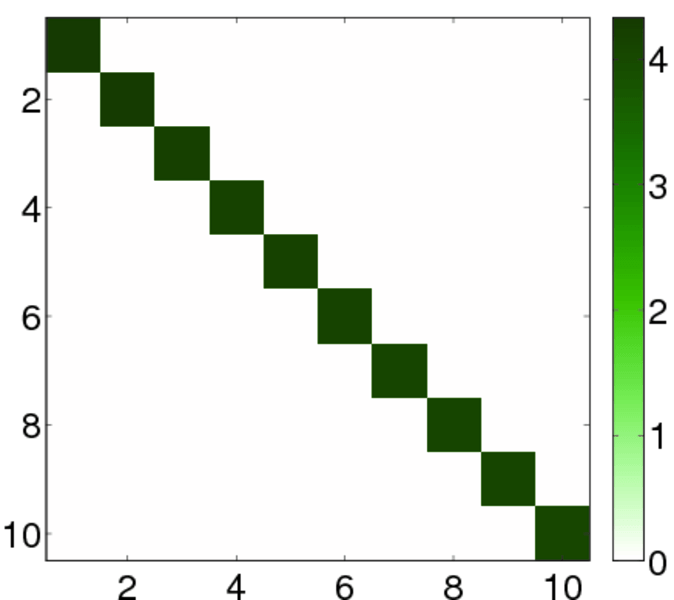
| Operator 2-norm | ν = | 4.332 32
|
| Cyclic eigenvalue | π = | 4.332 32
|
| Algebraic connectivity | a = | 1.105 90 × 10−7
|
| Reciprocity | y = | 1.000 00
|
| Non-bipartivity | bA = | 0.093 651 9
|
| Normalized non-bipartivity | bN = | 6.231 10 × 10−5
|
| Algebraic non-bipartivity | χ = | 0.000 123 744
|
| Spectral bipartite frustration | bK = | 1.281 31 × 10−5
|
| Controllability | C = | 630,331
|
| Relative controllability | Cr = | 0.100 658
|
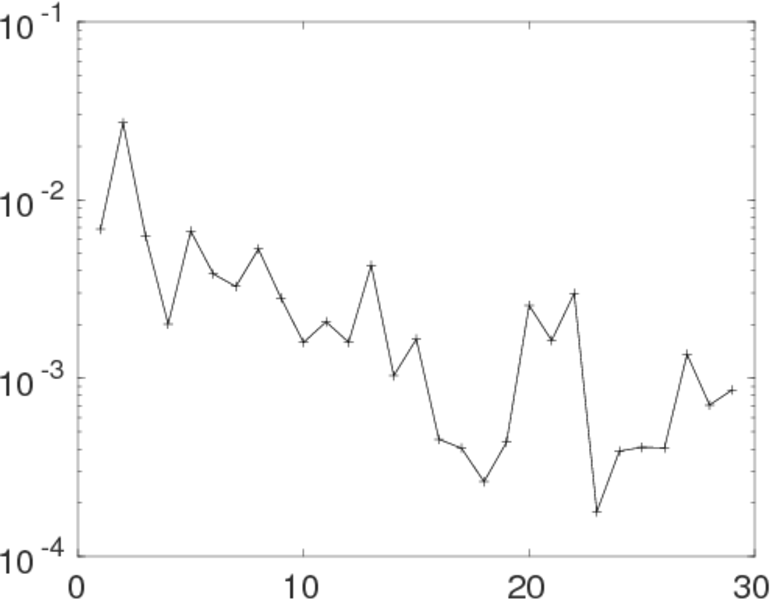
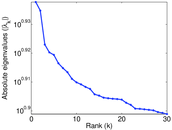
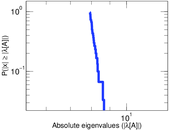
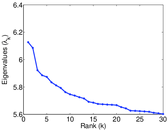
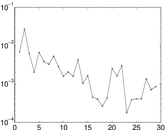
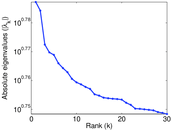
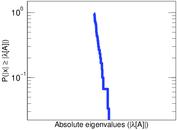
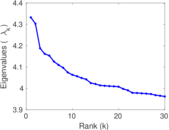
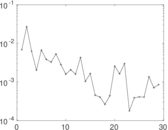
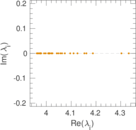
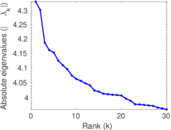
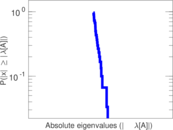
Plots


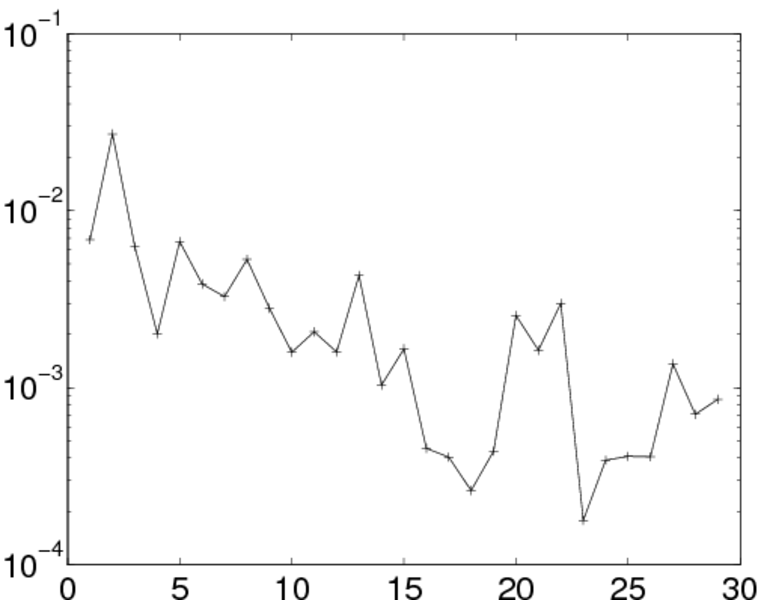
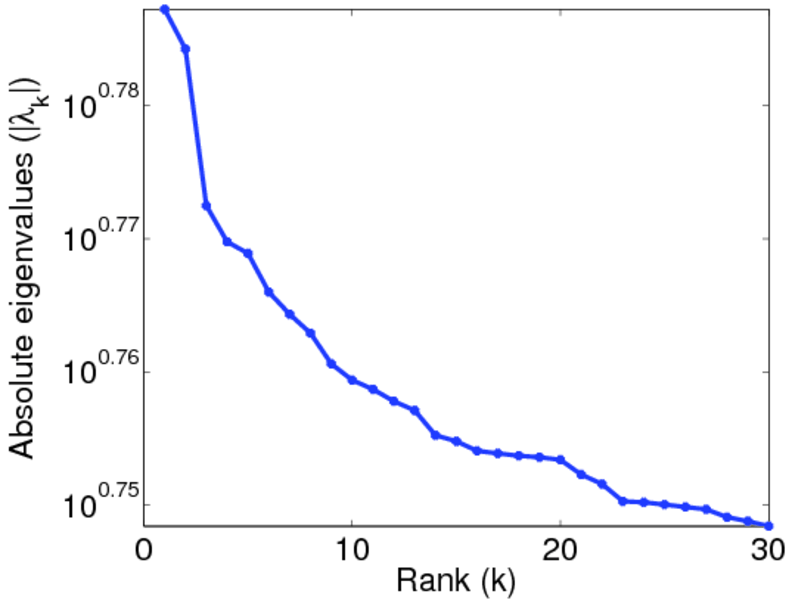
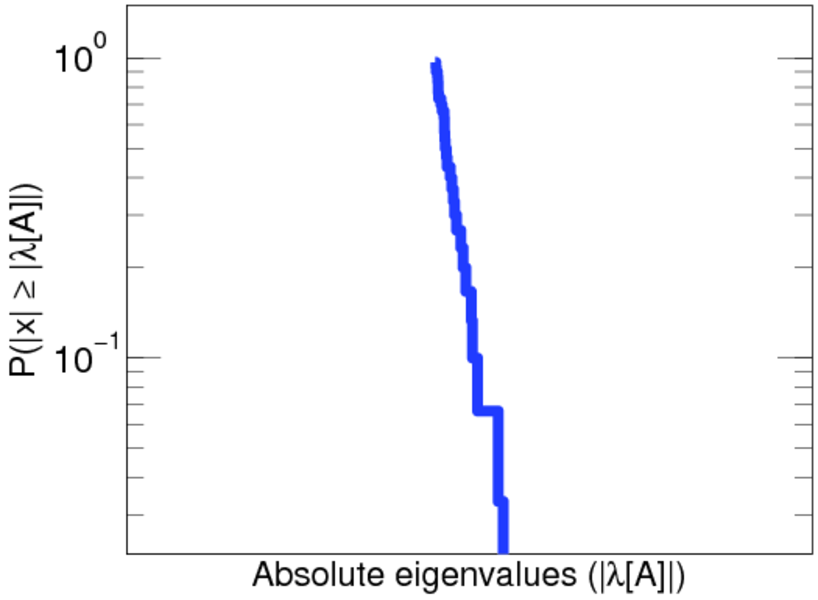
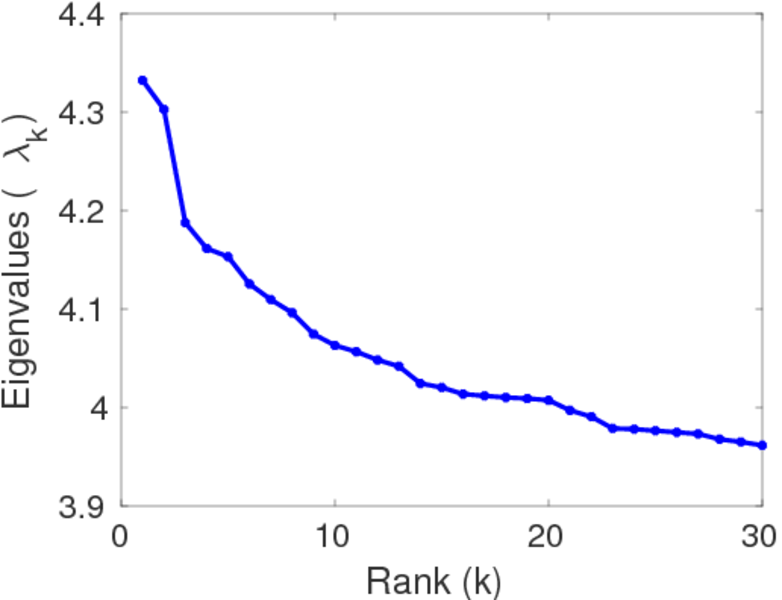
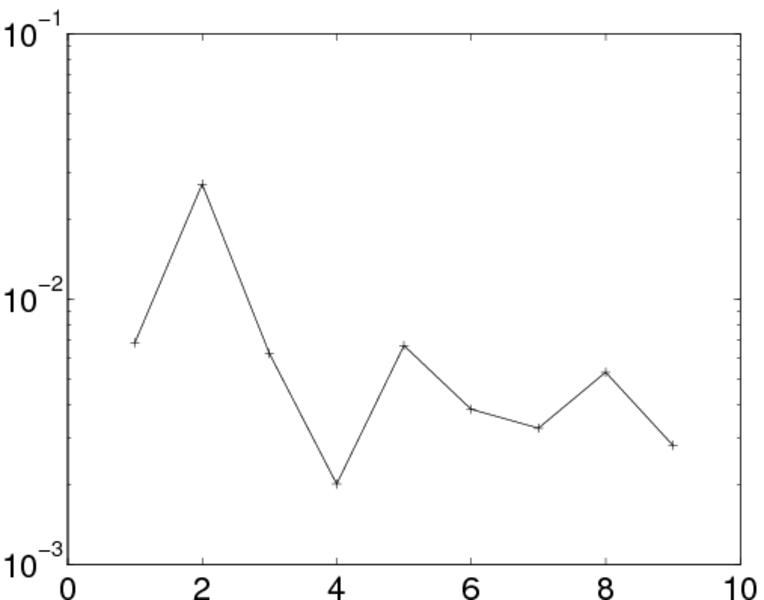
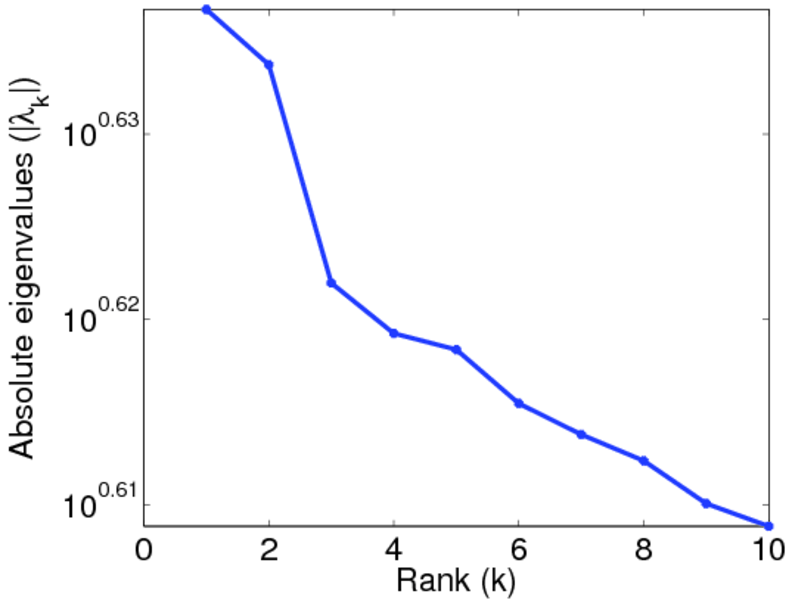
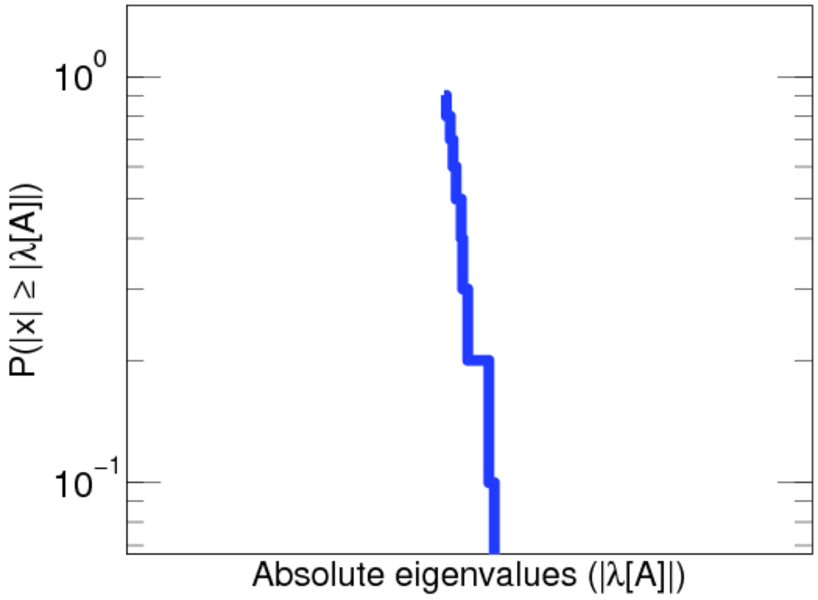
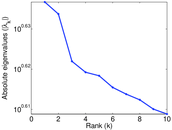
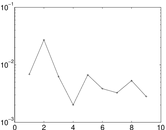
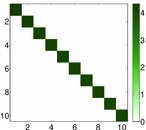
Matrix decompositions plots


Downloads
References
|
[1]
|
Jérôme Kunegis.
KONECT – The Koblenz Network Collection.
In Proc. Int. Conf. on World Wide Web Companion, pages
1343–1350, 2013.
[ http ]
|
 KONECT ‣ Networks ‣
Buy Me a Coffee
KONECT ‣ Networks ‣
Buy Me a Coffee