Discogs
Discogs (short for "discographies") is a large online music database that
provides information about audio records including information about artists,
labels and release details. This bipartite network represents the affiliations
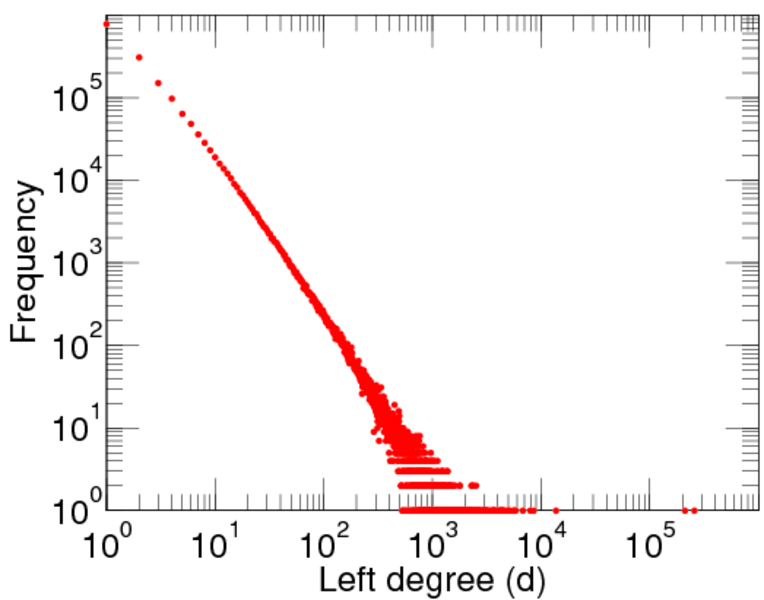
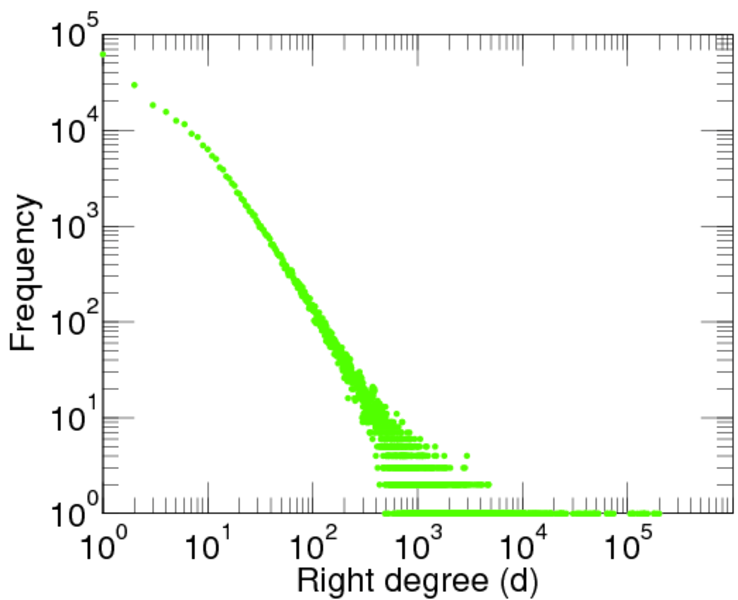
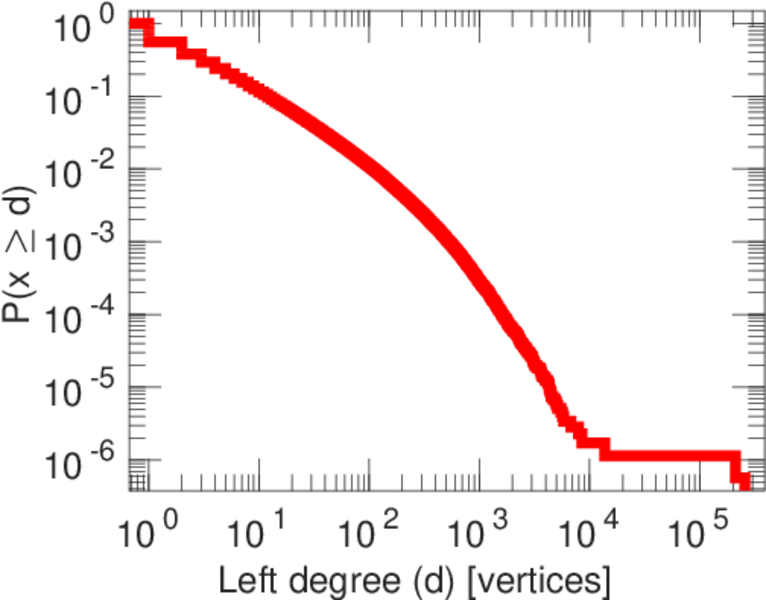
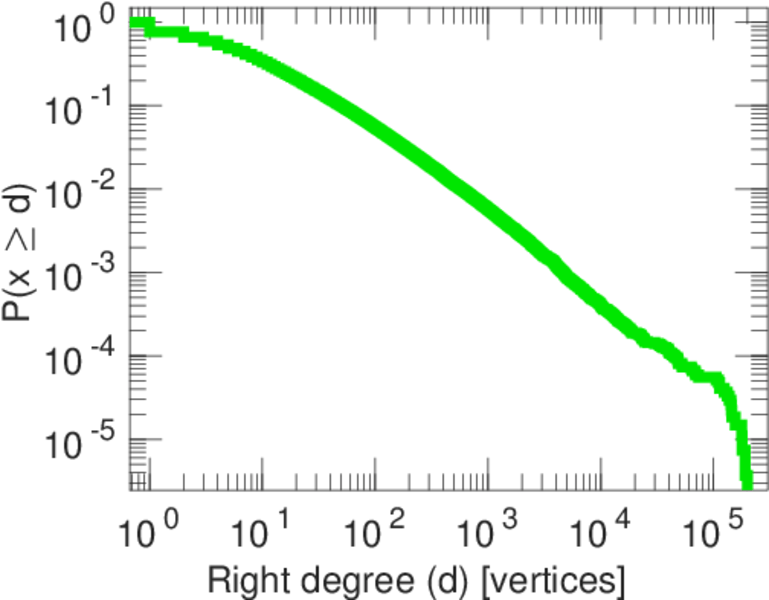
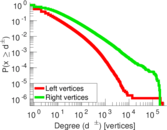
between artists and labels. The left nodes represent artists and the right
nodes represent labels. Each edge represents one release made by an artist with
a label.
Metadata
Statistics
| Size | n = | 2,025,594
|
| Left size | n1 = | 1,754,823
|
| Right size | n2 = | 270,771
|
| Volume | m = | 14,414,659
|
| Unique edge count | m̿ = | 5,302,276
|
| Wedge count | s = | 13,051,812,272
|
| Claw count | z = | 208,086,141,206,057
|
| Cross count | x = | 3,769,613,215,333,388,288
|
| Square count | q = | 3,261,758,502
|
| 4-Tour count | T4 = | 78,312,501,992
|
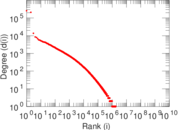
| Maximum degree | dmax = | 257,360
|
| Maximum left degree | d1max = | 257,360
|
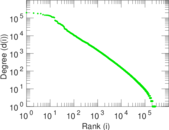
| Maximum right degree | d2max = | 199,896
|
| Average degree | d = | 14.232 5
|
| Average left degree | d1 = | 8.214 31
|
| Average right degree | d2 = | 53.235 6
|
| Fill | p = | 1.115 90 × 10−5
|
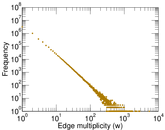
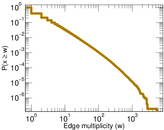
| Average edge multiplicity | m̃ = | 2.718 58
|
| Size of LCC | N = | 1,924,972
|
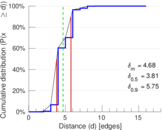
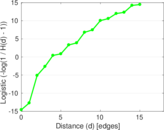
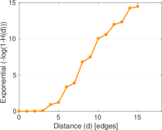
| Diameter | δ = | 22
|
| 50-Percentile effective diameter | δ0.5 = | 3.806 12
|
| 90-Percentile effective diameter | δ0.9 = | 5.753 49
|
| Median distance | δM = | 4
|
| Mean distance | δm = | 4.678 53
|
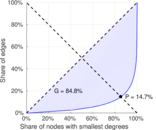
| Gini coefficient | G = | 0.861 672
|
| Balanced inequality ratio | P = | 0.138 158
|
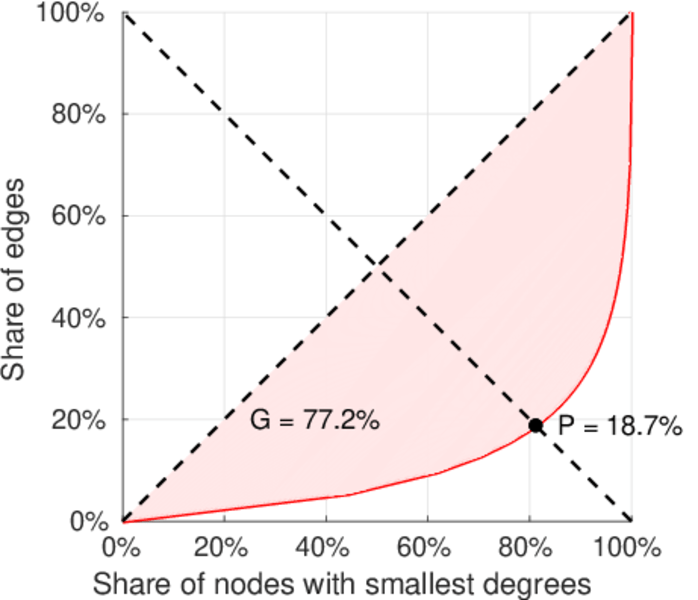
| Left balanced inequality ratio | P1 = | 0.186 605
|
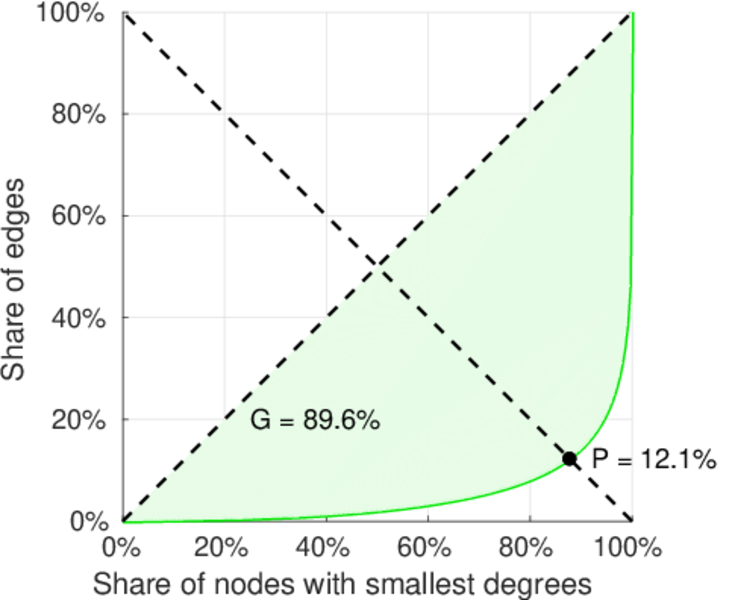
| Right balanced inequality ratio | P2 = | 0.121 320
|
| Relative edge distribution entropy | Her = | 0.857 945
|
| Power law exponent | γ = | 2.539 89
|
| Tail power law exponent | γt = | 2.321 00
|
| Tail power law exponent with p | γ3 = | 2.321 00
|
| p-value | p = | 0.049 000 0
|
| Left tail power law exponent with p | γ3,1 = | 2.211 00
|
| Left p-value | p1 = | 0.000 00
|
| Right tail power law exponent with p | γ3,2 = | 2.111 00
|
| Right p-value | p2 = | 0.000 00
|
| Degree assortativity | ρ = | −0.039 421 6
|
| Degree assortativity p-value | pρ = | 0.000 00
|
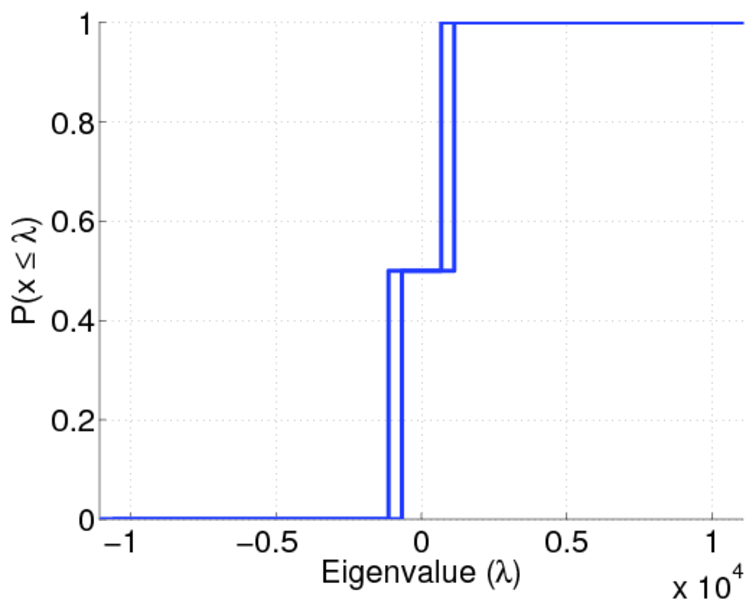
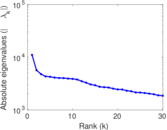
| Spectral norm | α = | 11,073.1
|
| Spectral separation | |λ1[A] / λ2[A]| = | 1.955 97
|
| Controllability | C = | 1,528,426
|
| Relative controllability | Cr = | 0.754 557
|
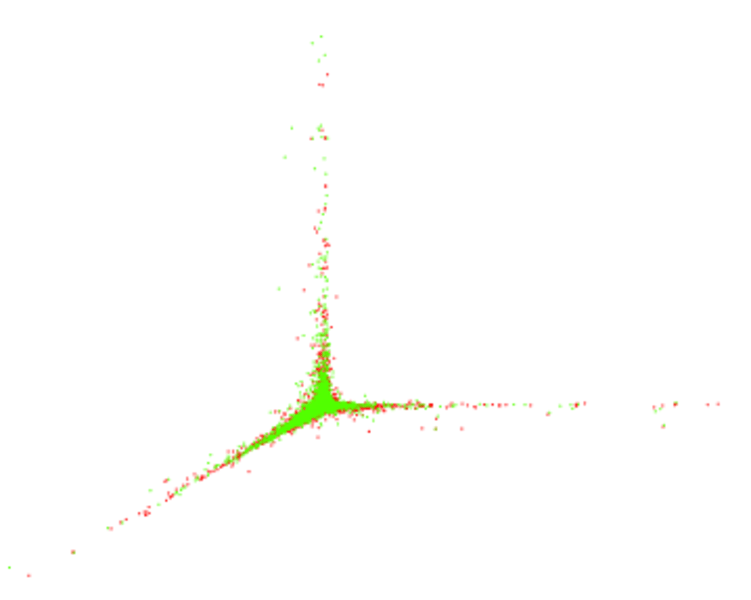
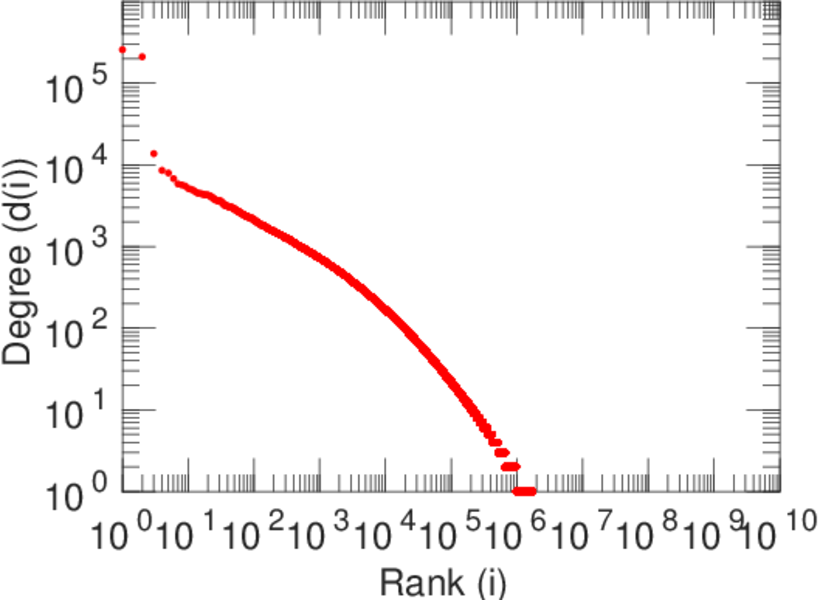
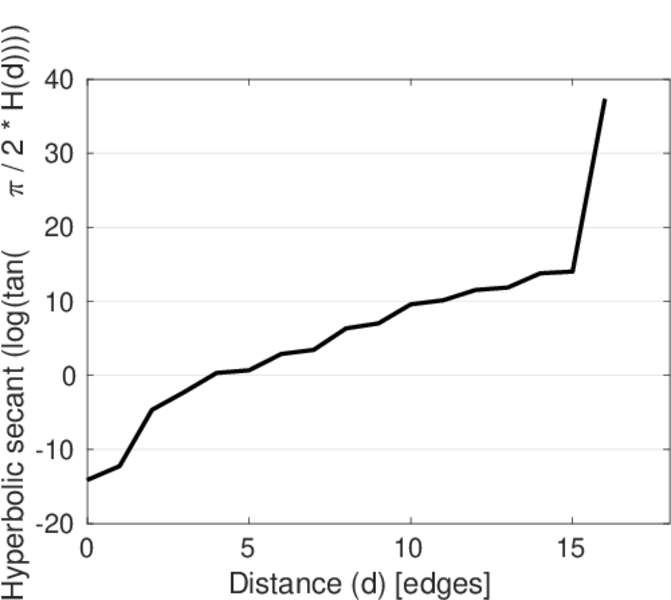
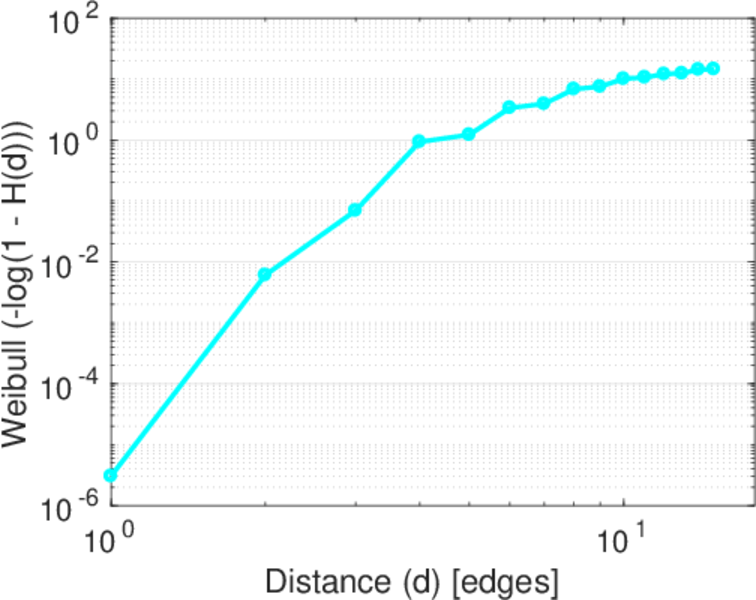
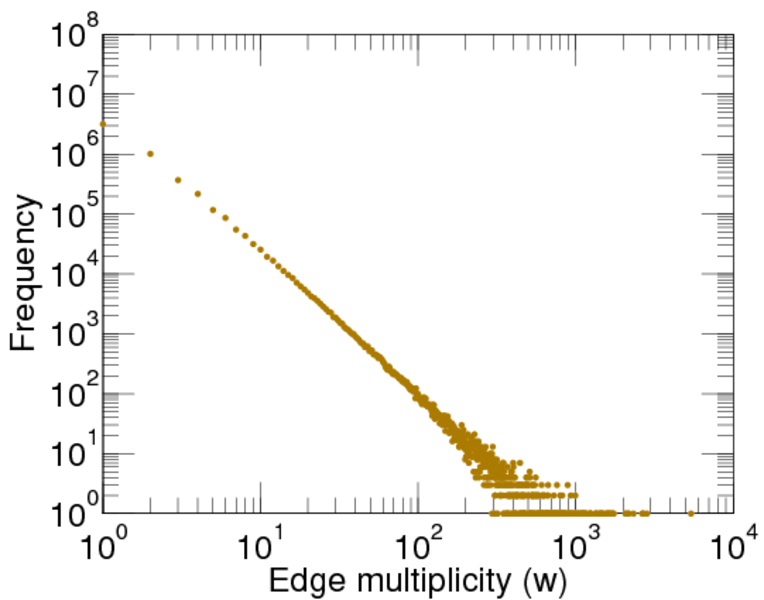
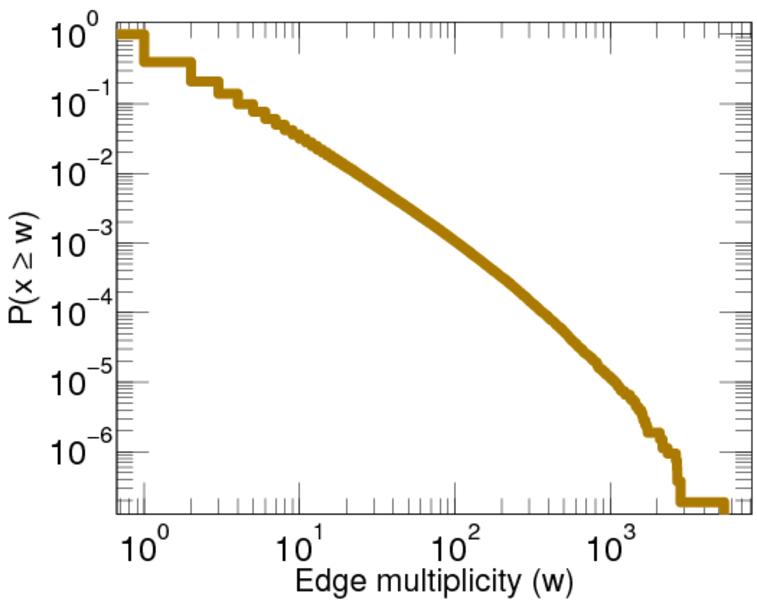
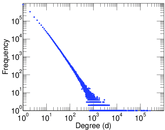
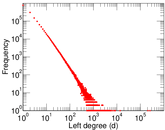
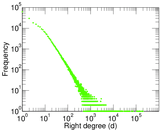
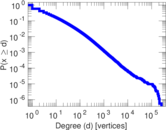
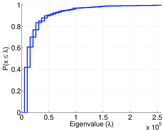
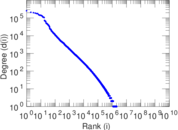
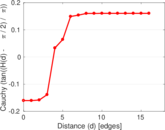
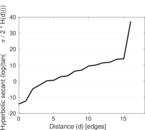
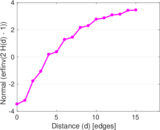
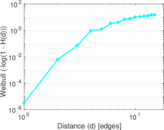
Plots


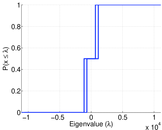
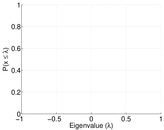
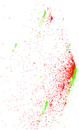
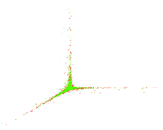

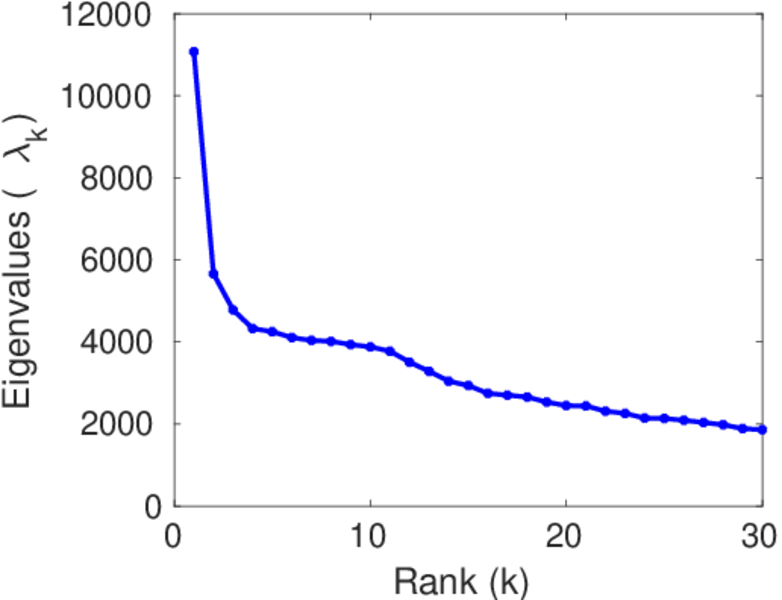
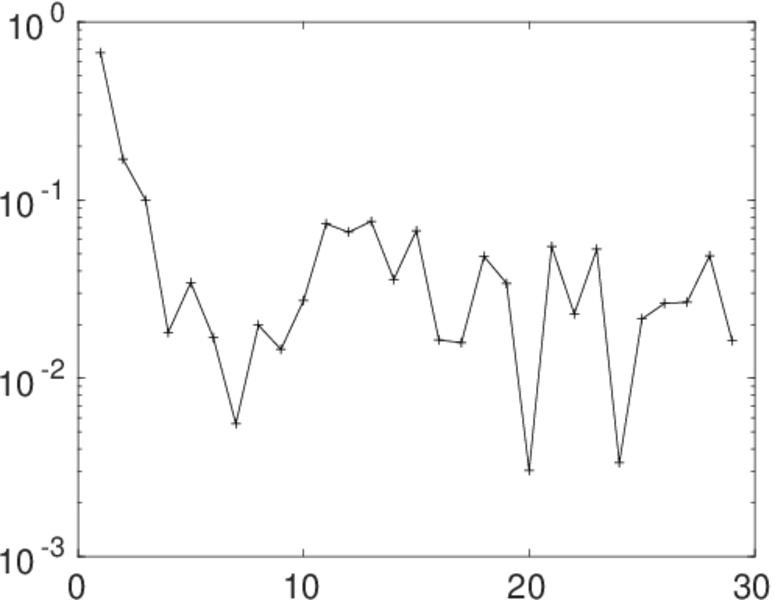
Matrix decompositions plots


Downloads
References
|
[1]
|
Jérôme Kunegis.
KONECT – The Koblenz Network Collection.
In Proc. Int. Conf. on World Wide Web Companion, pages
1343–1350, 2013.
[ http ]
|
 KONECT ‣ Networks ‣
Buy Me a Coffee
KONECT ‣ Networks ‣
Buy Me a Coffee