Discogs label–style
Discogs (short for "discographies") is a large online music database that
provides information about audio records including information about artists,
labels and release details. Each edge of this bipartite network connects a
label and a style. An edge indicates that the label was involved in the
production of a release of the style. Releases can have multiple styles. The
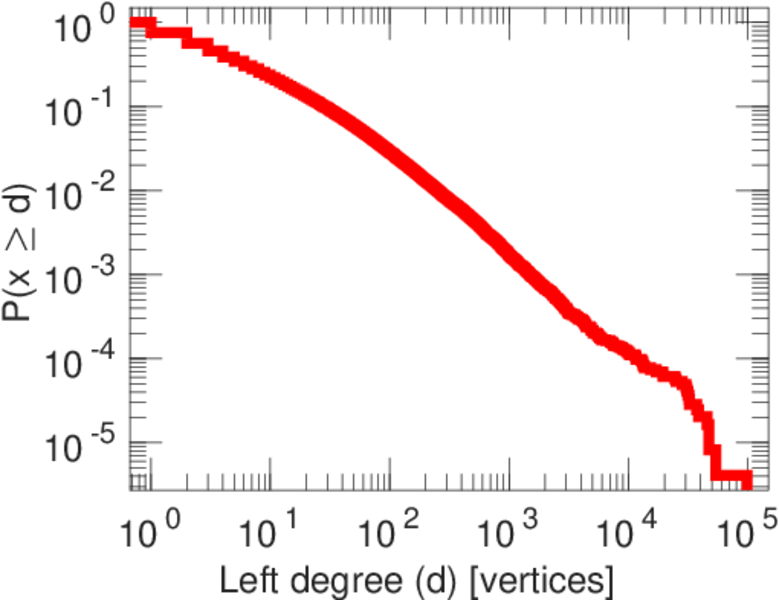
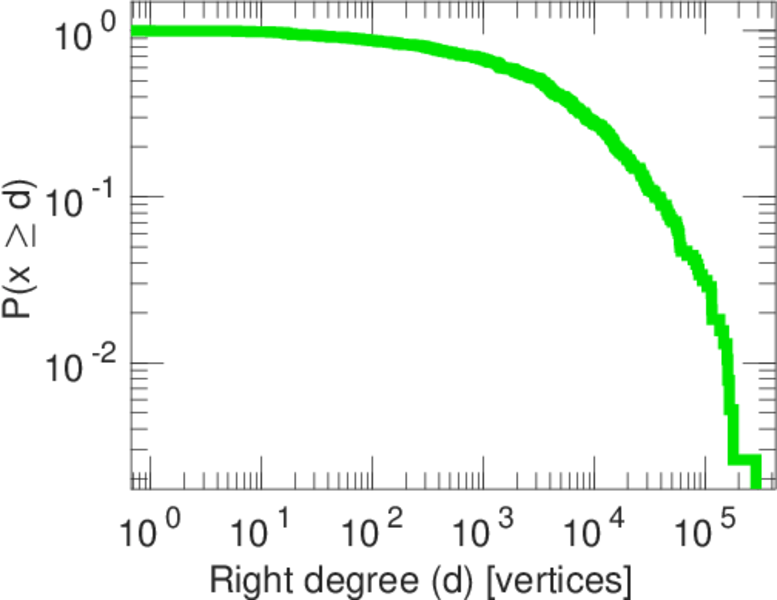
left nodes represent labels and the right nodes represent styles.
Metadata
Statistics
| Size | n = | 244,147
|
| Left size | n1 = | 243,764
|
| Right size | n2 = | 383
|
| Volume | m = | 5,255,950
|
| Unique edge count | m̿ = | 1,064,853
|
| Wedge count | s = | 5,820,293,288
|
| Claw count | z = | 36,106,246,831,981
|
| Cross count | x = | 211,425,343,527,647,648
|
| Square count | q = | 5,232,874,697
|
| 4-Tour count | T4 = | 65,147,206,418
|
| Maximum degree | dmax = | 285,519
|
| Maximum left degree | d1max = | 98,683
|
| Maximum right degree | d2max = | 285,519
|
| Average degree | d = | 43.055 6
|
| Average left degree | d1 = | 21.561 6
|
| Average right degree | d2 = | 13,723.1
|
| Fill | p = | 0.011 405 7
|
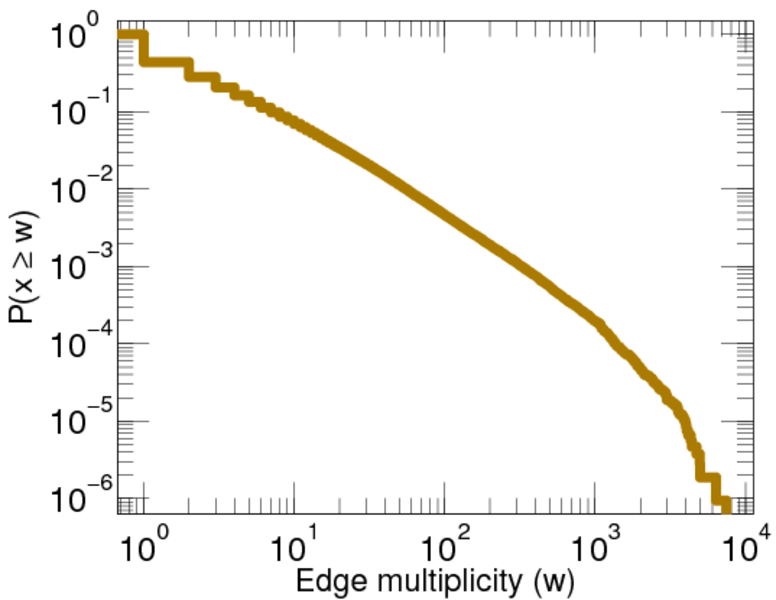
| Average edge multiplicity | m̃ = | 4.935 85
|
| Size of LCC | N = | 244,147
|
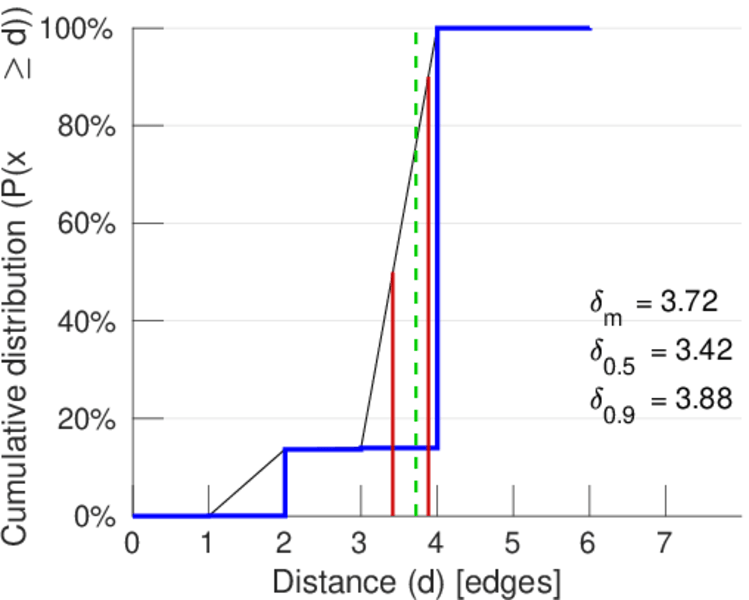
| Diameter | δ = | 7
|
| 50-Percentile effective diameter | δ0.5 = | 3.418 84
|
| 90-Percentile effective diameter | δ0.9 = | 3.883 80
|
| Median distance | δM = | 4
|
| Mean distance | δm = | 3.723 83
|
| Gini coefficient | G = | 0.921 496
|
| Balanced inequality ratio | P = | 0.100 002
|
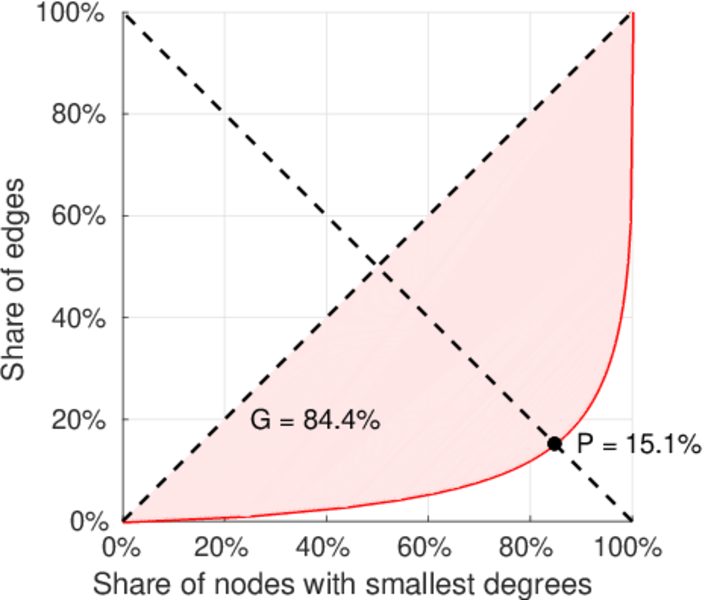
| Left balanced inequality ratio | P1 = | 0.150 738
|
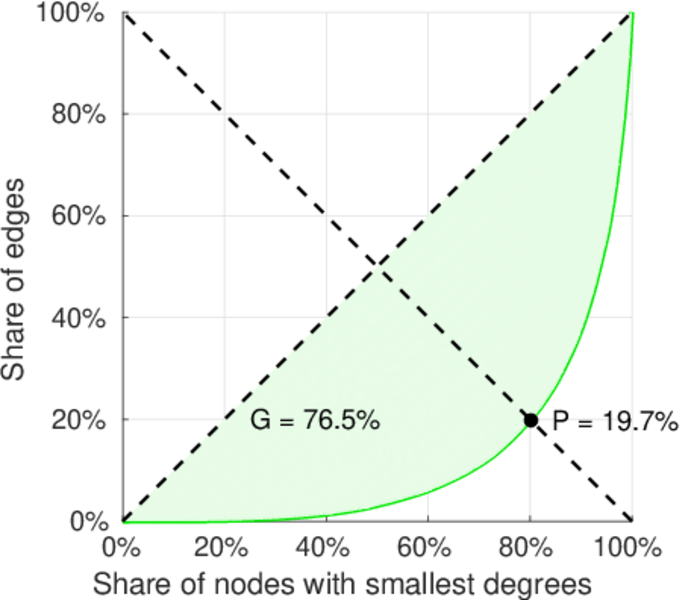
| Right balanced inequality ratio | P2 = | 0.196 689
|
| Relative edge distribution entropy | Her = | 0.733 028
|
| Power law exponent | γ = | 2.037 57
|
| Tail power law exponent | γt = | 2.461 00
|
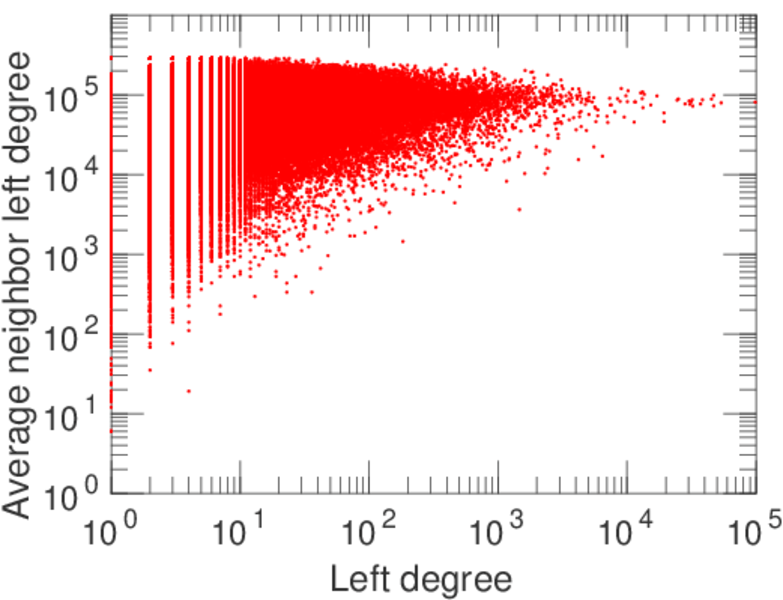
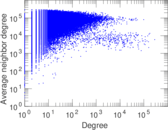
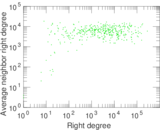
| Degree assortativity | ρ = | −0.180 548
|
| Degree assortativity p-value | pρ = | 0.000 00
|
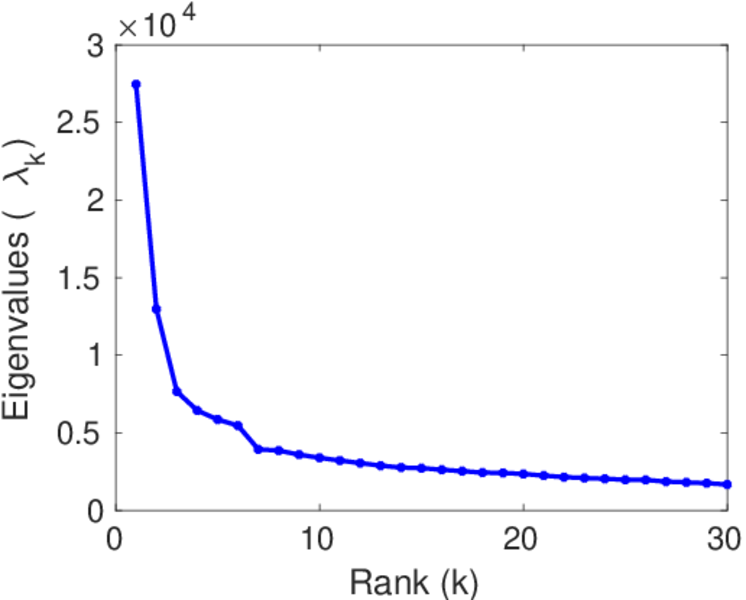
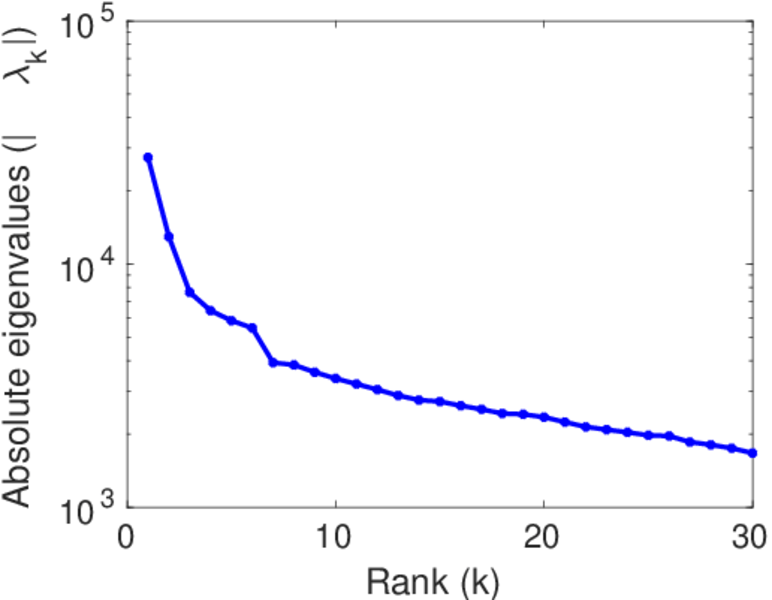
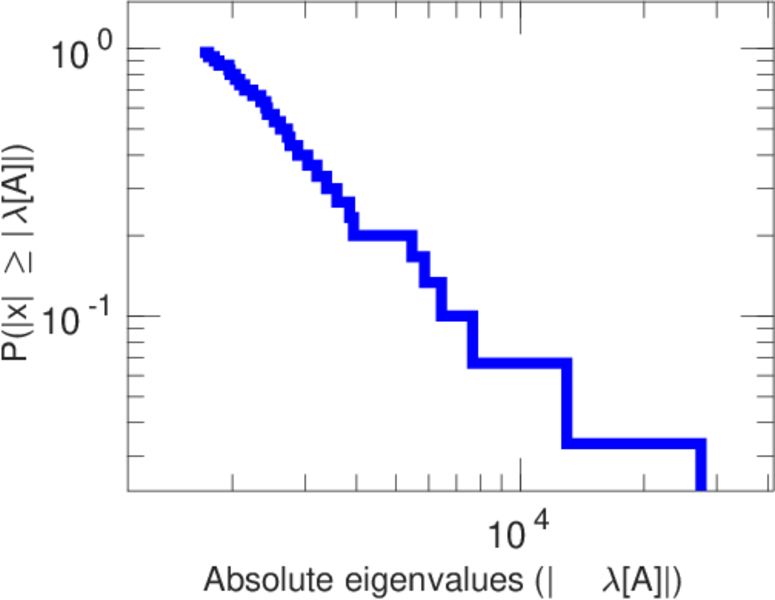
| Spectral norm | α = | 27,460.8
|
| Algebraic connectivity | a = | 0.585 786
|
| Spectral separation | |λ1[A] / λ2[A]| = | 2.116 92
|
| Controllability | C = | 243,381
|
| Relative controllability | Cr = | 0.996 863
|
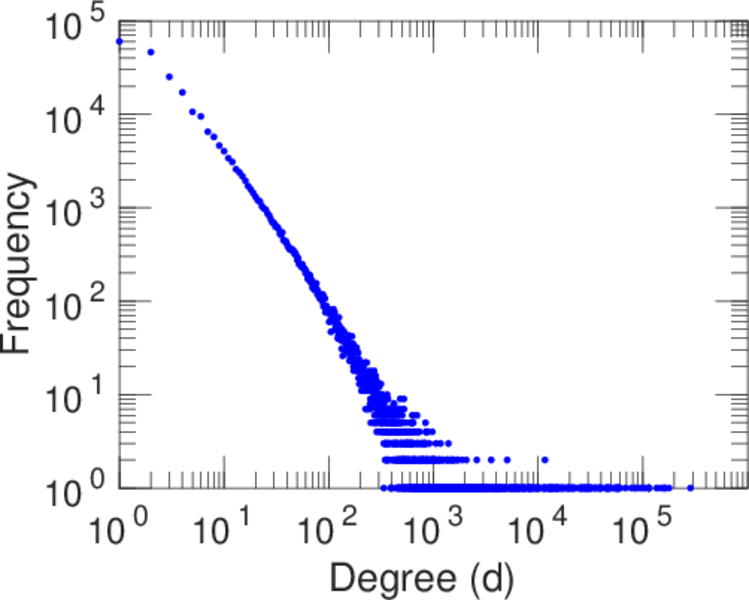
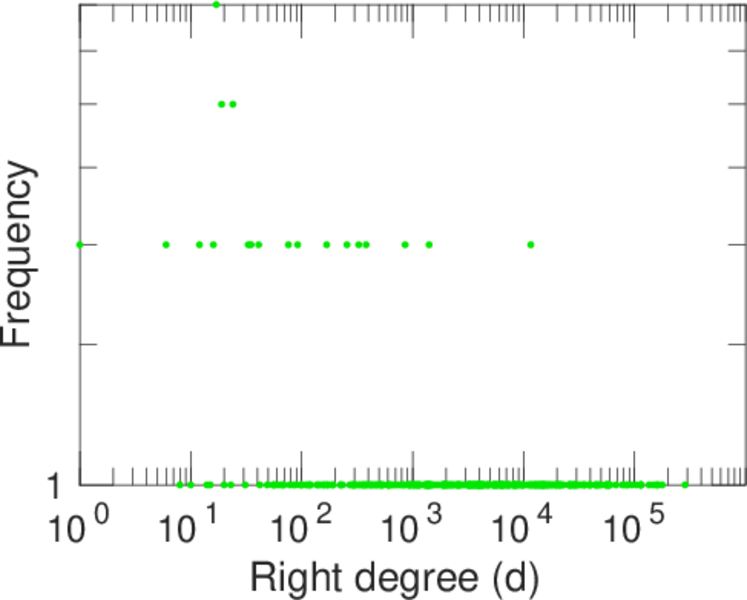
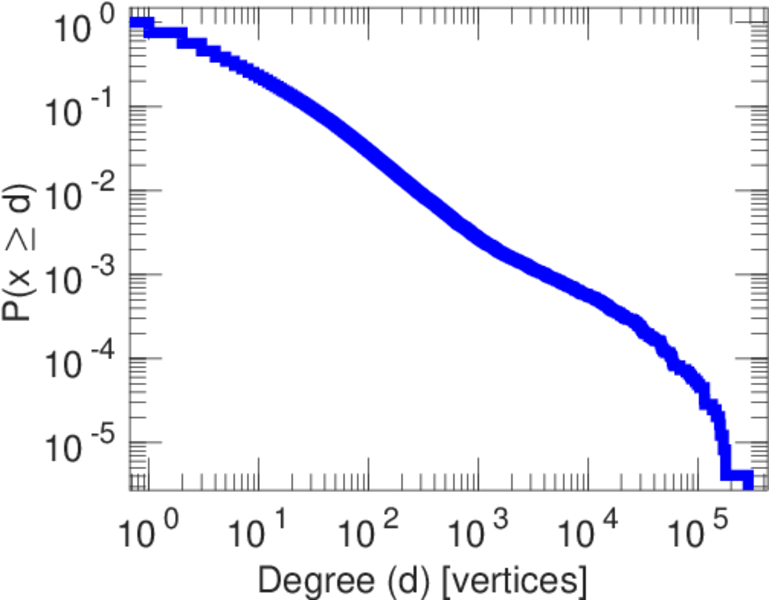
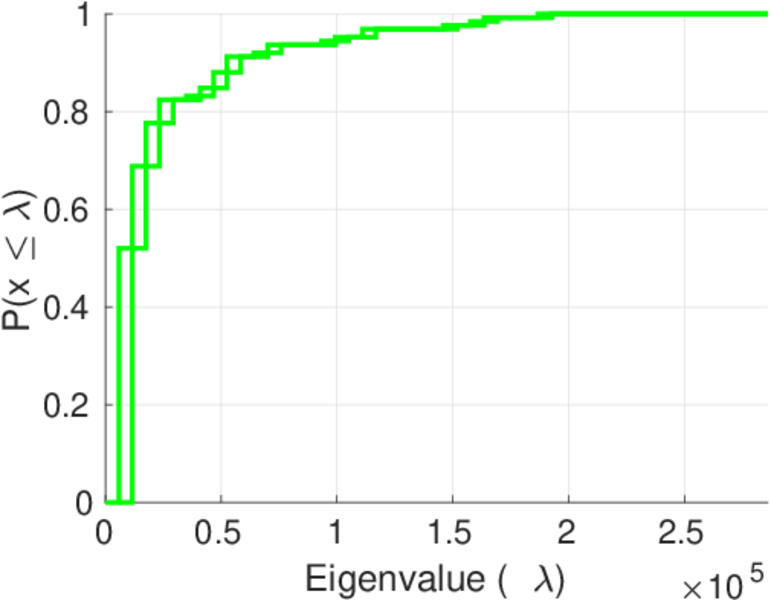
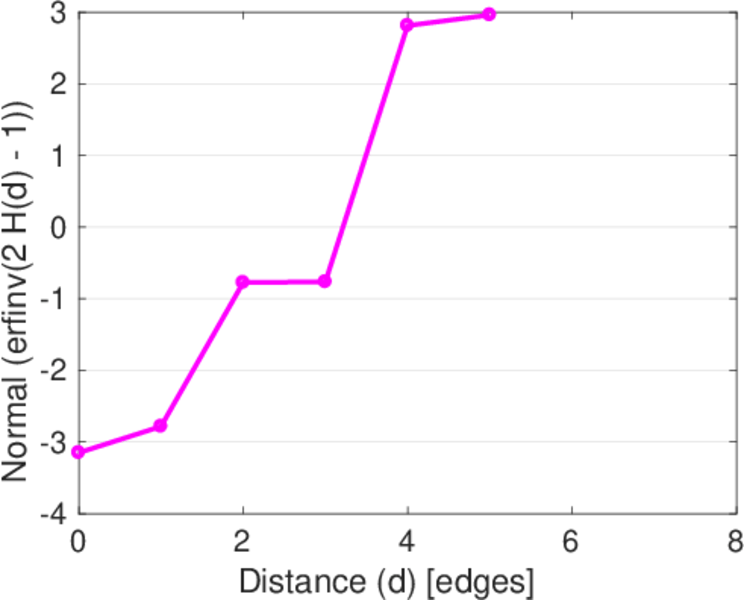
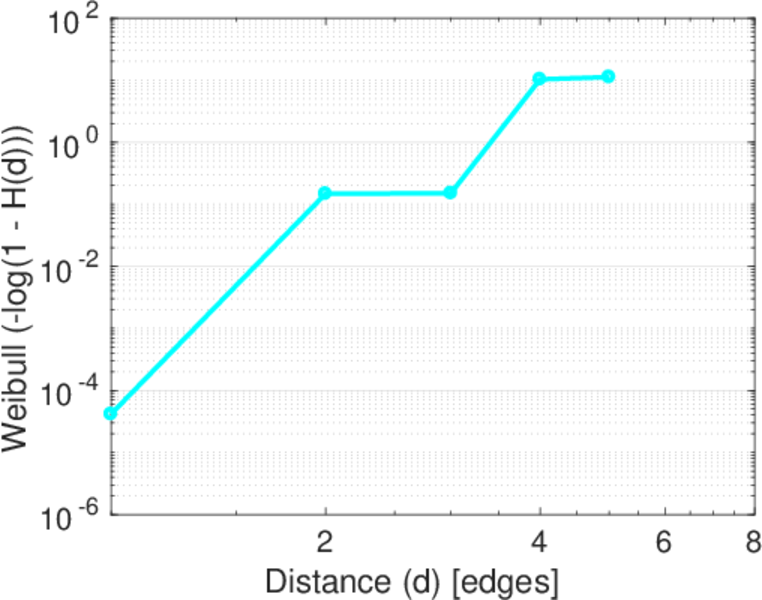
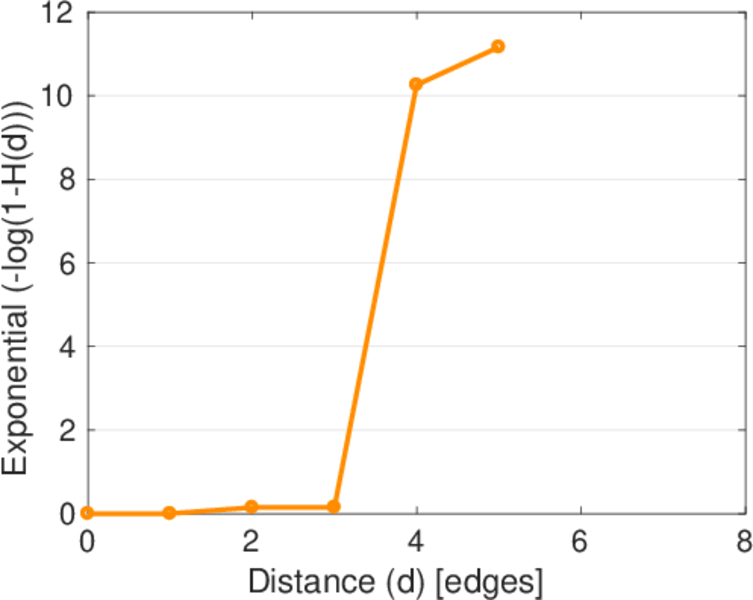
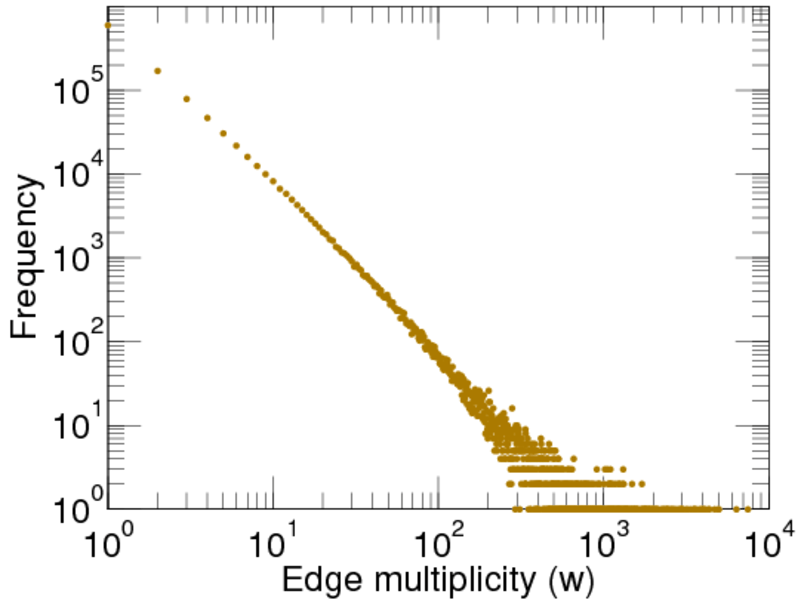
Plots


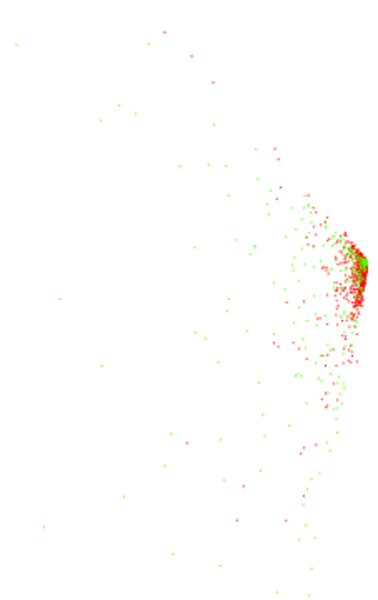
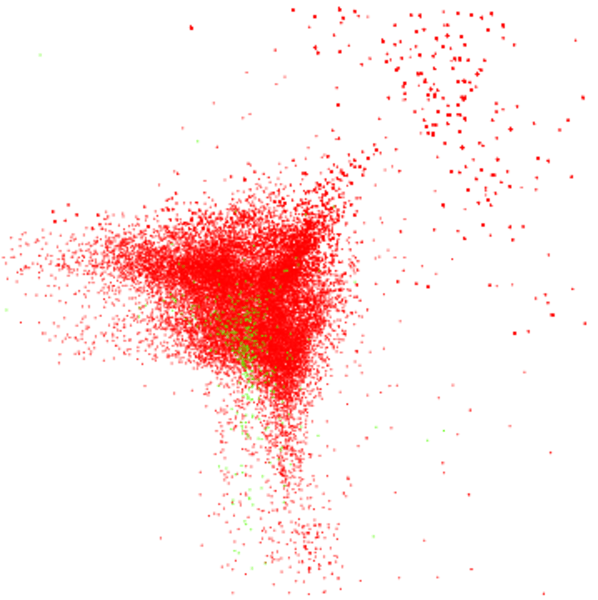
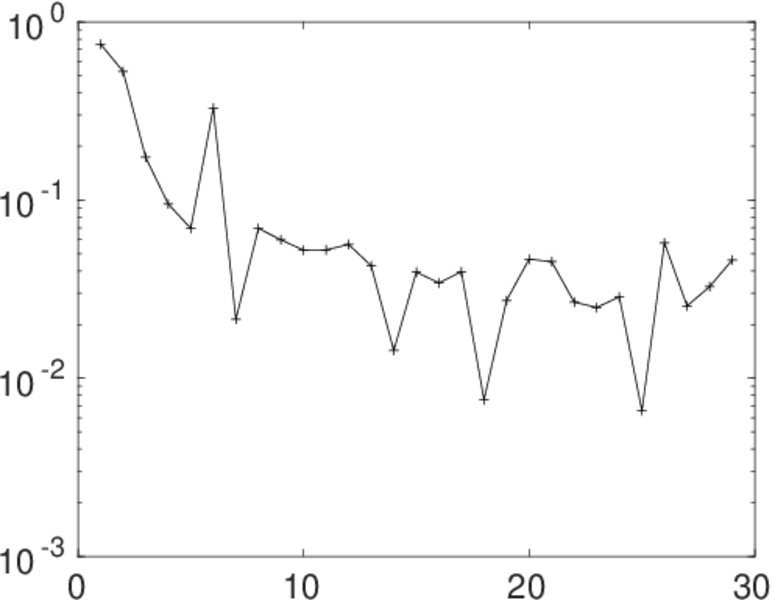
Matrix decompositions plots


Downloads
References
|
[1]
|
Jérôme Kunegis.
KONECT – The Koblenz Network Collection.
In Proc. Int. Conf. on World Wide Web Companion, pages
1343–1350, 2013.
[ http ]
|
 KONECT ‣ Networks ‣
Buy Me a Coffee
KONECT ‣ Networks ‣
Buy Me a Coffee