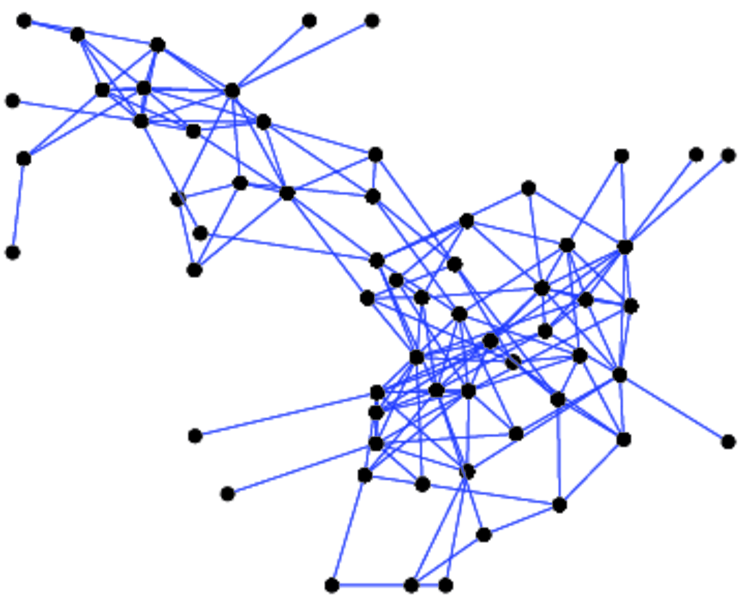
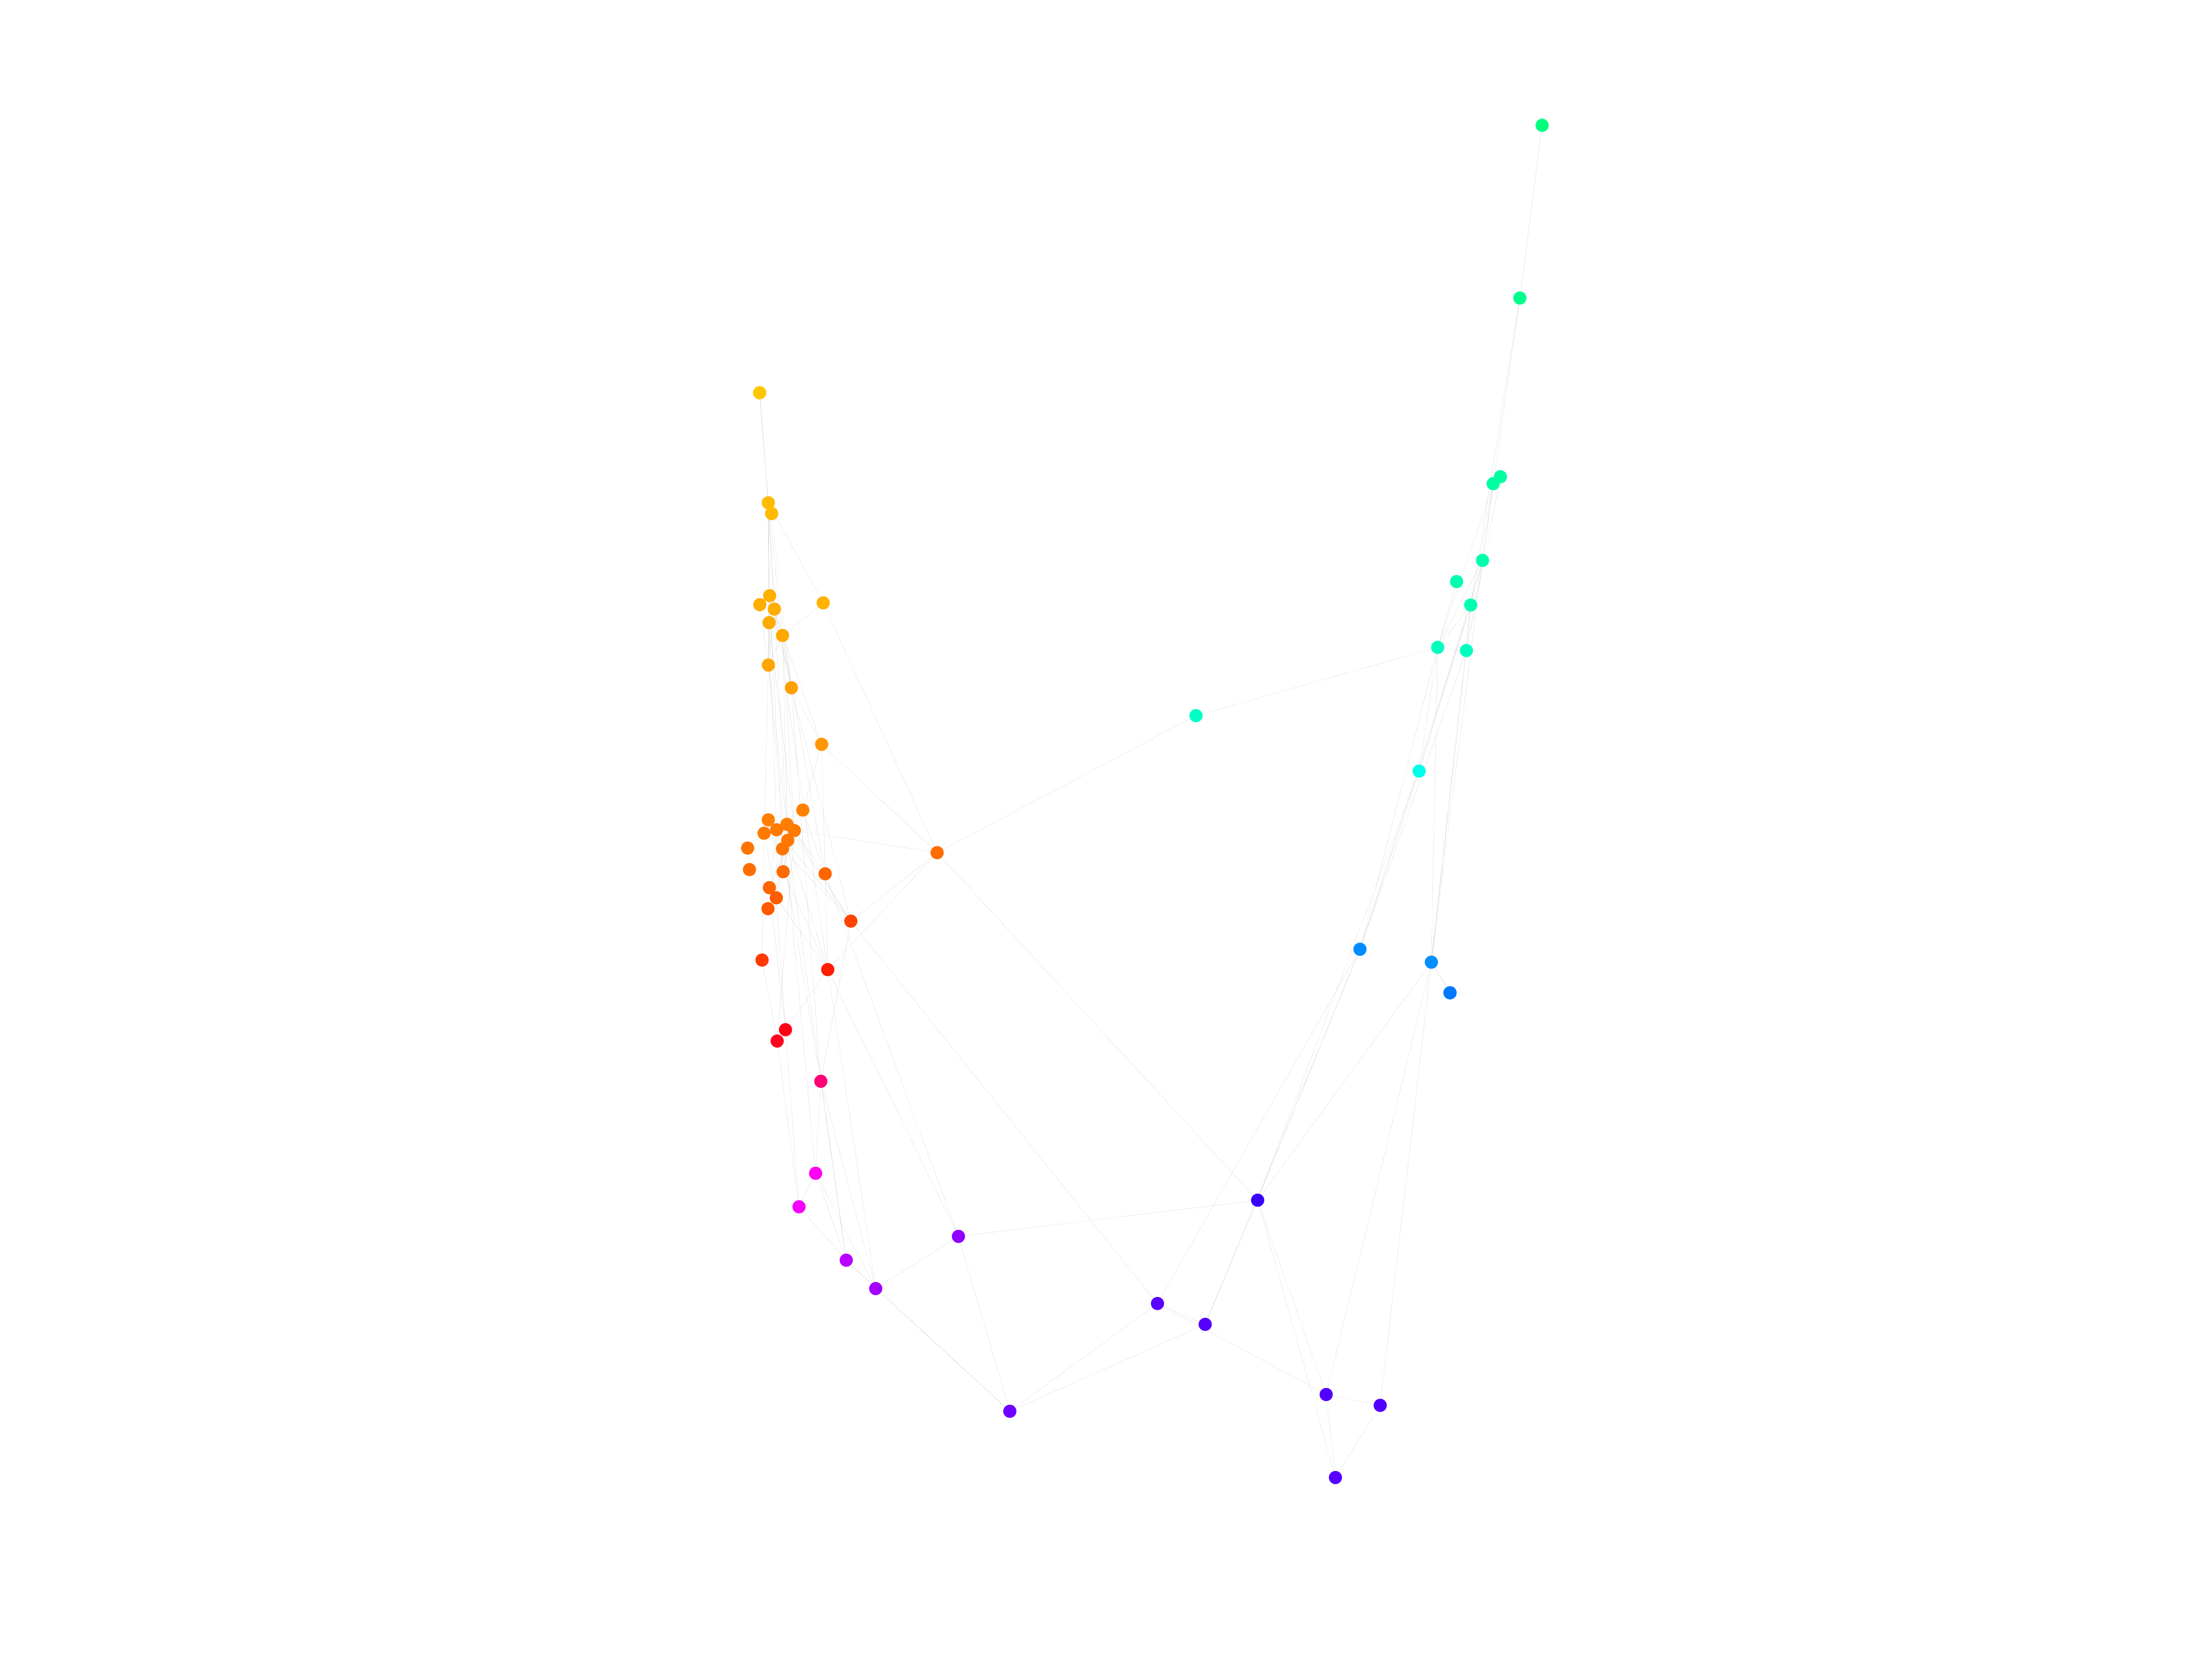
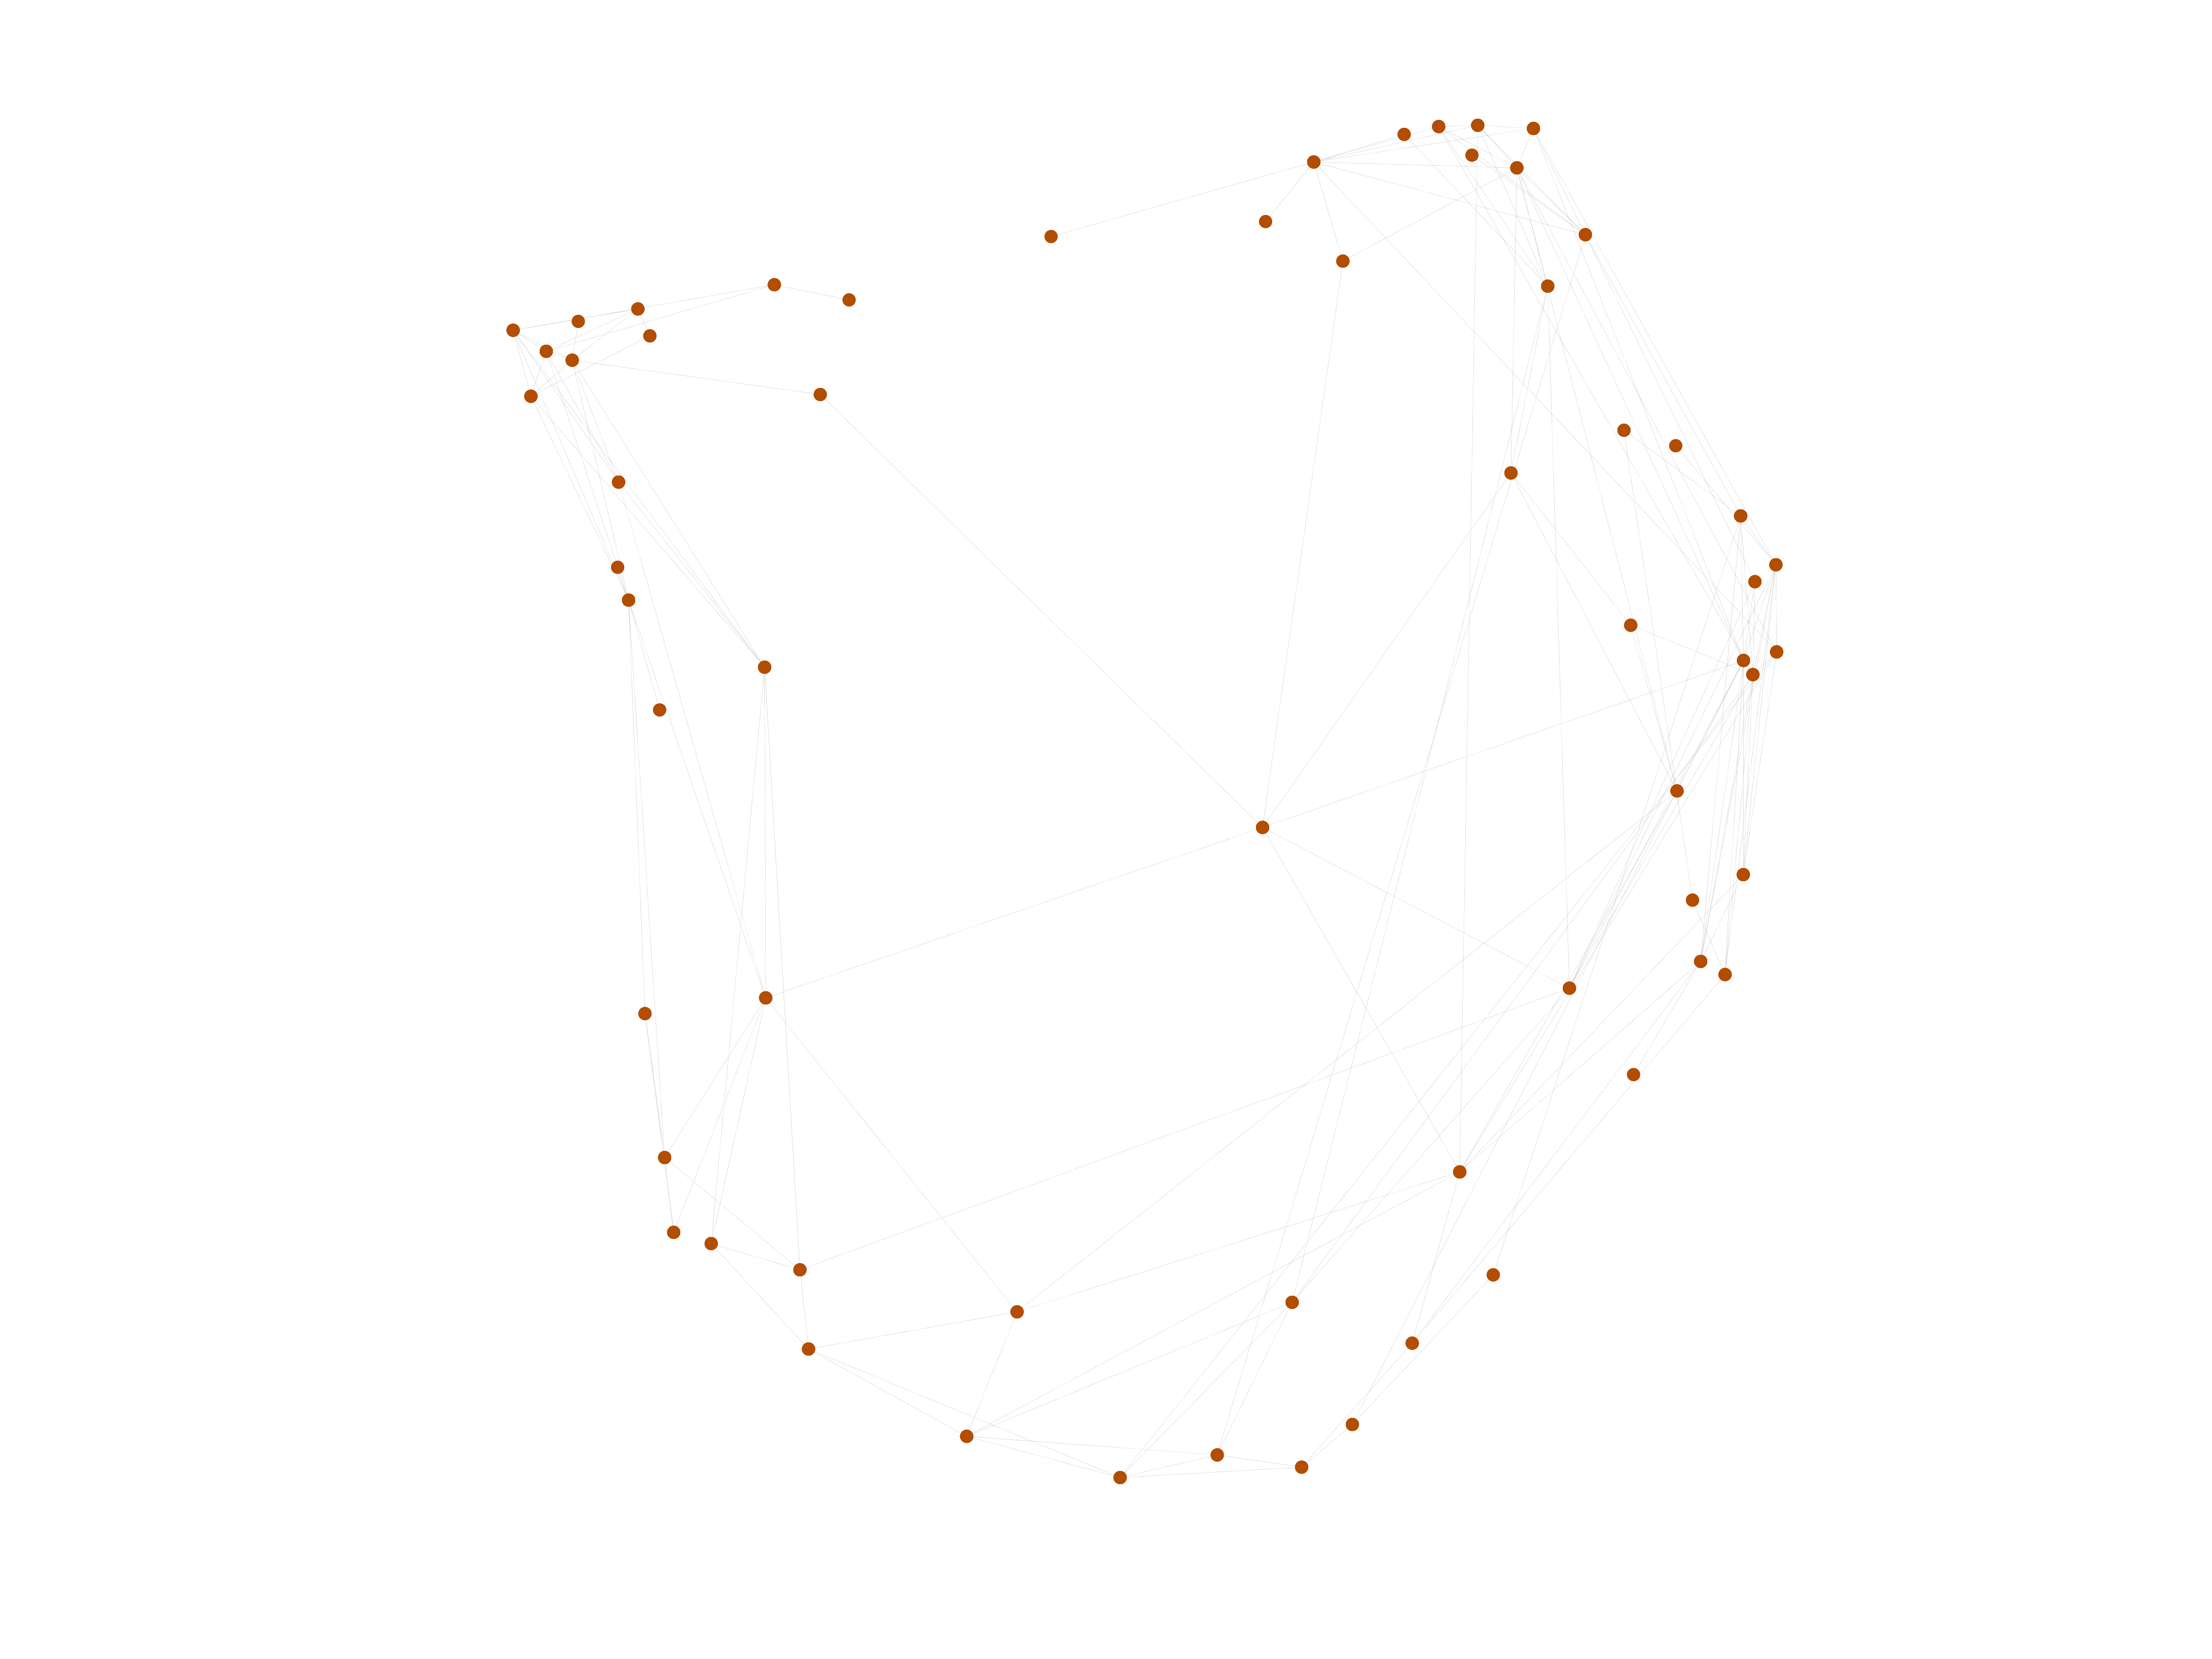
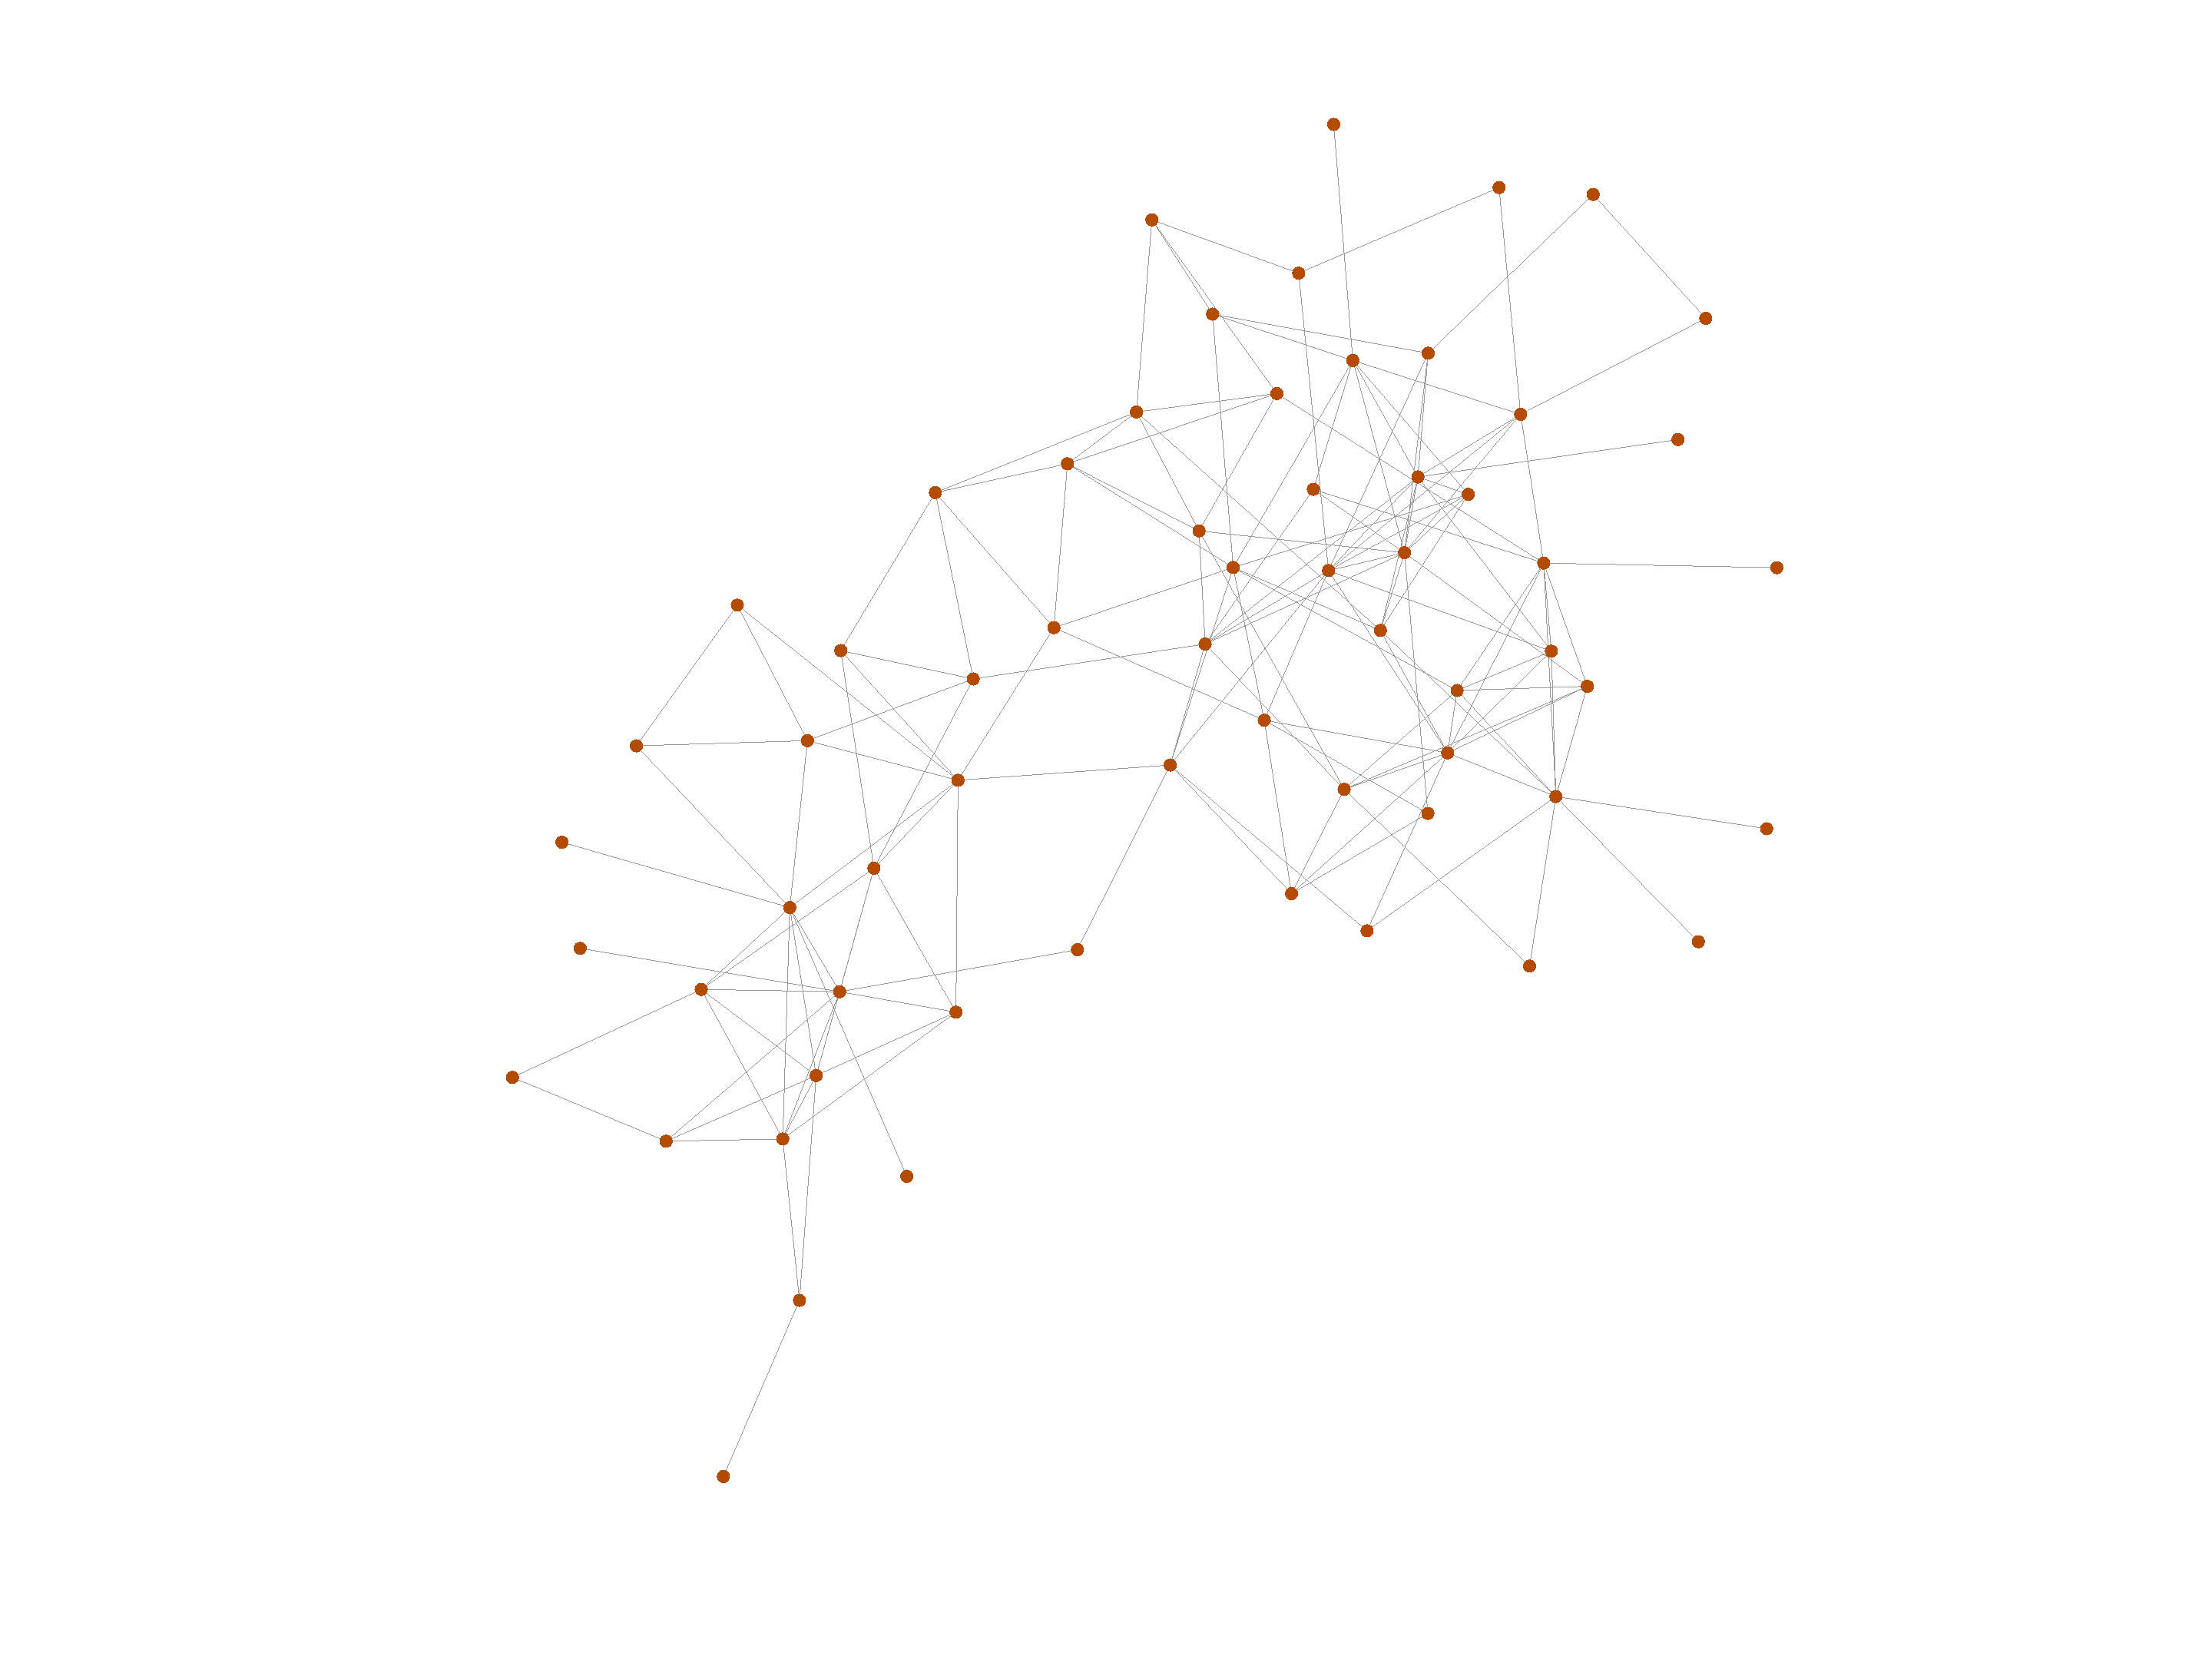
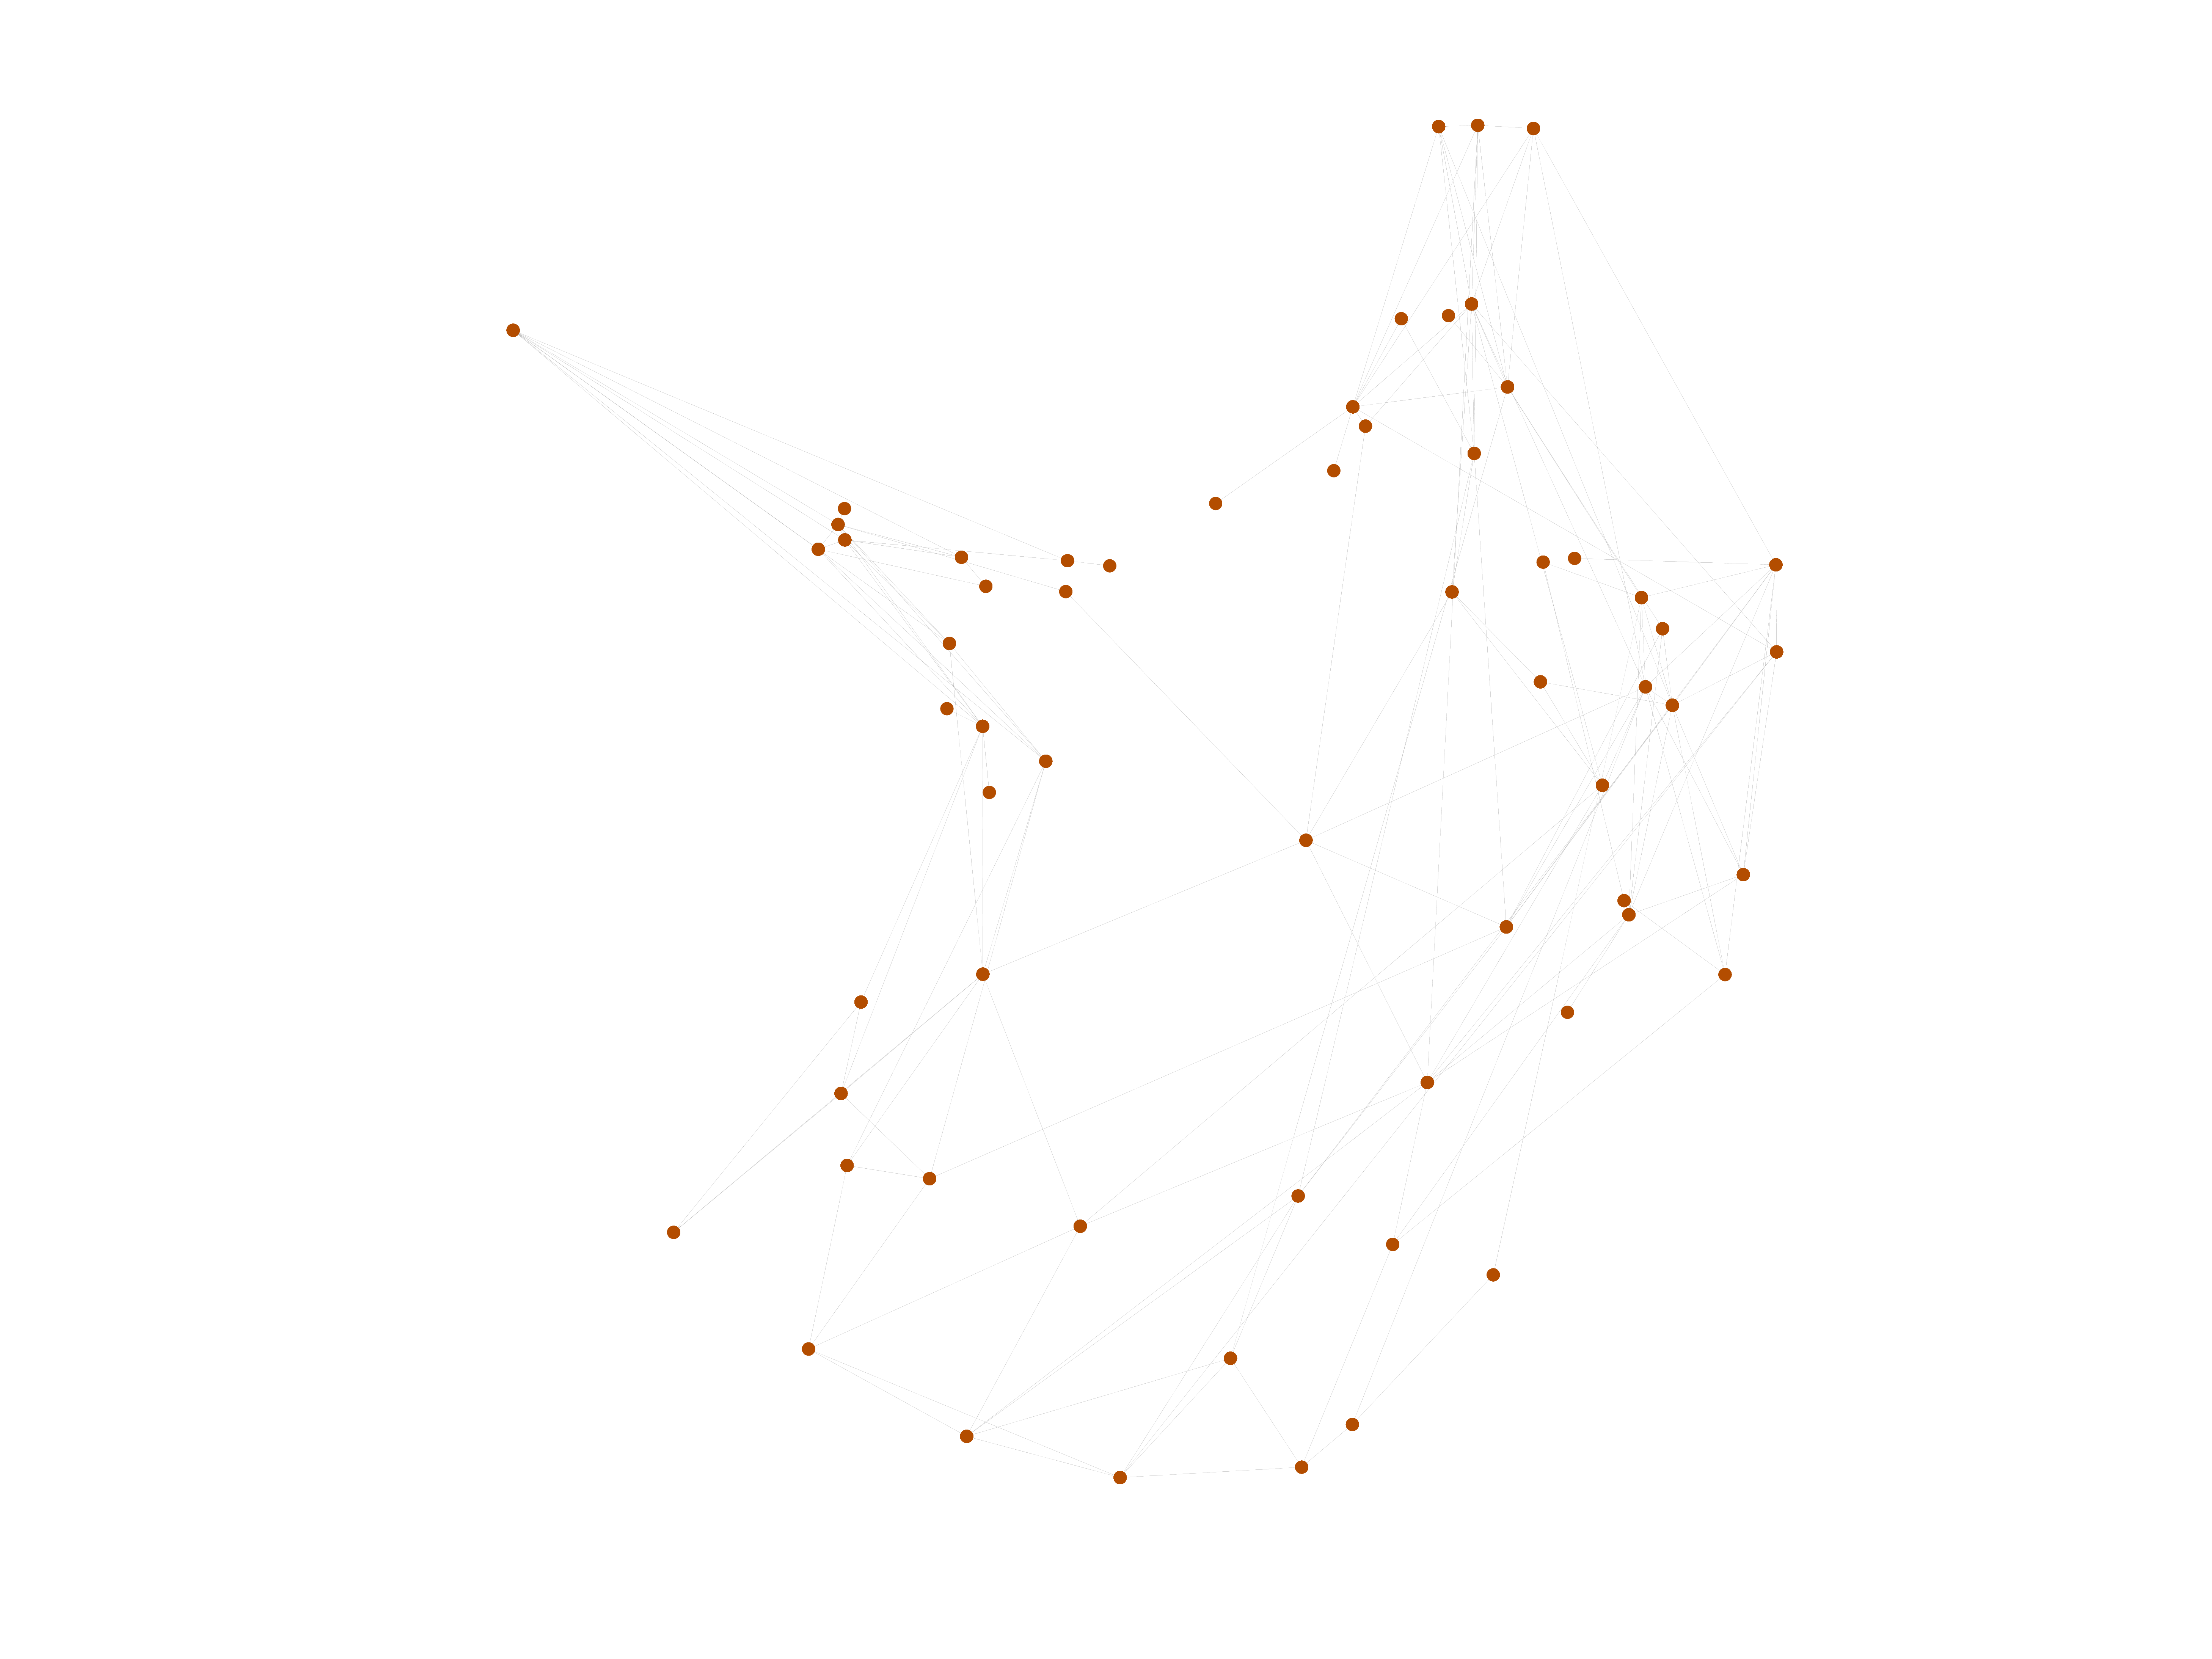
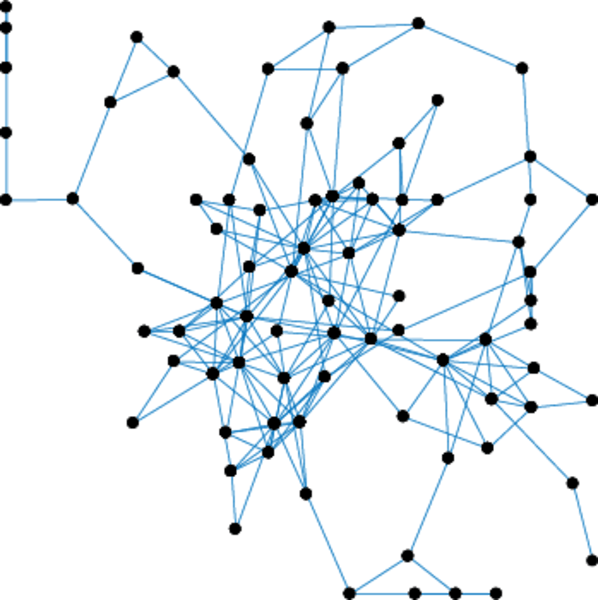
Dolphins
This is a directed social network of bottlenose dolphins. The nodes are the
bottlenose dolphins (genus Tursiops) of a bottlenose dolphin community
living off Doubtful Sound, a fjord in New Zealand (spelled fiord in New
Zealand). An edge indicates a frequent association. The dolphins were
observed between 1994 and 2001.
Metadata
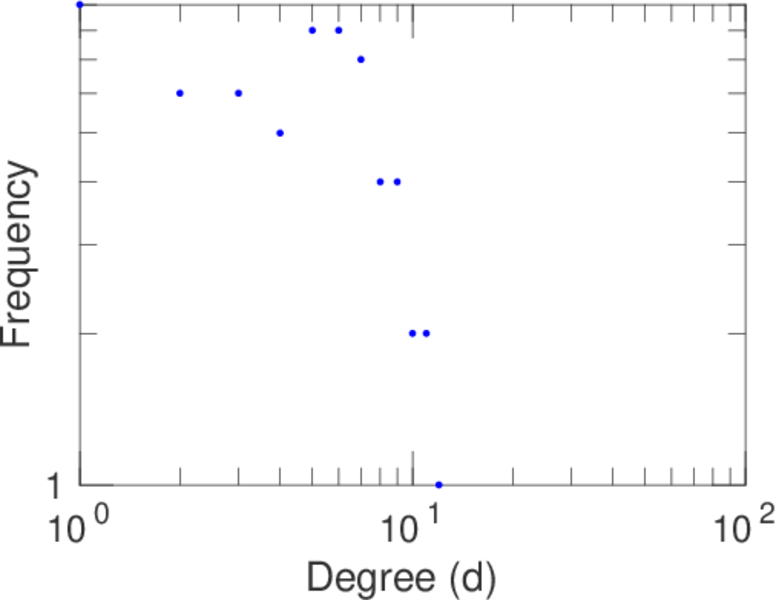
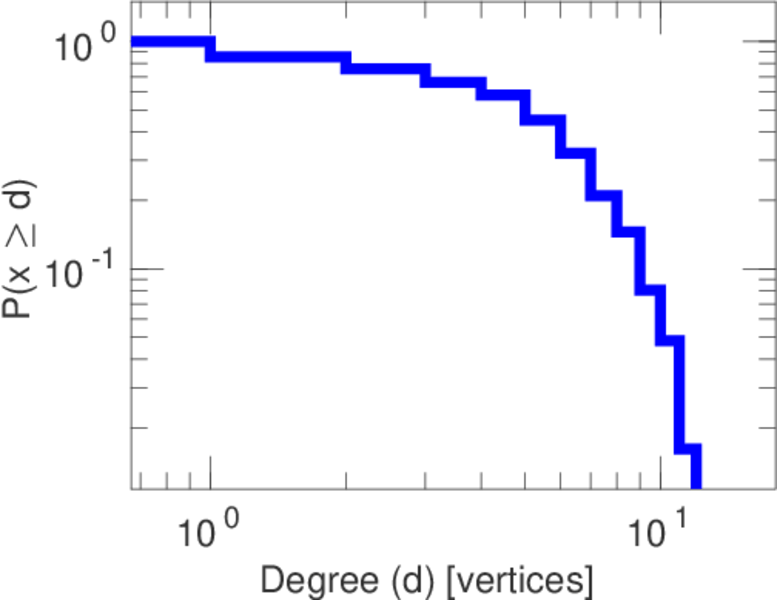
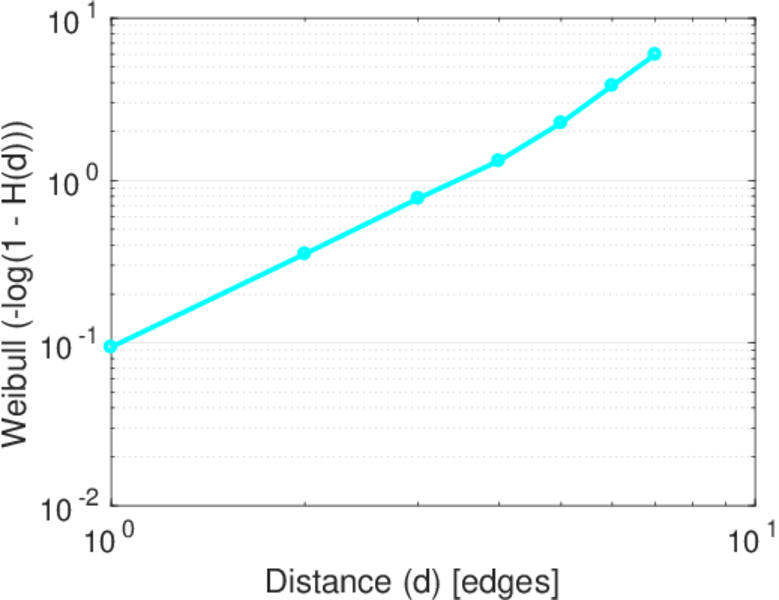
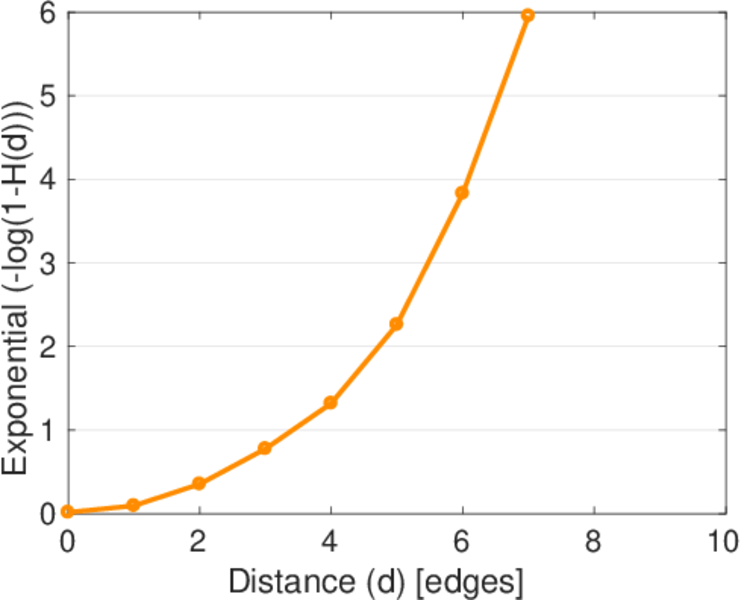
Statistics
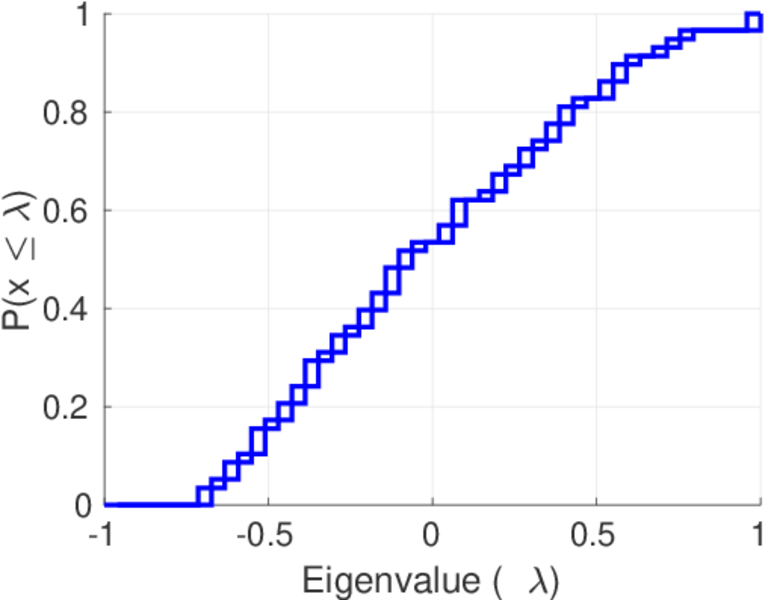
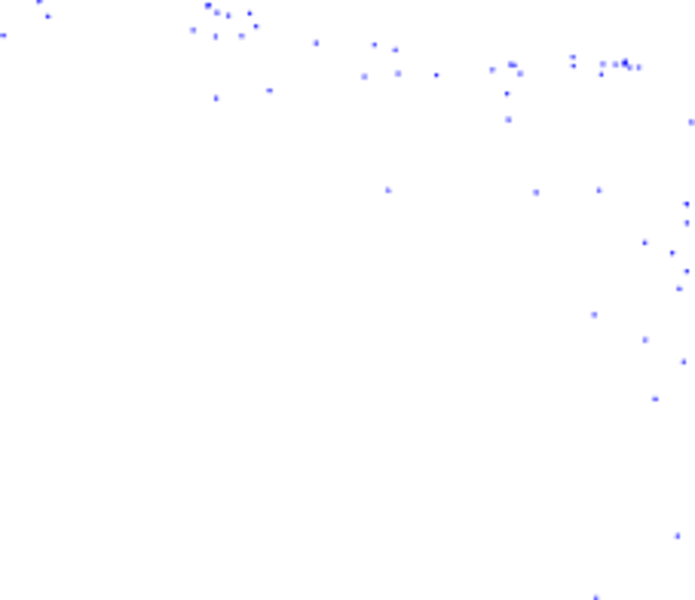
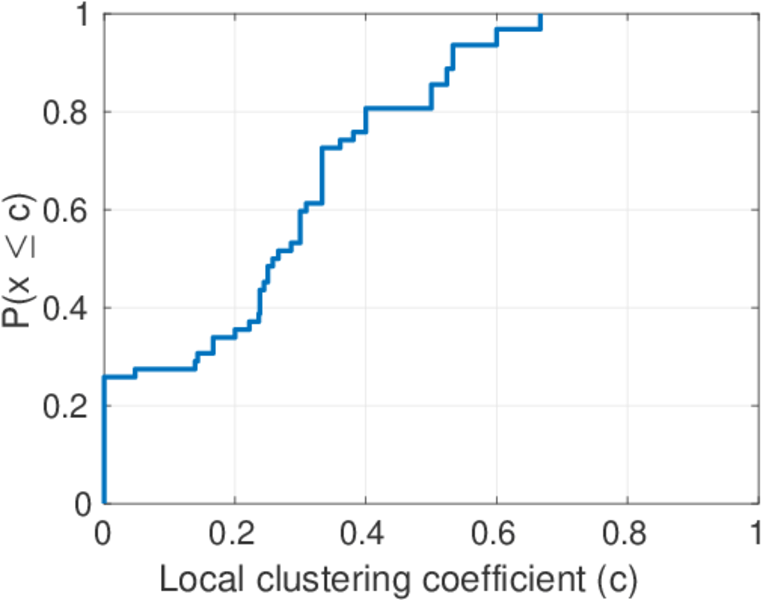
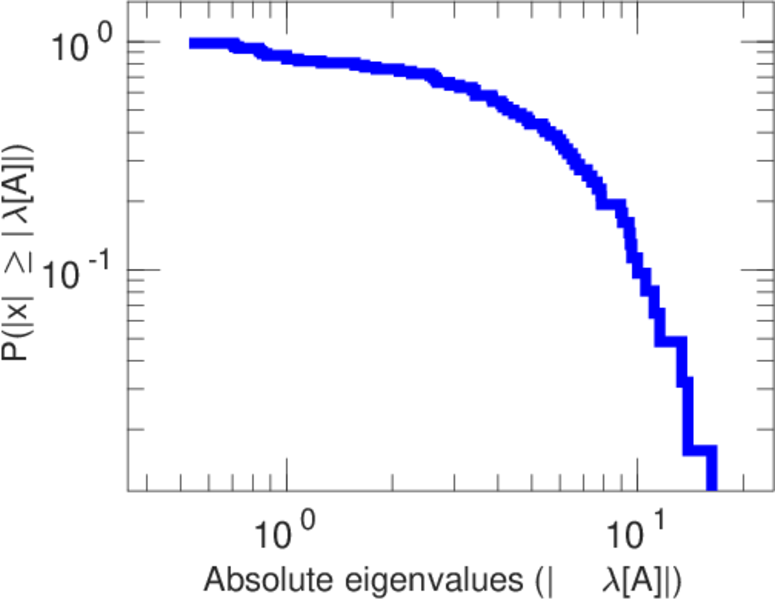
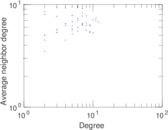
Plots


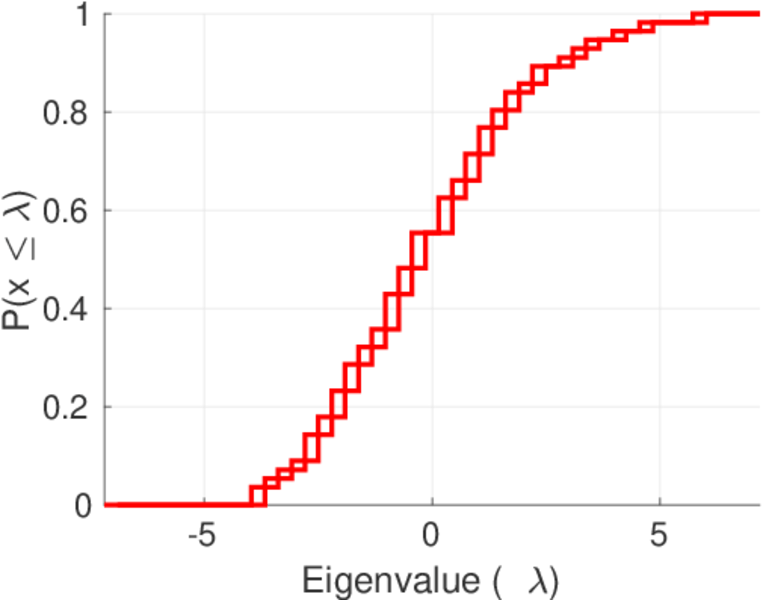
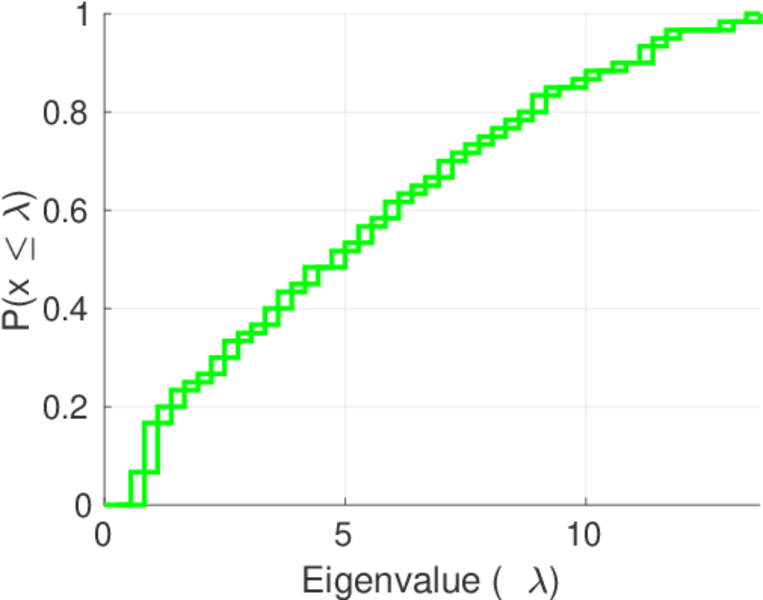
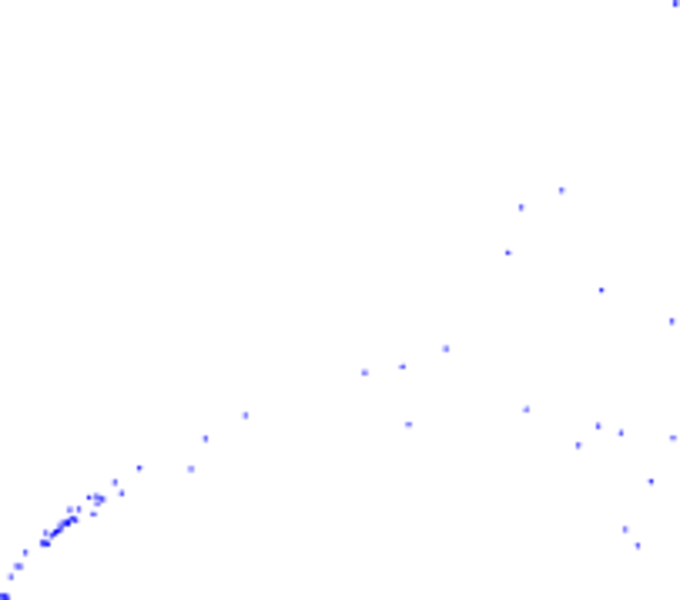
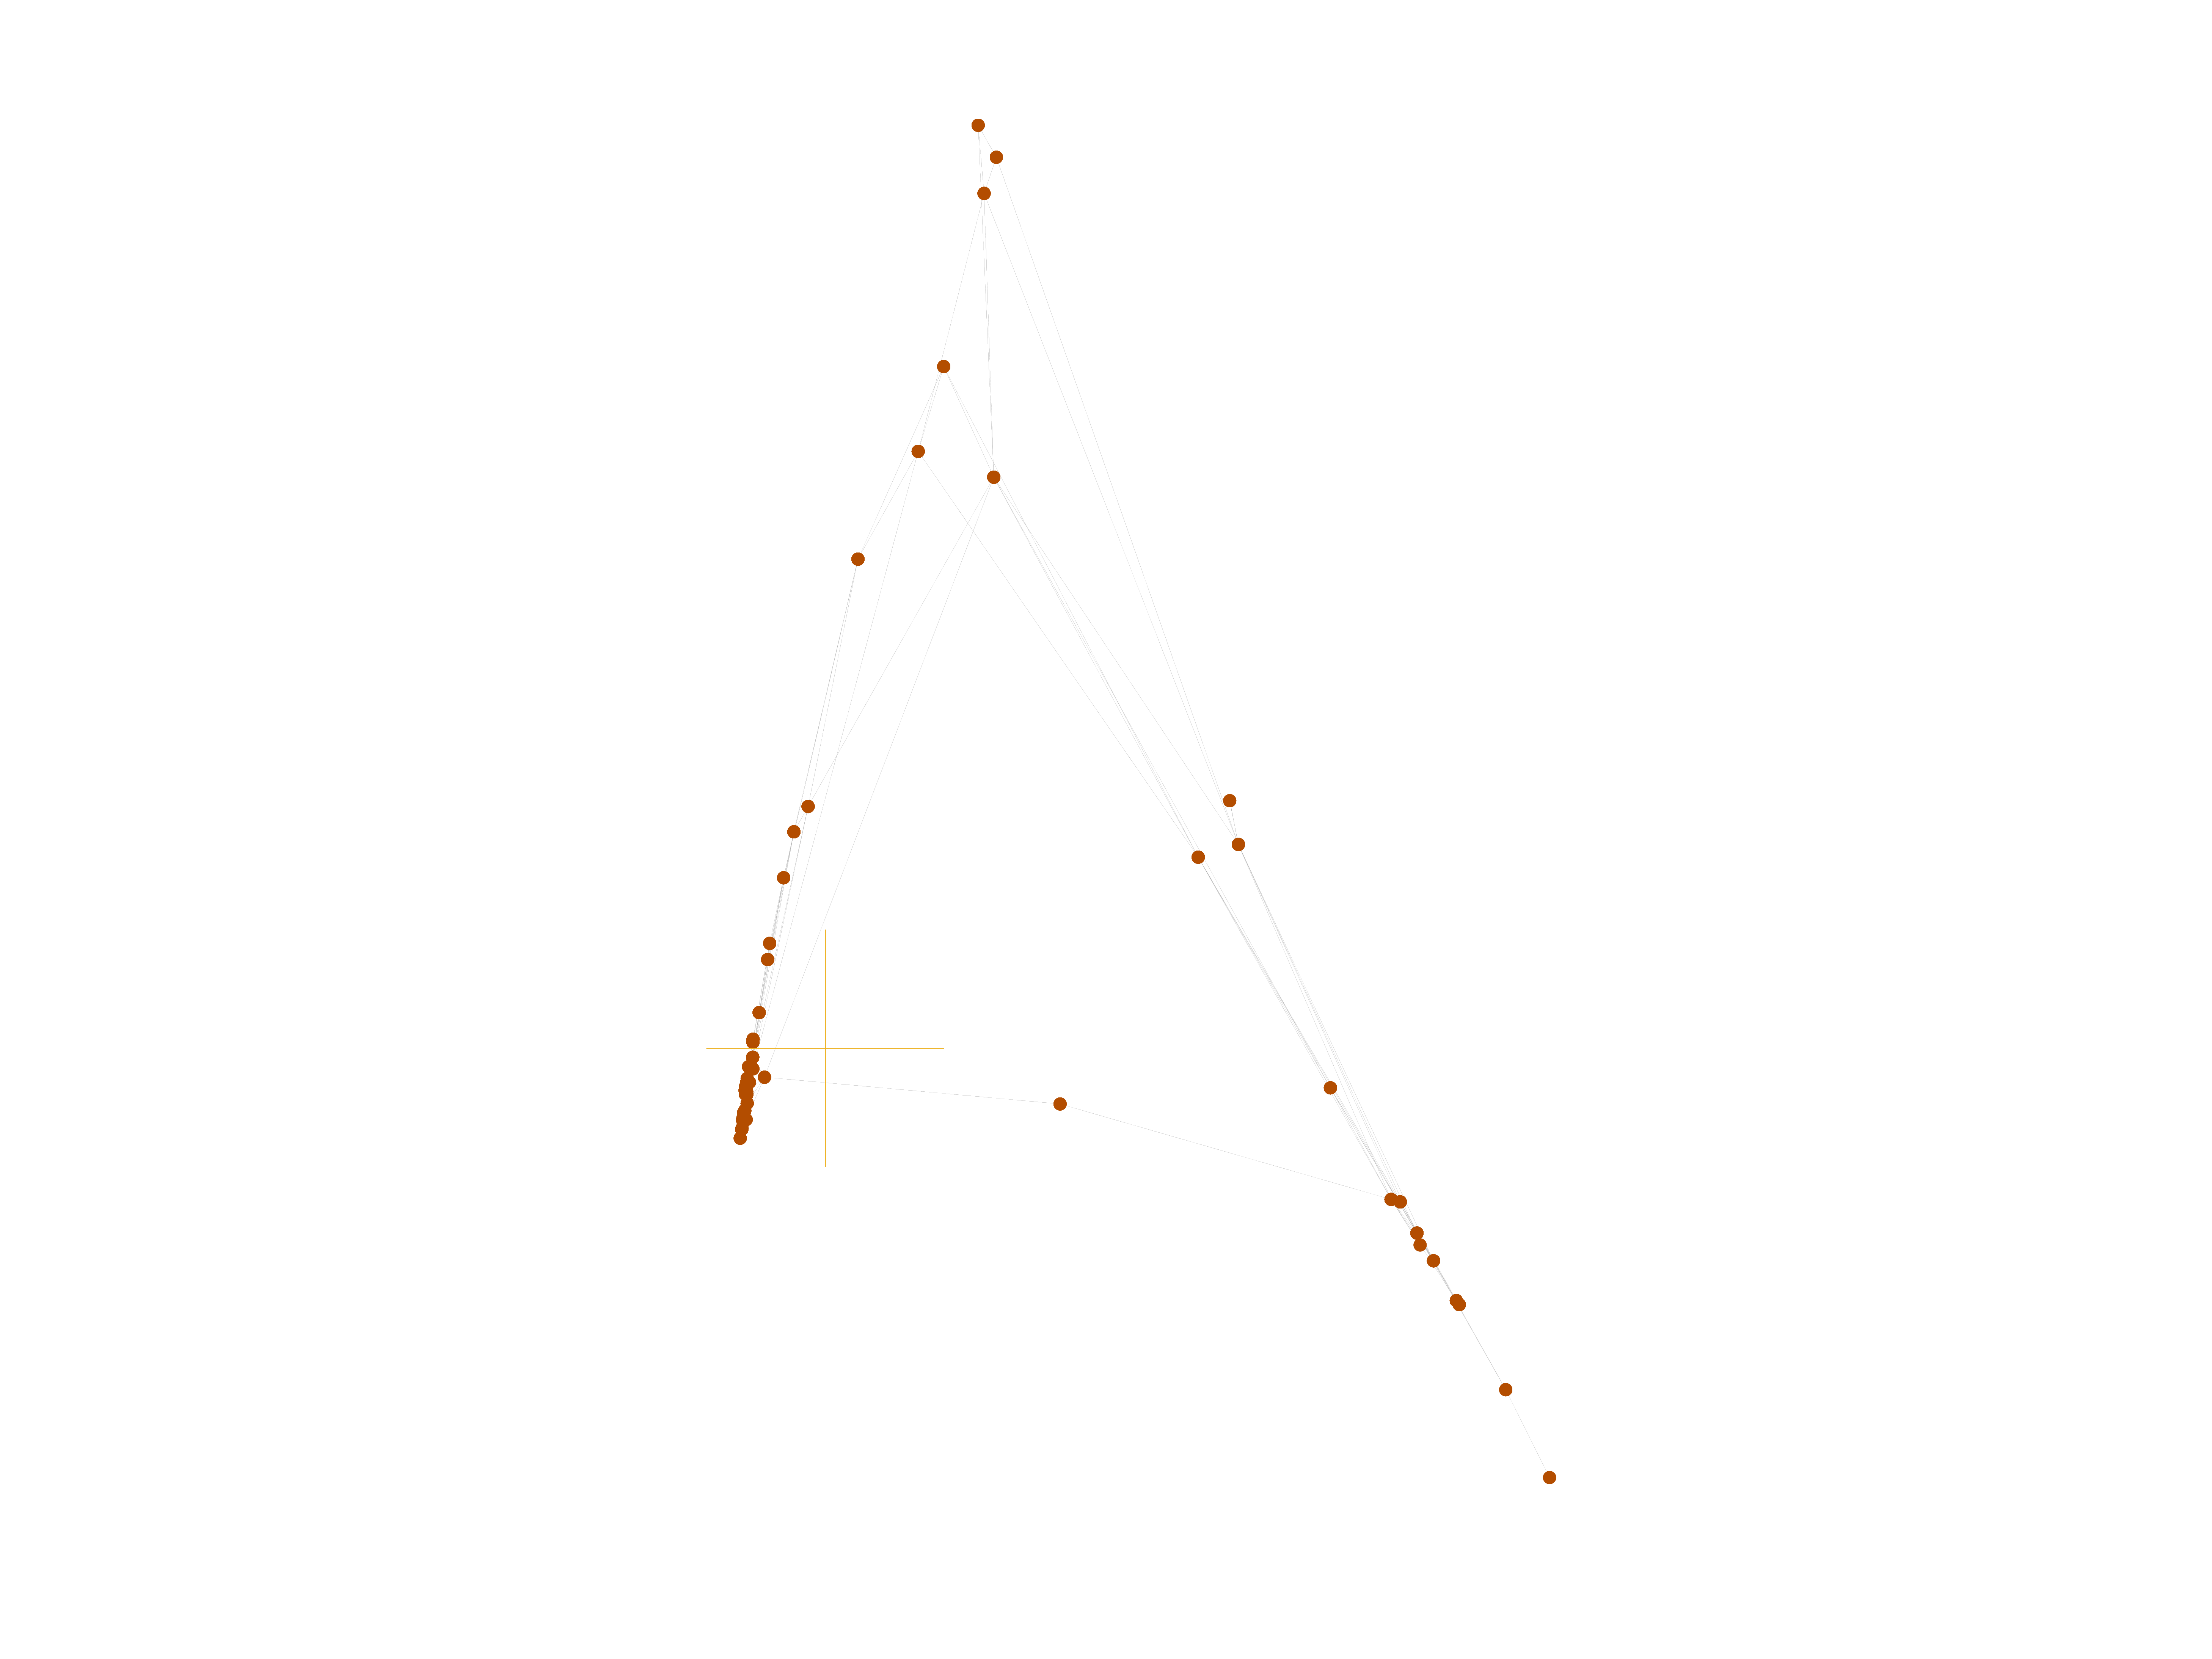
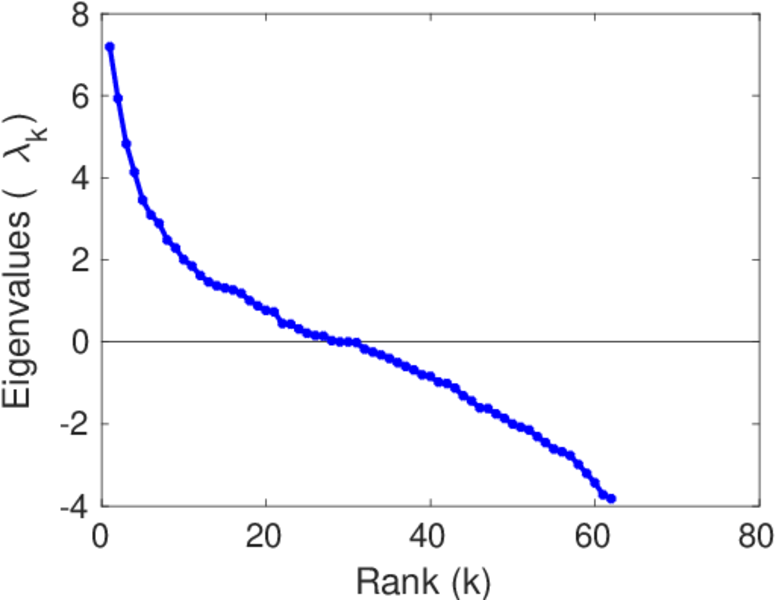
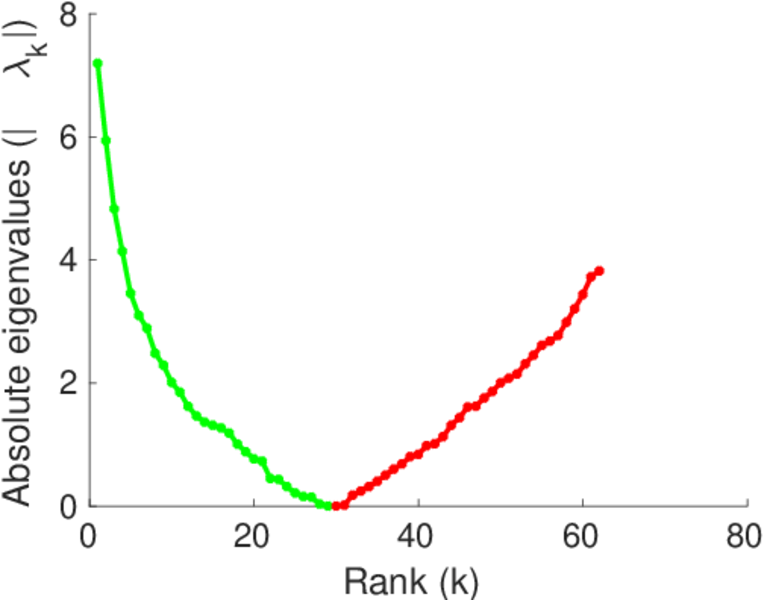
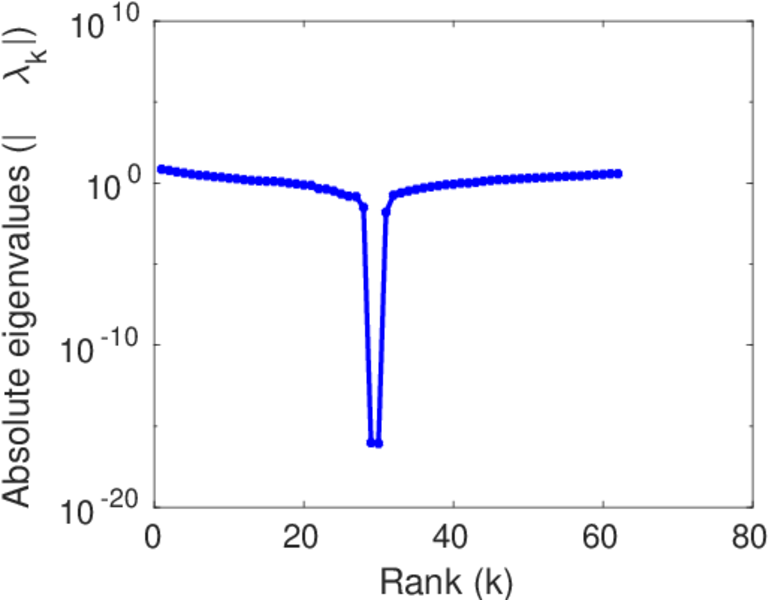
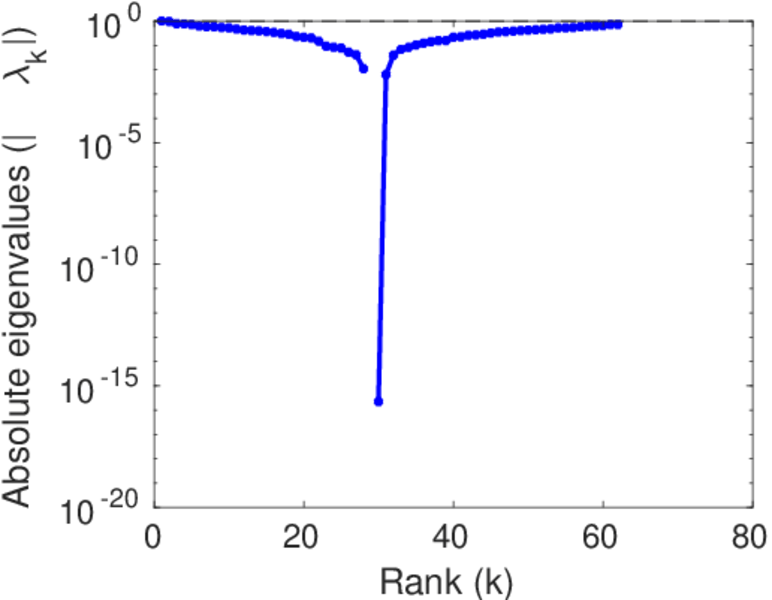
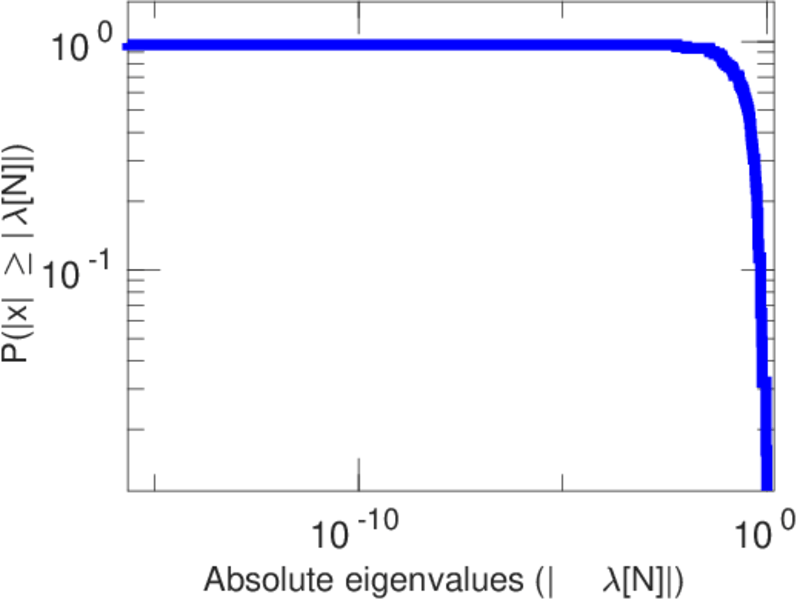
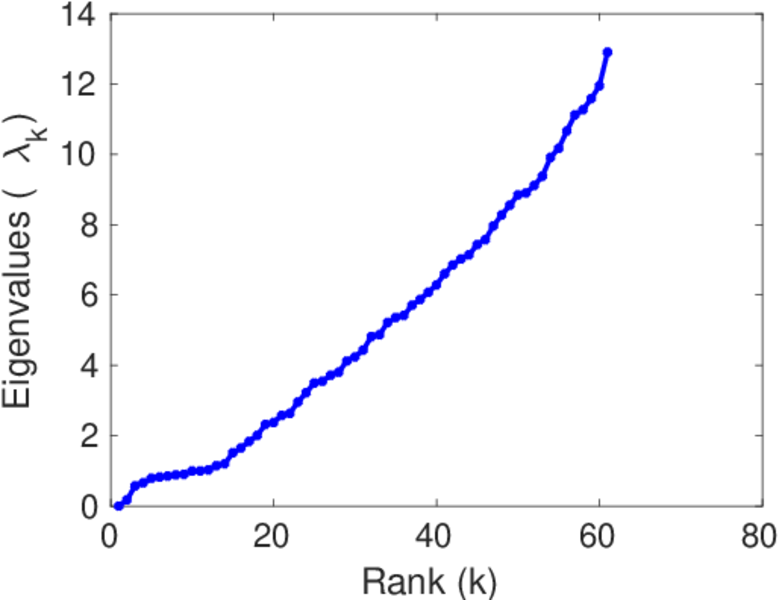
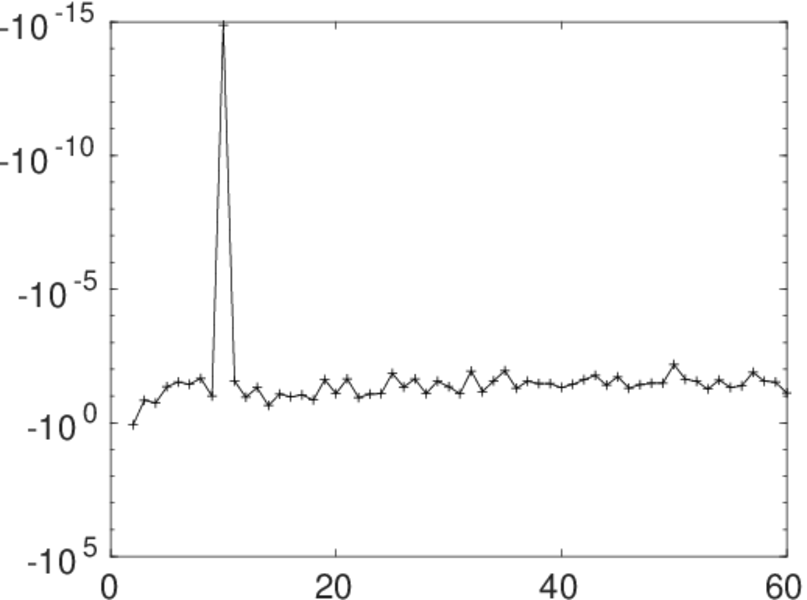
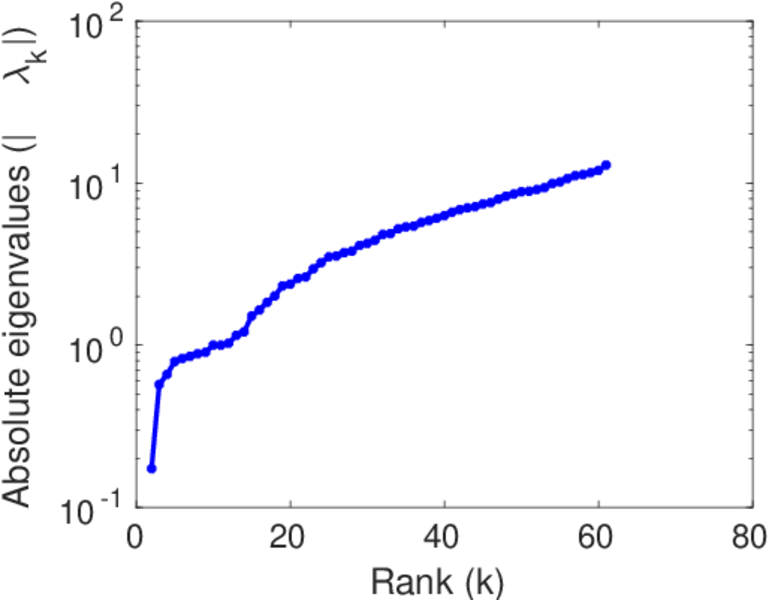
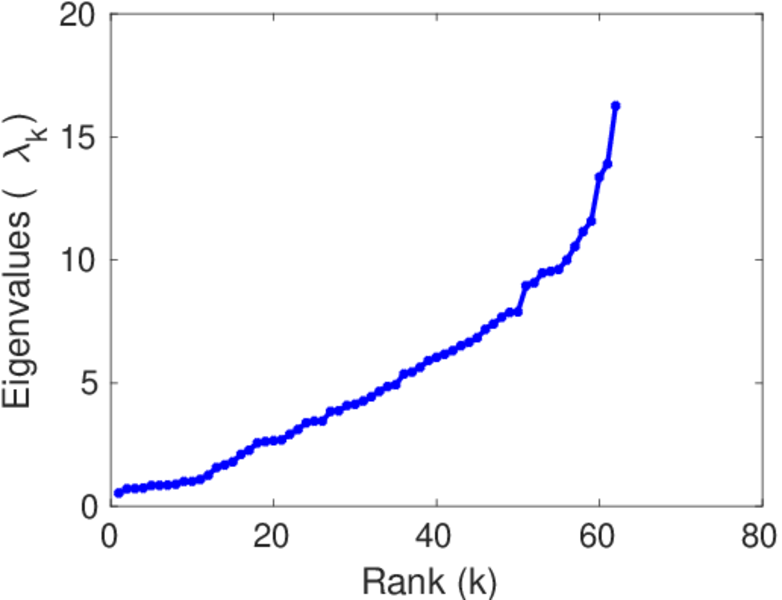
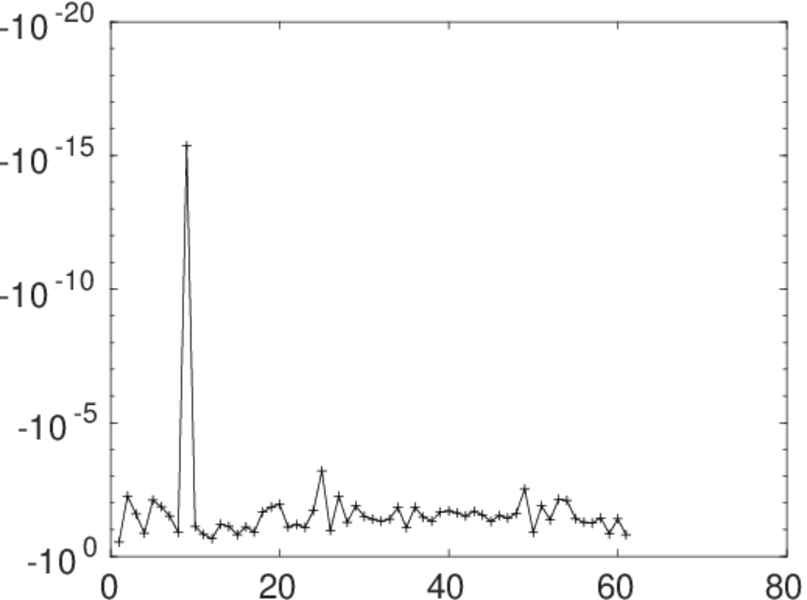
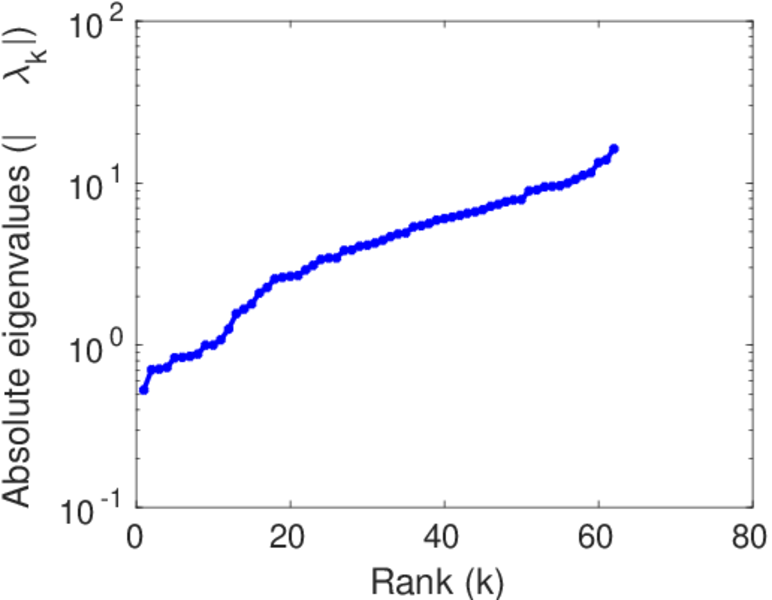
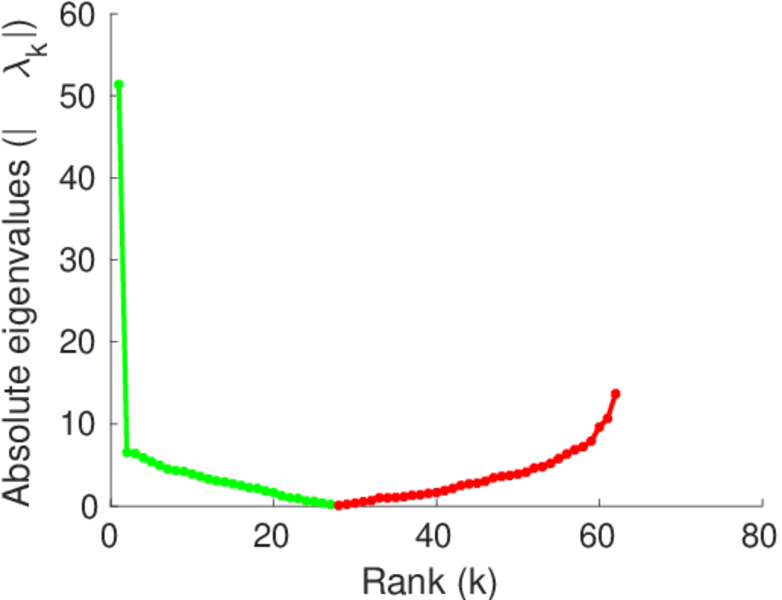
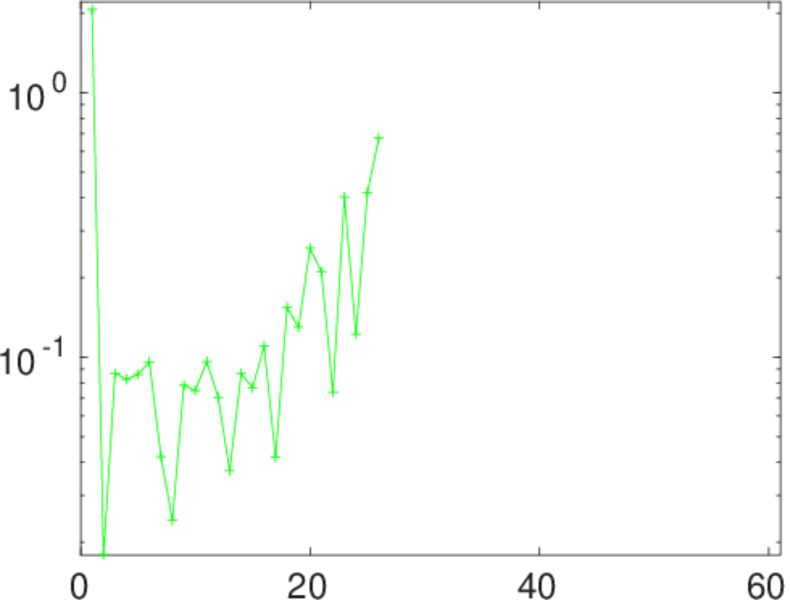
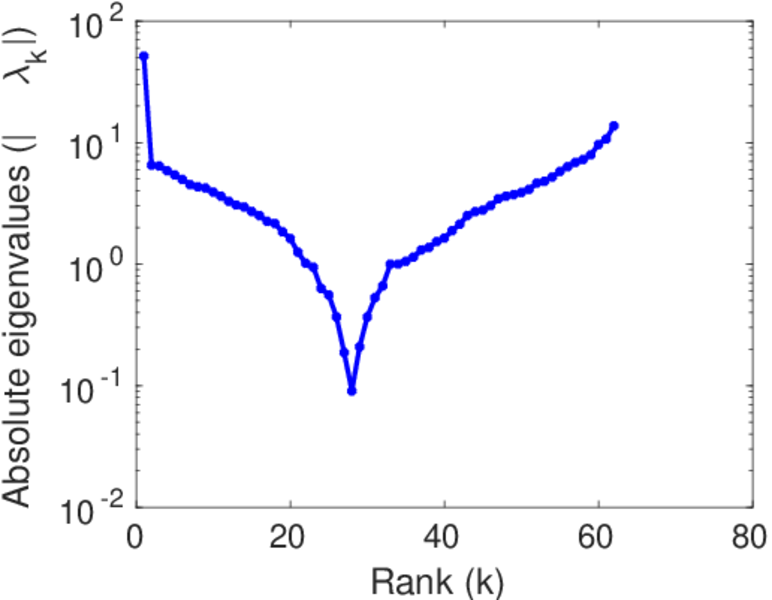
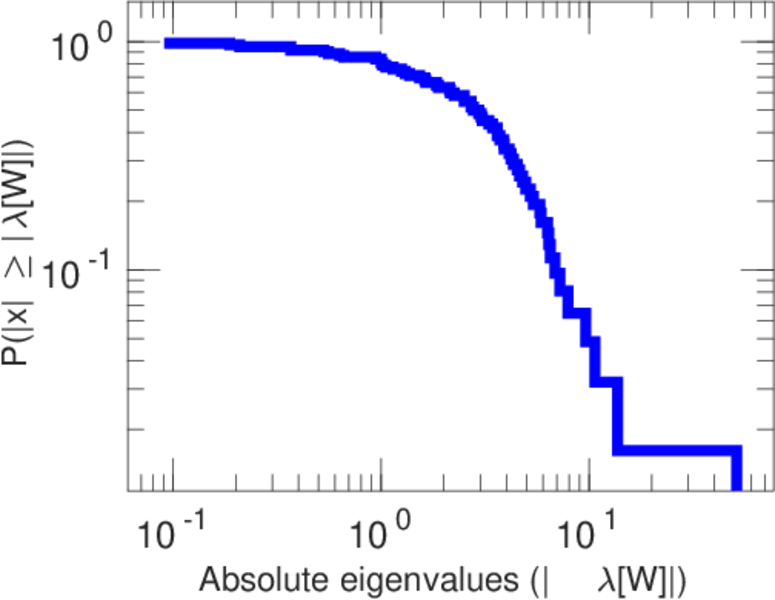
Matrix decompositions plots


Downloads
References
|
[1]
|
Jérôme Kunegis.
KONECT – The Koblenz Network Collection.
In Proc. Int. Conf. on World Wide Web Companion, pages
1343–1350, 2013.
[ http ]
|
|
[2]
|
D. Lusseau, K. Schneider, O. J. Boisseau, P. Haase, E. Slooten, and S. M.
Dawson.
The bottlenose dolphin community of Doubtful Sound features a
large proportion of long-lasting associations.
Behav. Ecol. and Sociobiol., 54:396–405, 2003.
|
 KONECT ‣ Networks ‣
Buy Me a Coffee
KONECT ‣ Networks ‣
Buy Me a Coffee