Wikipedia edits (bg)
This is the bipartite edit network of the Bulgarian Wikipedia. It contains
users and pages from the Bulgarian Wikipedia, connected by edit events. Each
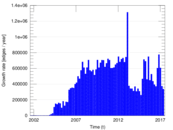
edge represents an edit. The dataset includes the timestamp of each edit.
Metadata
Statistics
| Size | n = | 556,885
|
| Left size | n1 = | 40,823
|
| Right size | n2 = | 516,062
|
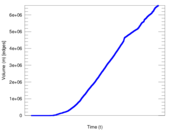
| Volume | m = | 6,567,352
|
| Unique edge count | m̿ = | 3,142,498
|
| Wedge count | s = | 61,506,674,994
|
| Claw count | z = | 1,922,710,479,532,210
|
| 4-Tour count | T4 = | 973,372,170,068
|
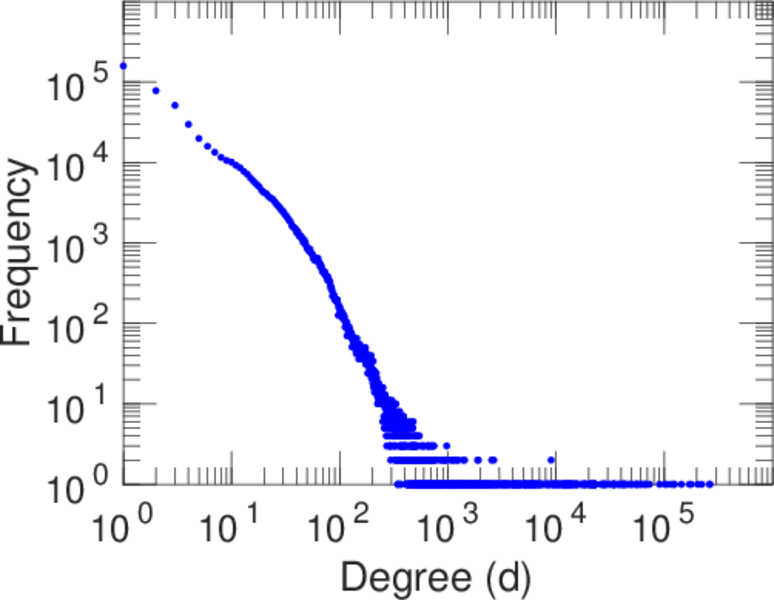
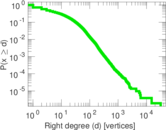
| Maximum degree | dmax = | 263,491
|
| Maximum left degree | d1max = | 263,491
|
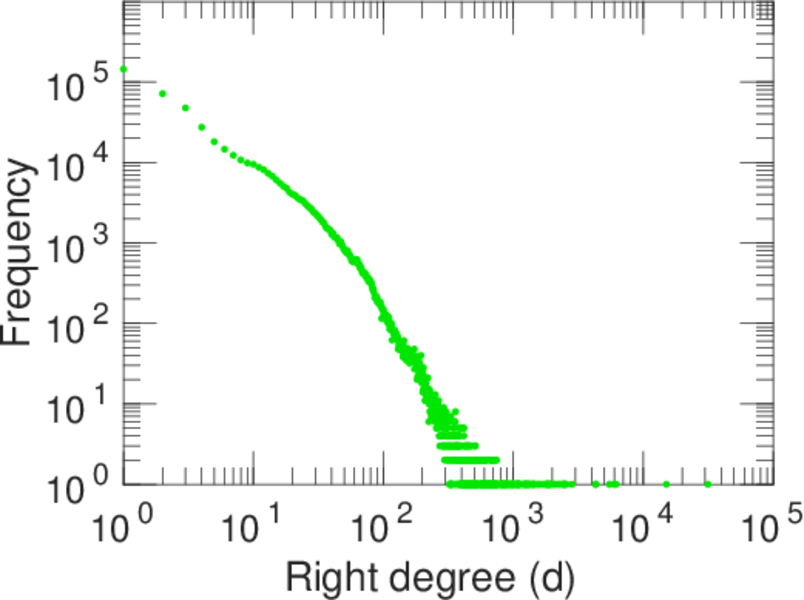
| Maximum right degree | d2max = | 31,476
|
| Average degree | d = | 23.586 0
|
| Average left degree | d1 = | 160.874
|
| Average right degree | d2 = | 12.725 9
|
| Fill | p = | 0.000 149 165
|
| Average edge multiplicity | m̃ = | 2.089 85
|
| Size of LCC | N = | 548,437
|
| Diameter | δ = | 11
|
| 50-Percentile effective diameter | δ0.5 = | 3.308 12
|
| 90-Percentile effective diameter | δ0.9 = | 3.941 16
|
| Median distance | δM = | 4
|
| Mean distance | δm = | 3.533 06
|
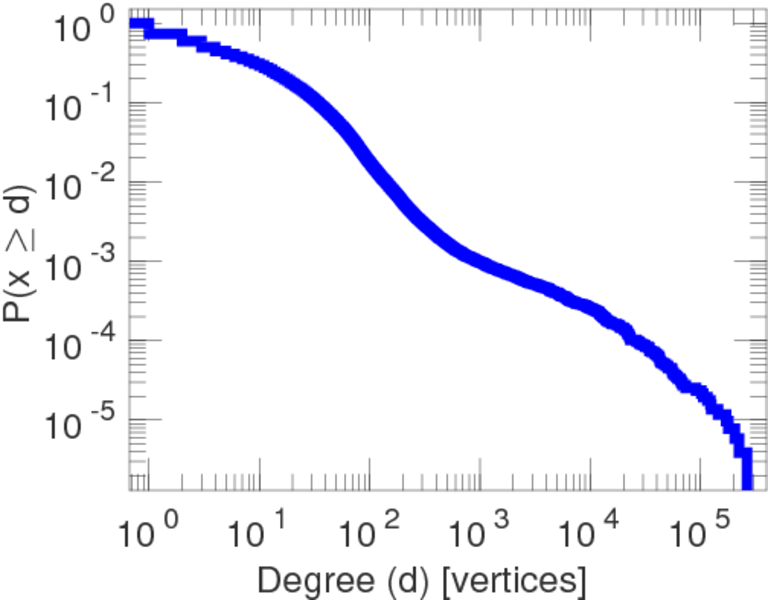
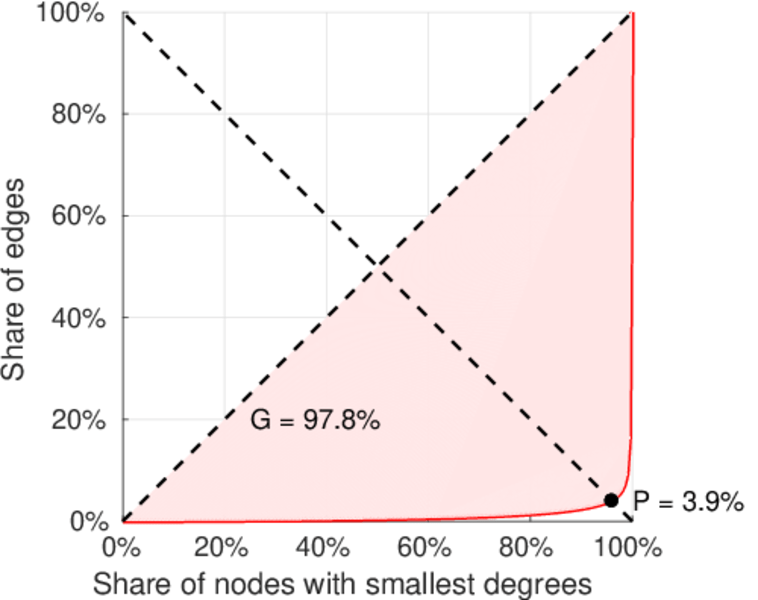
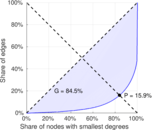
| Gini coefficient | G = | 0.846 507
|
| Balanced inequality ratio | P = | 0.157 465
|
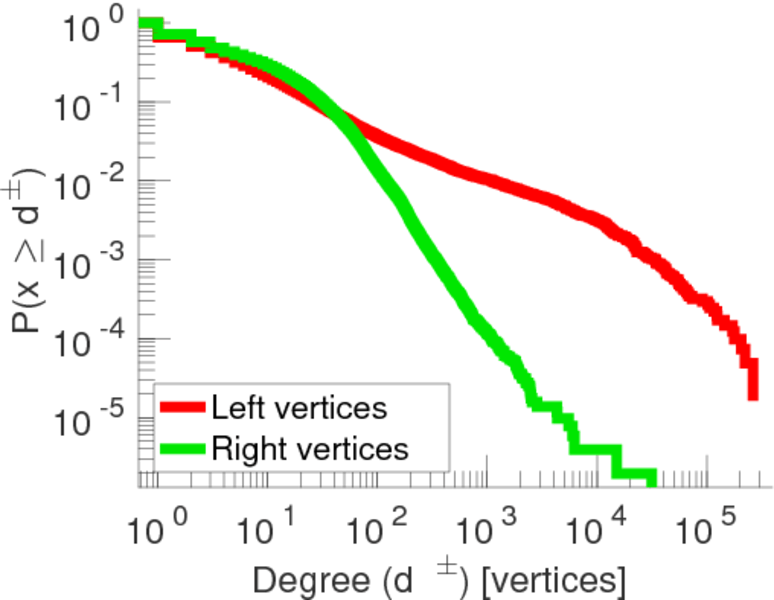
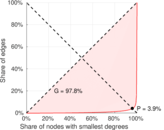
| Left balanced inequality ratio | P1 = | 0.039 355 6
|
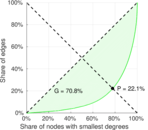
| Right balanced inequality ratio | P2 = | 0.221 041
|
| Relative edge distribution entropy | Her = | 0.729 717
|
| Power law exponent | γ = | 1.941 80
|
| Tail power law exponent | γt = | 3.051 00
|
| Degree assortativity | ρ = | −0.137 952
|
| Degree assortativity p-value | pρ = | 0.000 00
|
| Algebraic connectivity | a = | 0.076 314 3
|
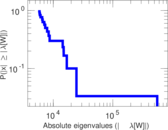
| Spectral separation | |λ1[A] / λ2[A]| = | 1.458 70
|
| Controllability | C = | 485,582
|
| Relative controllability | Cr = | 0.878 452
|
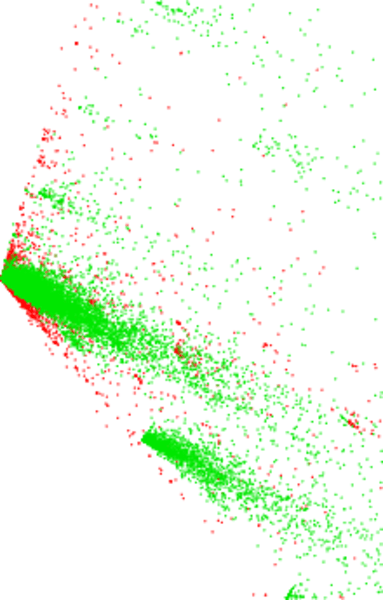
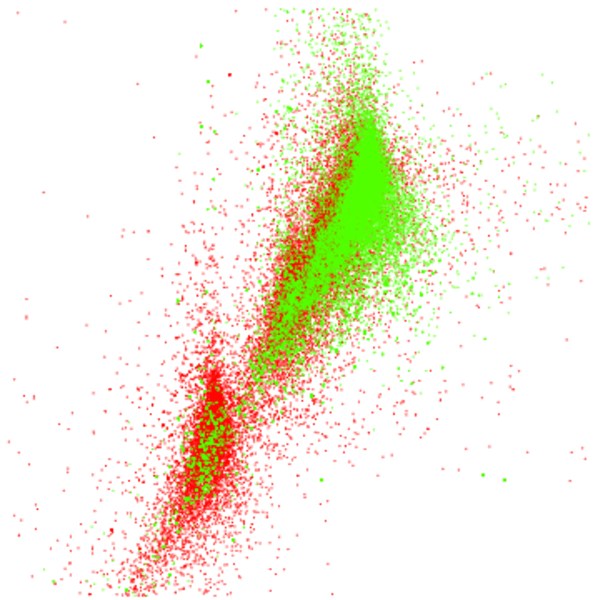
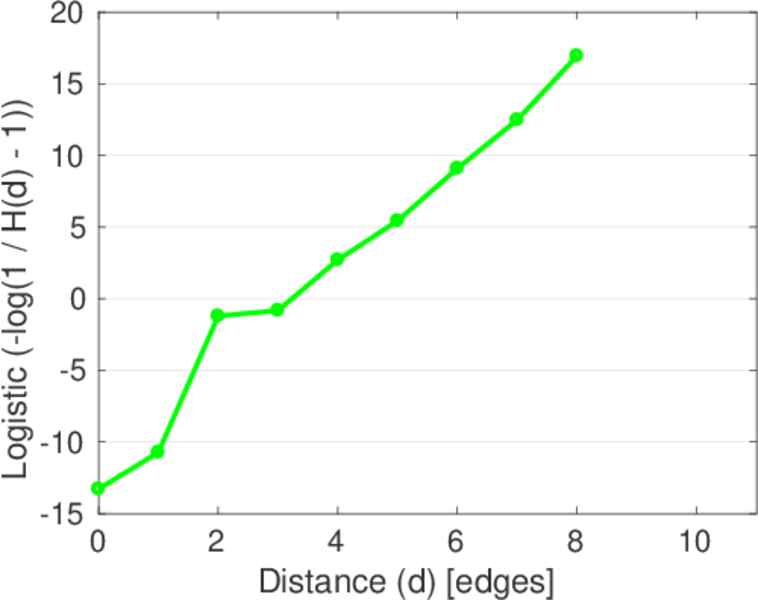
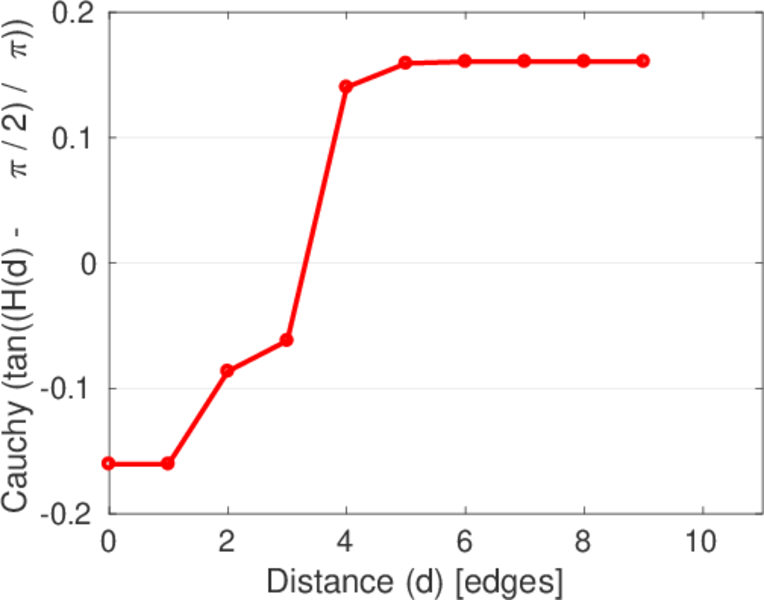
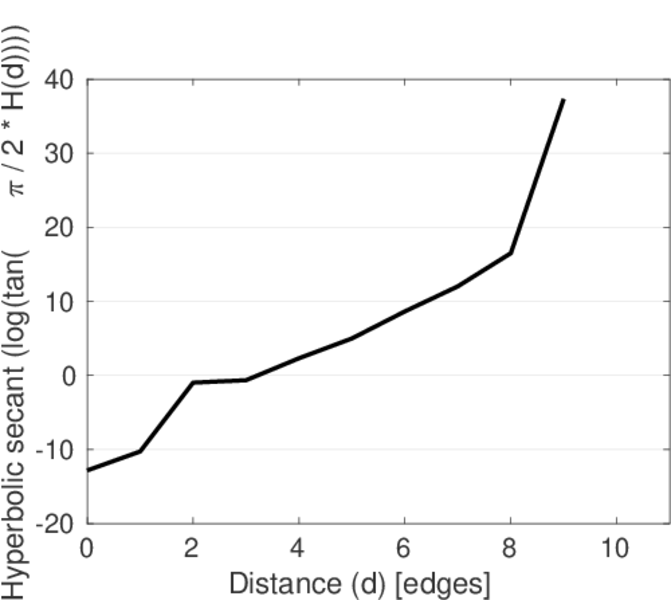
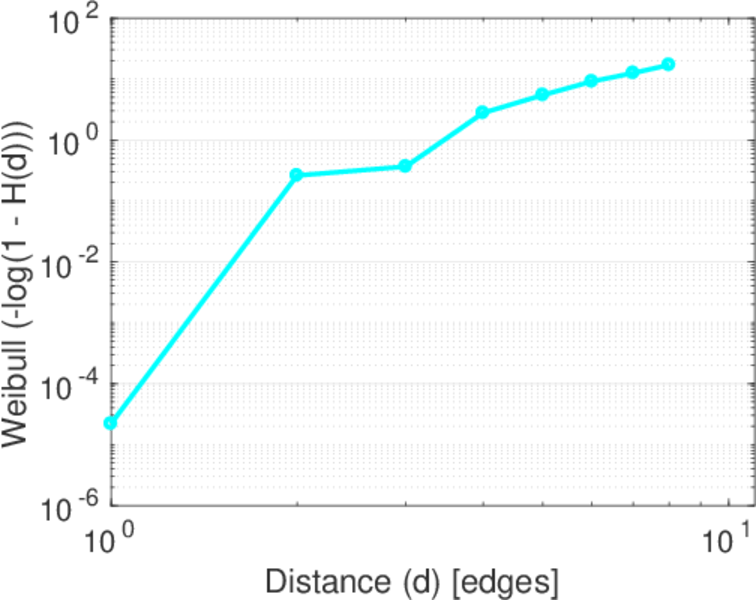
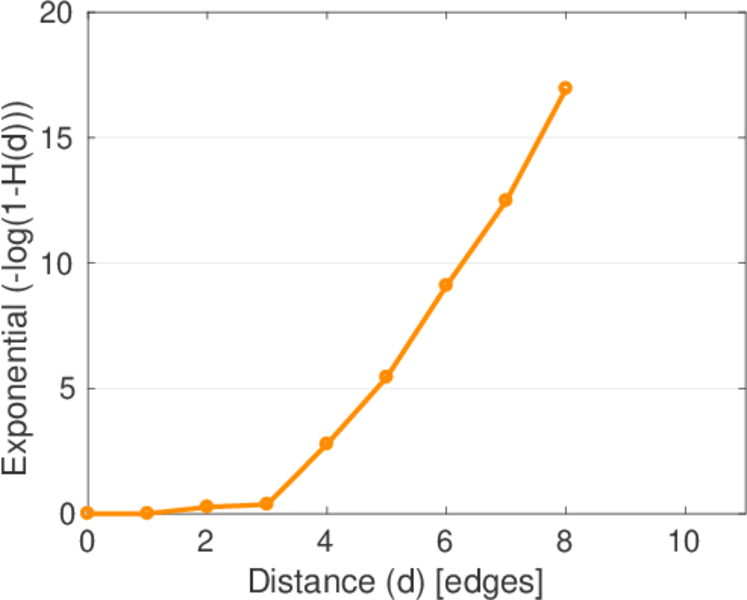
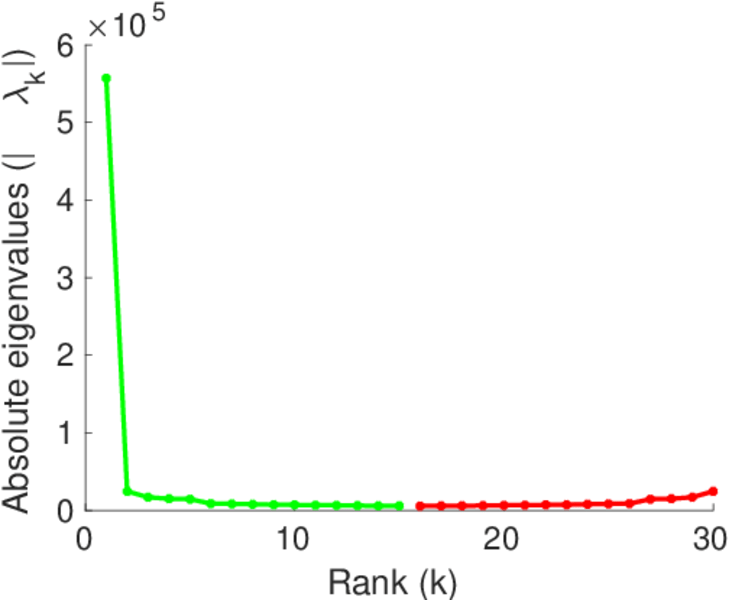
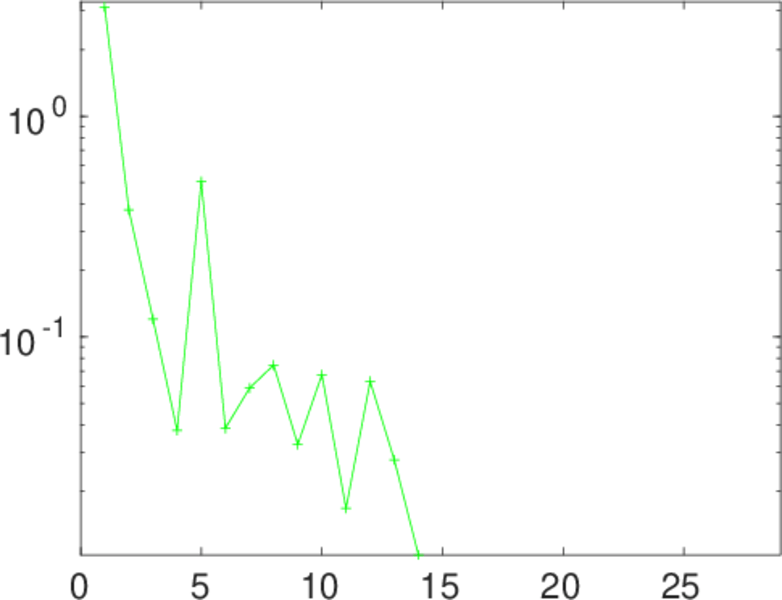
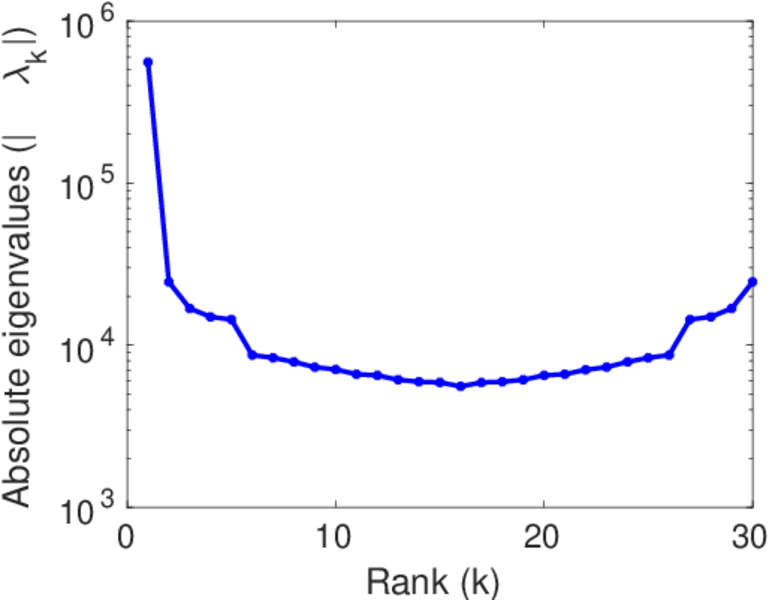
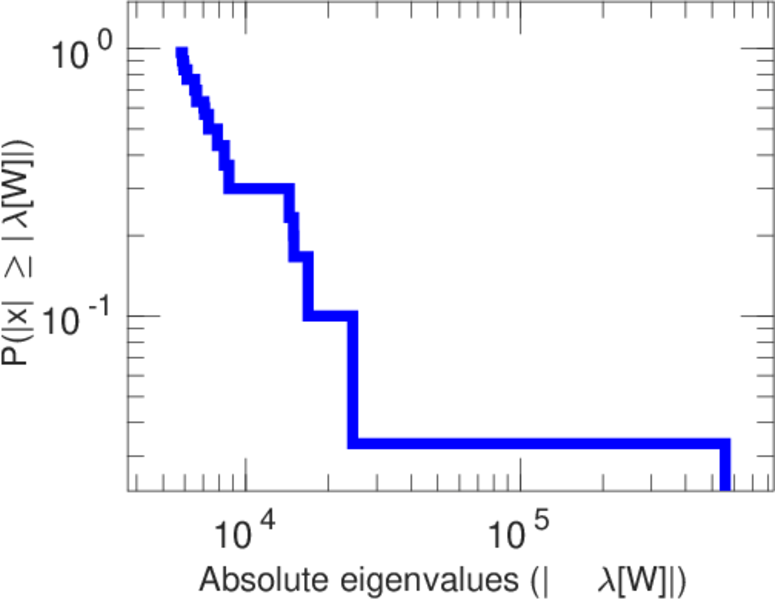
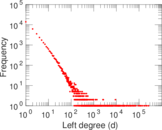
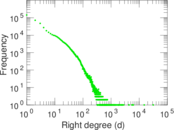
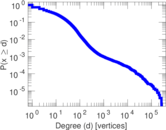
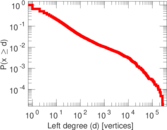
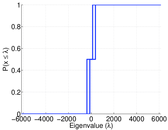
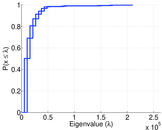
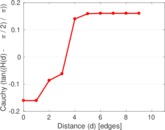
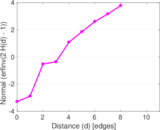
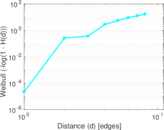
Plots


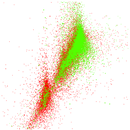
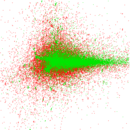


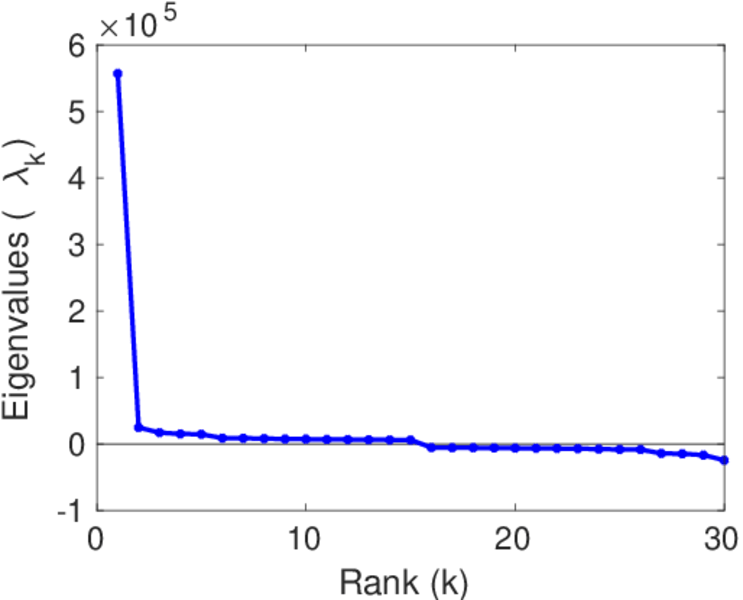
Matrix decompositions plots


Downloads
References
|
[1]
|
Jérôme Kunegis.
KONECT – The Koblenz Network Collection.
In Proc. Int. Conf. on World Wide Web Companion, pages
1343–1350, 2013.
[ http ]
|
|
[2]
|
Wikimedia Foundation.
Wikimedia downloads.
http://dumps.wikimedia.org/, January 2010.
|
 KONECT ‣ Networks ‣
Buy Me a Coffee
KONECT ‣ Networks ‣
Buy Me a Coffee