Wikipedia edits (ca)
This is the bipartite edit network of the Catalan Wikipedia. It contains users
and pages from the Catalan Wikipedia, connected by edit events. Each edge
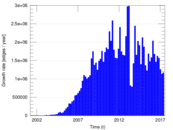
represents an edit. The dataset includes the timestamp of each edit.
Metadata
Statistics
| Size | n = | 1,433,726
|
| Left size | n1 = | 64,855
|
| Right size | n2 = | 1,368,871
|
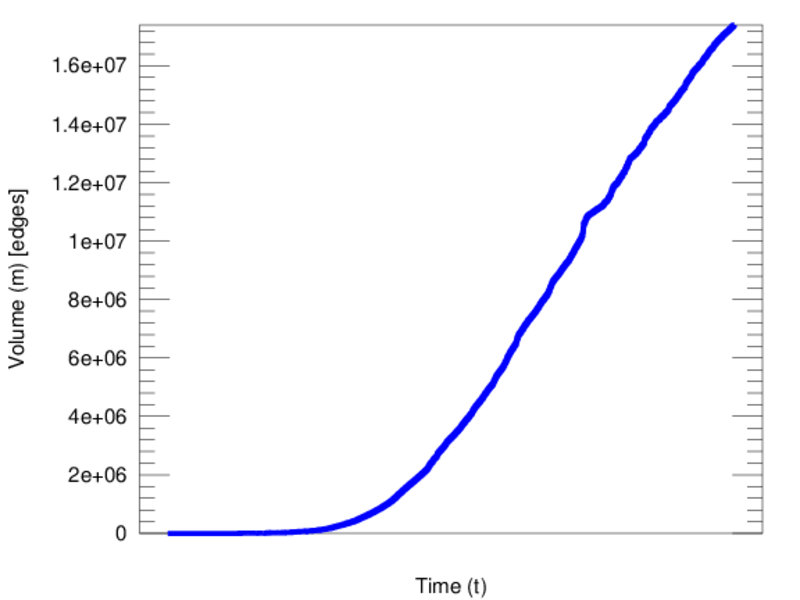
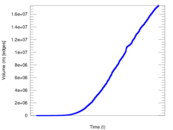
| Volume | m = | 17,396,142
|
| Unique edge count | m̿ = | 8,451,753
|
| Wedge count | s = | 488,493,598,538
|
| Claw count | z = | 38,157,676,563,995,488
|
| Cross count | x = | 2.695 94 × 1021
|
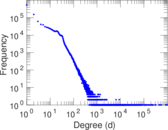
| Maximum degree | dmax = | 993,676
|
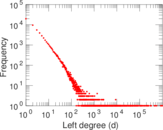
| Maximum left degree | d1max = | 993,676
|
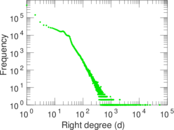
| Maximum right degree | d2max = | 53,479
|
| Average degree | d = | 24.267 0
|
| Average left degree | d1 = | 268.231
|
| Average right degree | d2 = | 12.708 4
|
| Fill | p = | 9.520 08 × 10−5
|
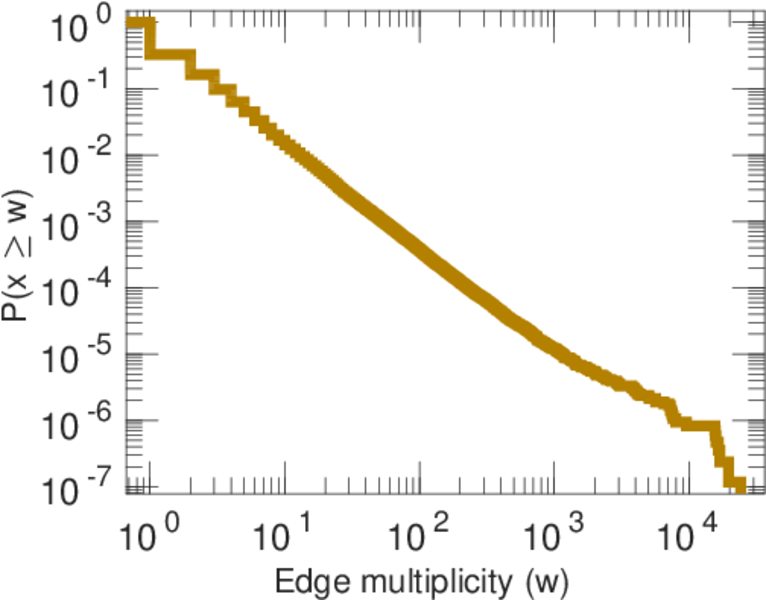
| Average edge multiplicity | m̃ = | 2.058 29
|
| Size of LCC | N = | 1,418,923
|
| Diameter | δ = | 12
|
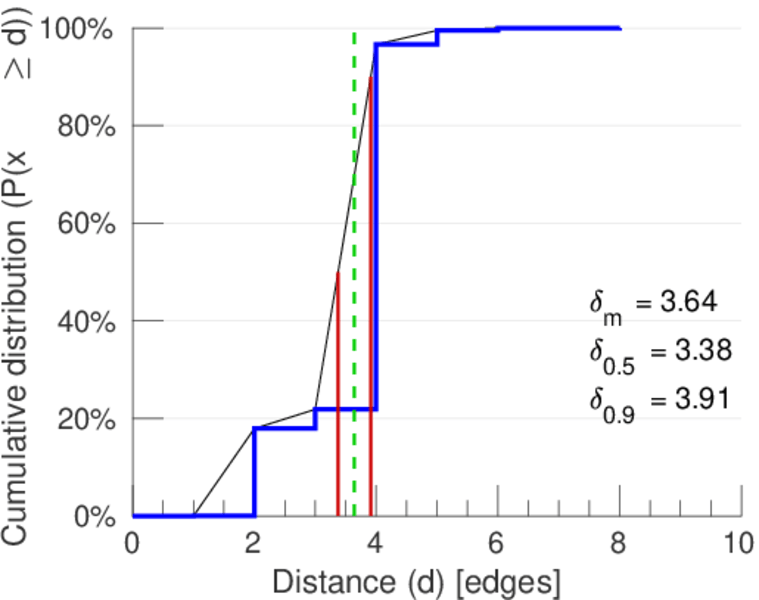
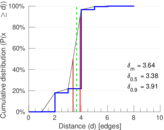
| 50-Percentile effective diameter | δ0.5 = | 3.376 58
|
| 90-Percentile effective diameter | δ0.9 = | 3.911 58
|
| Median distance | δM = | 4
|
| Mean distance | δm = | 3.641 61
|
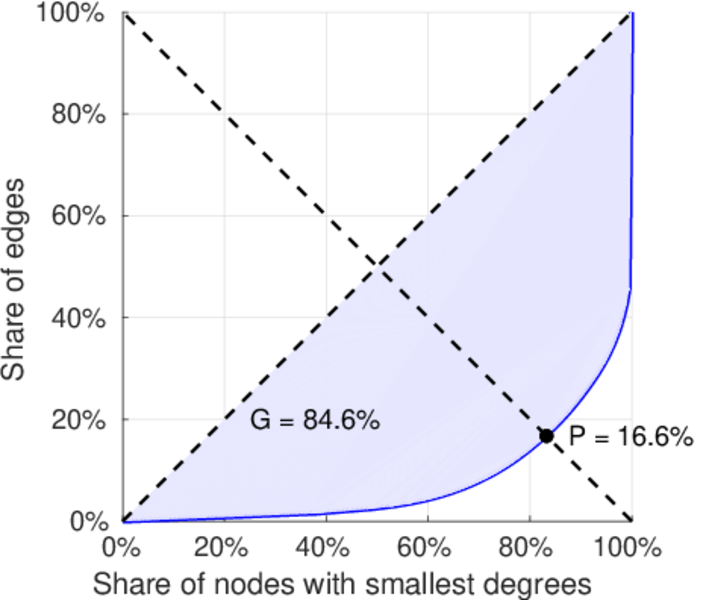
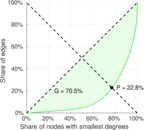
| Gini coefficient | G = | 0.847 526
|
| Balanced inequality ratio | P = | 0.165 528
|
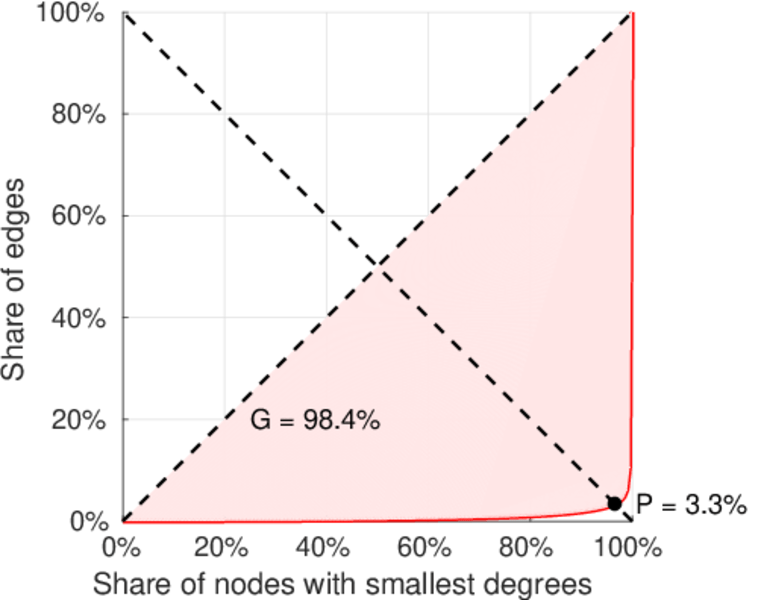
| Left balanced inequality ratio | P1 = | 0.032 835 2
|
| Right balanced inequality ratio | P2 = | 0.228 127
|
| Relative edge distribution entropy | Her = | 0.712 477
|
| Power law exponent | γ = | 1.925 23
|
| Tail power law exponent | γt = | 3.111 00
|
| Degree assortativity | ρ = | −0.123 088
|
| Degree assortativity p-value | pρ = | 0.000 00
|
| Algebraic connectivity | a = | 0.027 695 2
|
| Spectral separation | |λ1[A] / λ2[A]| = | 1.311 76
|
| Controllability | C = | 1,315,427
|
| Relative controllability | Cr = | 0.922 566
|
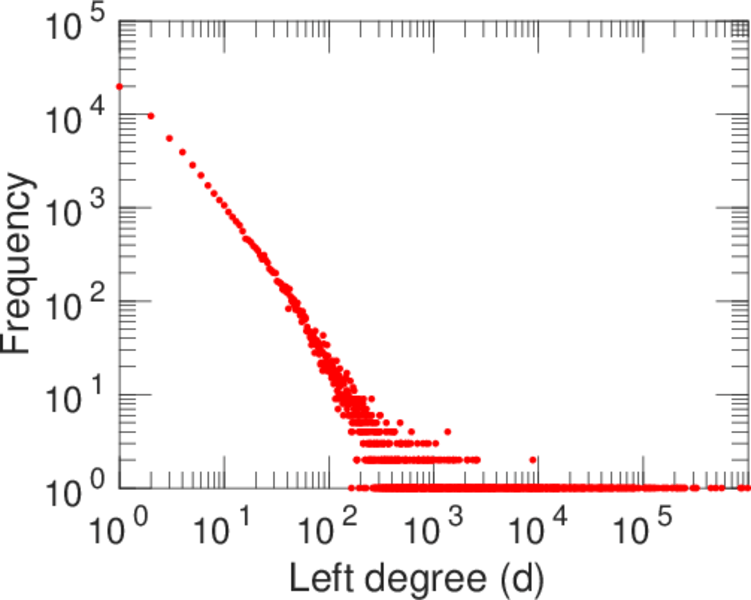
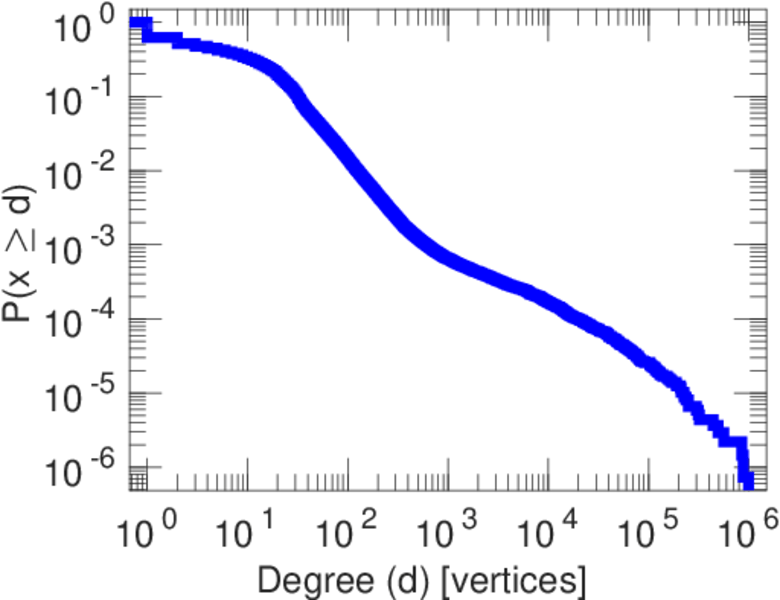
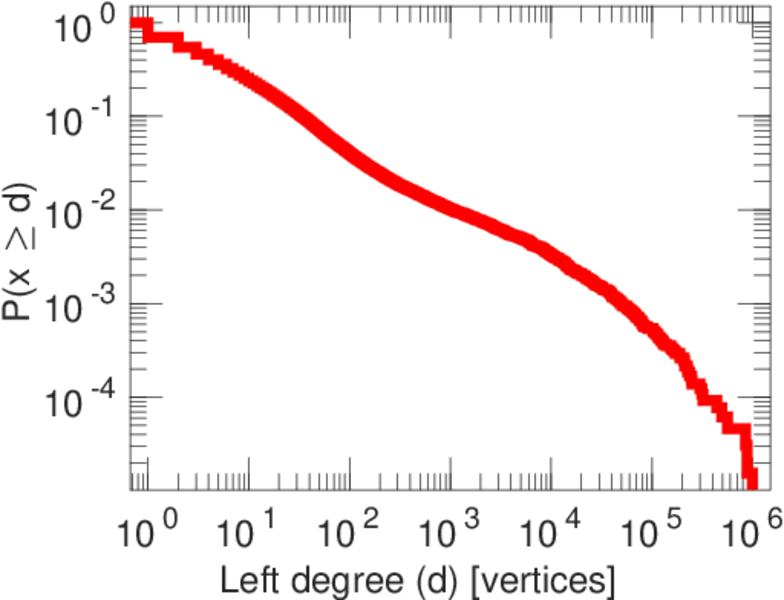
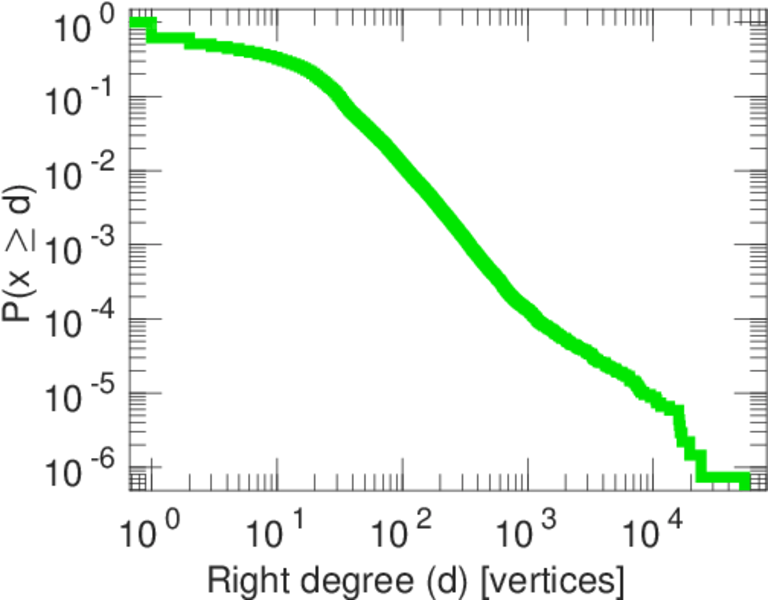
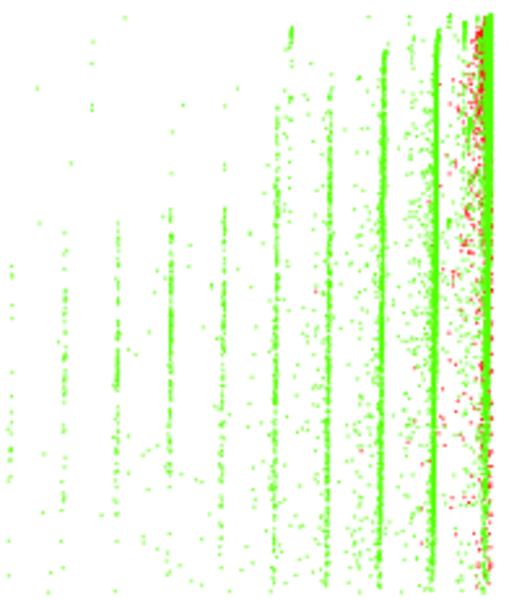
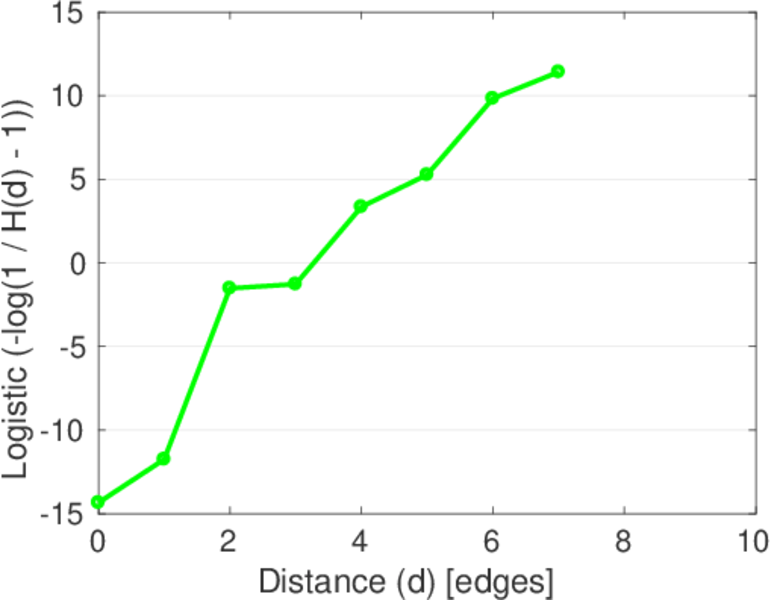
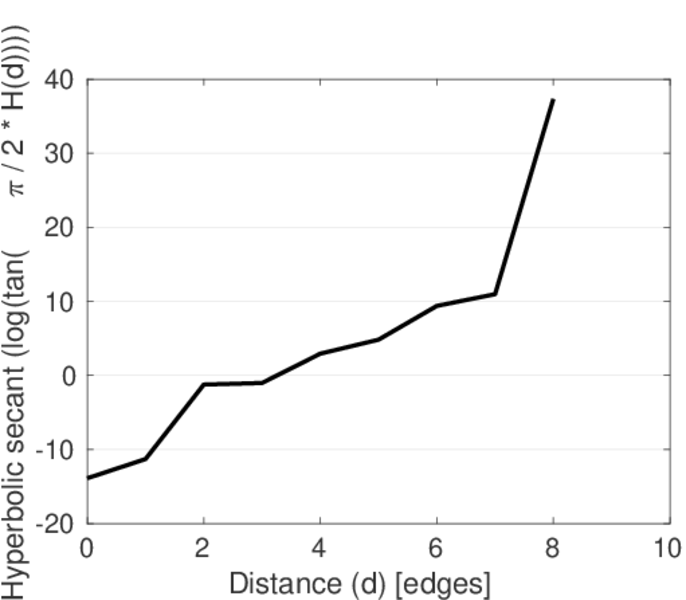
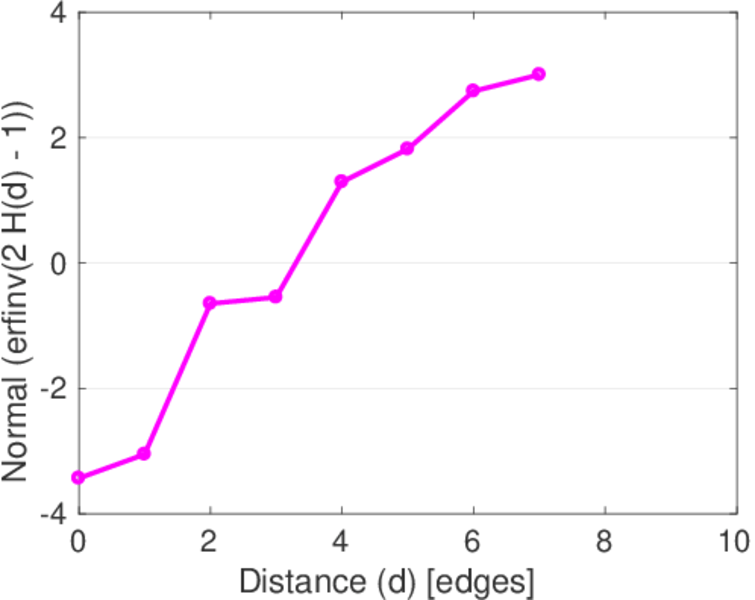
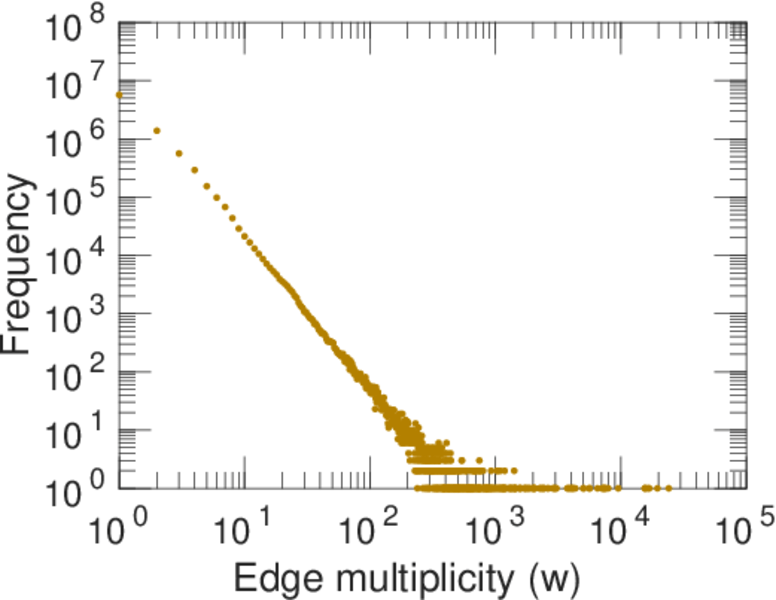
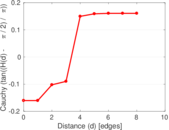
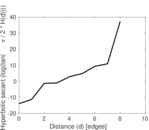
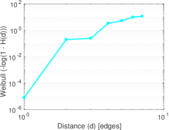
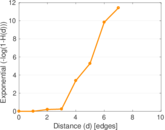
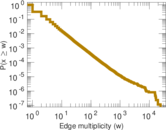
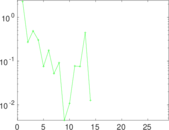
Plots


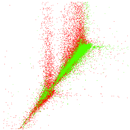
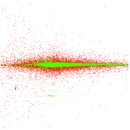


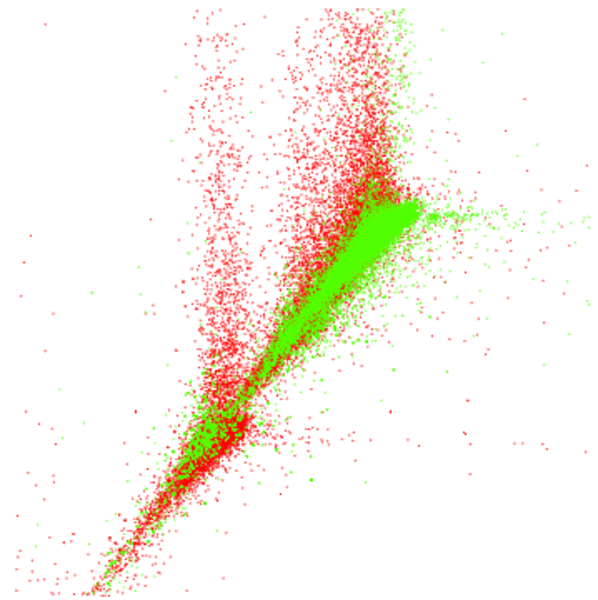
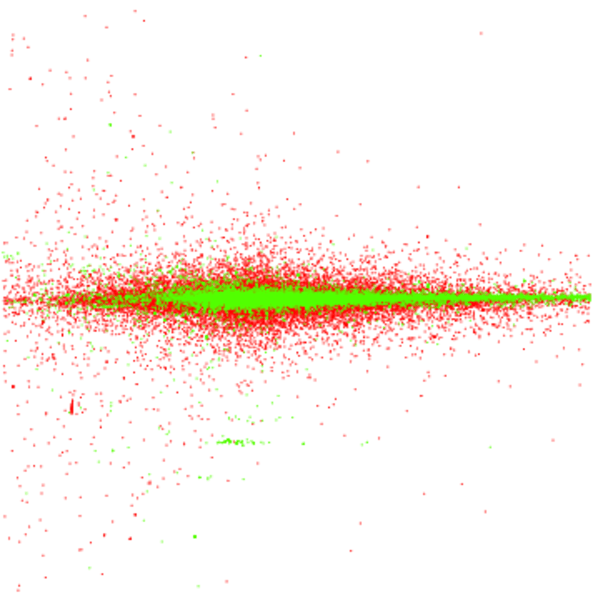
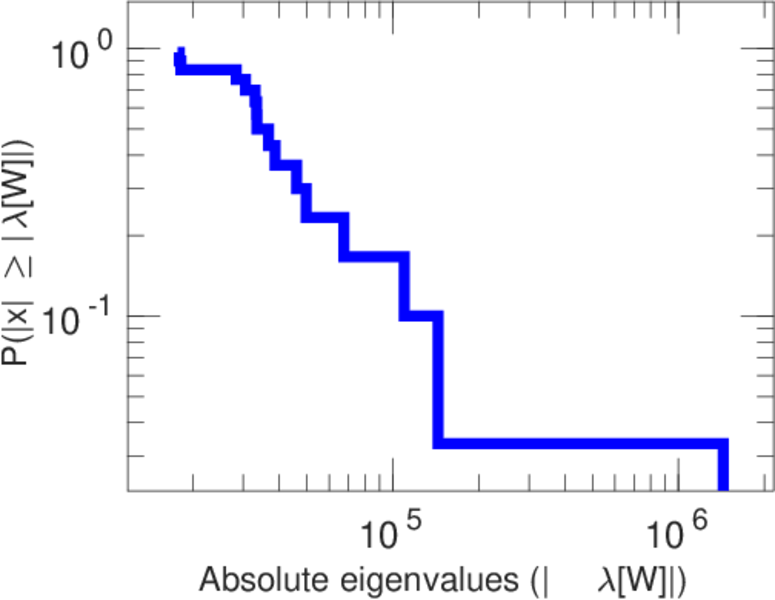
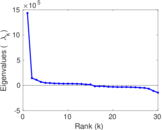
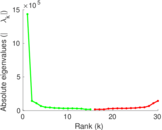
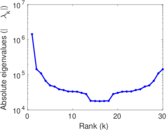
Matrix decompositions plots

Downloads
References
|
[1]
|
Jérôme Kunegis.
KONECT – The Koblenz Network Collection.
In Proc. Int. Conf. on World Wide Web Companion, pages
1343–1350, 2013.
[ http ]
|
|
[2]
|
Wikimedia Foundation.
Wikimedia downloads.
http://dumps.wikimedia.org/, January 2010.
|
 KONECT ‣ Networks ‣
Buy Me a Coffee
KONECT ‣ Networks ‣
Buy Me a Coffee