Wikipedia edits (da)
This is the bipartite edit network of the Danish Wikipedia. It contains users
and pages from the Danish Wikipedia, connected by edit events. Each edge
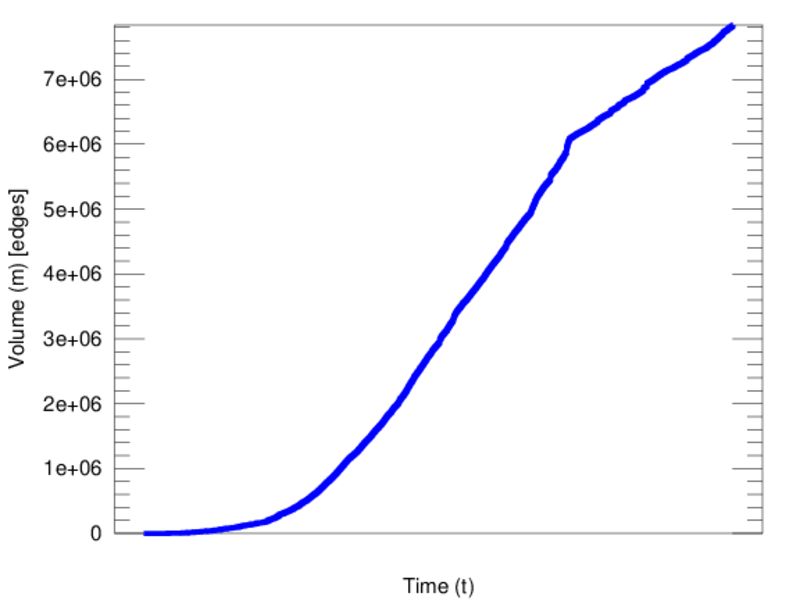
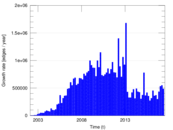
represents an edit. The dataset includes the timestamp of each edit.
Metadata
Statistics
| Size | n = | 839,193
|
| Left size | n1 = | 66,118
|
| Right size | n2 = | 773,075
|
| Volume | m = | 7,838,041
|
| Unique edge count | m̿ = | 4,434,857
|
| Wedge count | s = | 97,166,878,669
|
| Claw count | z = | 3,688,174,381,395,088
|
| Cross count | x = | 1.468 92 × 1020
|
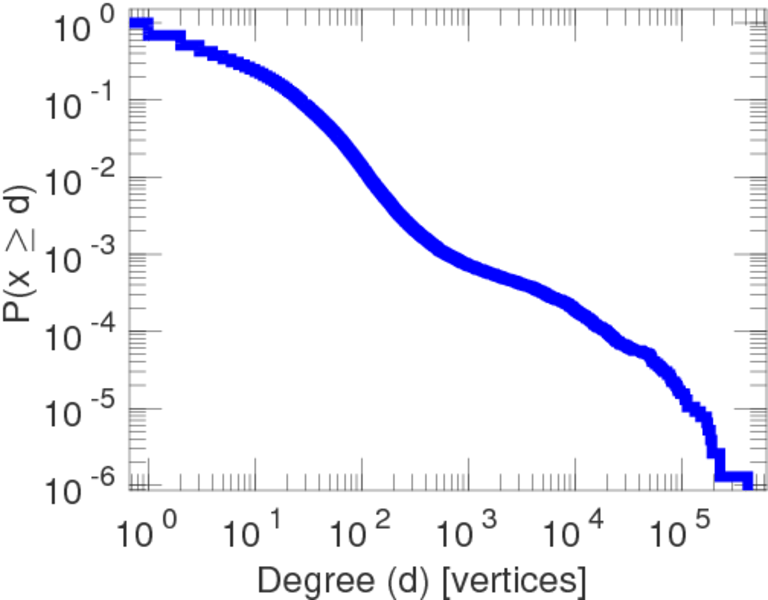
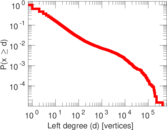
| Maximum degree | dmax = | 416,836
|
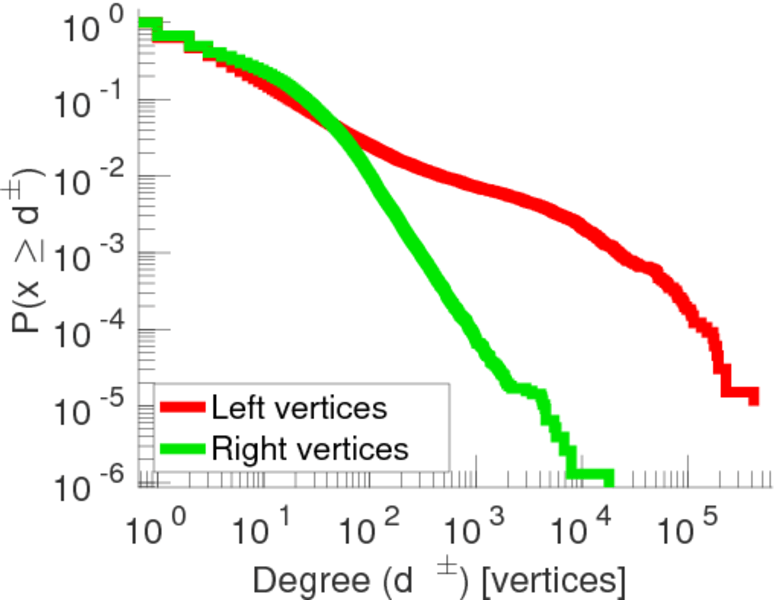
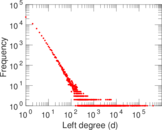
| Maximum left degree | d1max = | 416,836
|
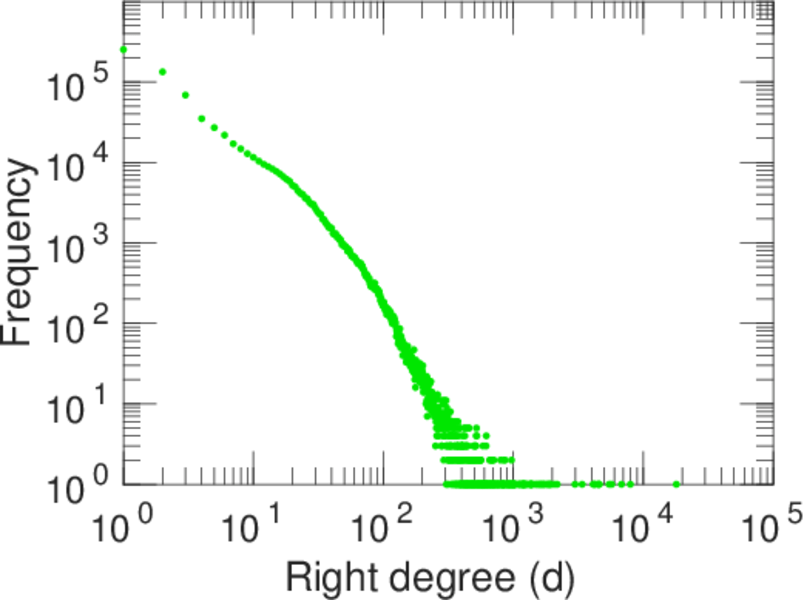
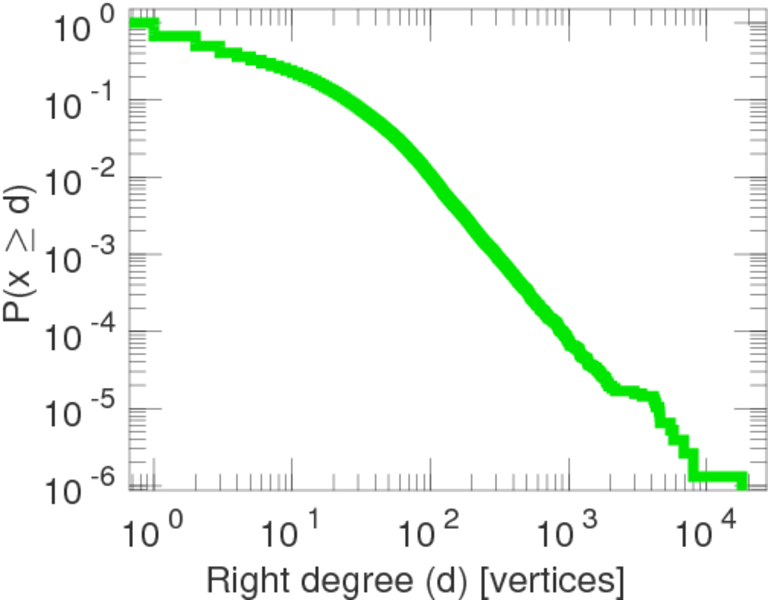
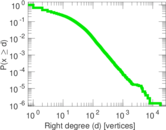
| Maximum right degree | d2max = | 18,002
|
| Average degree | d = | 18.679 9
|
| Average left degree | d1 = | 118.546
|
| Average right degree | d2 = | 10.138 8
|
| Fill | p = | 8.676 37 × 10−5
|
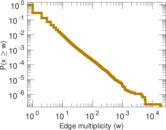
| Average edge multiplicity | m̃ = | 1.767 37
|
| Size of LCC | N = | 828,983
|
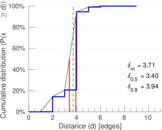
| Diameter | δ = | 11
|
| 50-Percentile effective diameter | δ0.5 = | 3.397 24
|
| 90-Percentile effective diameter | δ0.9 = | 3.938 07
|
| Median distance | δM = | 4
|
| Mean distance | δm = | 3.714 19
|
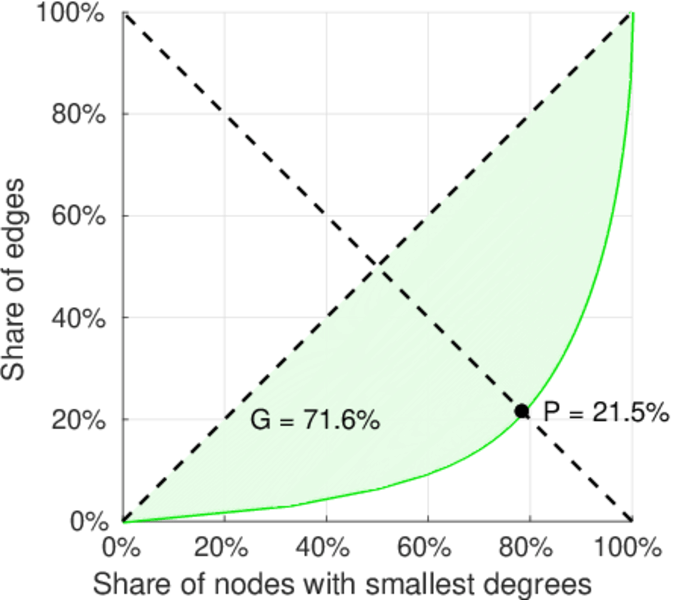
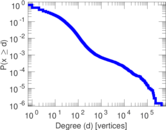
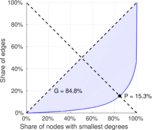
| Gini coefficient | G = | 0.850 312
|
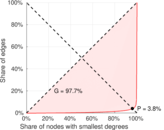
| Balanced inequality ratio | P = | 0.151 939
|
| Left balanced inequality ratio | P1 = | 0.038 395 8
|
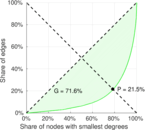
| Right balanced inequality ratio | P2 = | 0.214 870
|
| Relative edge distribution entropy | Her = | 0.730 526
|
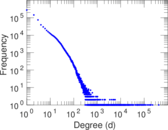
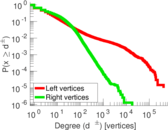
| Power law exponent | γ = | 2.025 61
|
| Tail power law exponent | γt = | 2.821 00
|
| Degree assortativity | ρ = | −0.128 137
|
| Degree assortativity p-value | pρ = | 0.000 00
|
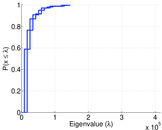
| Spectral norm | α = | 18,922.0
|
| Algebraic connectivity | a = | 0.068 146 0
|
| Spectral separation | |λ1[A] / λ2[A]| = | 3.298 04
|
| Controllability | C = | 730,862
|
| Relative controllability | Cr = | 0.875 757
|
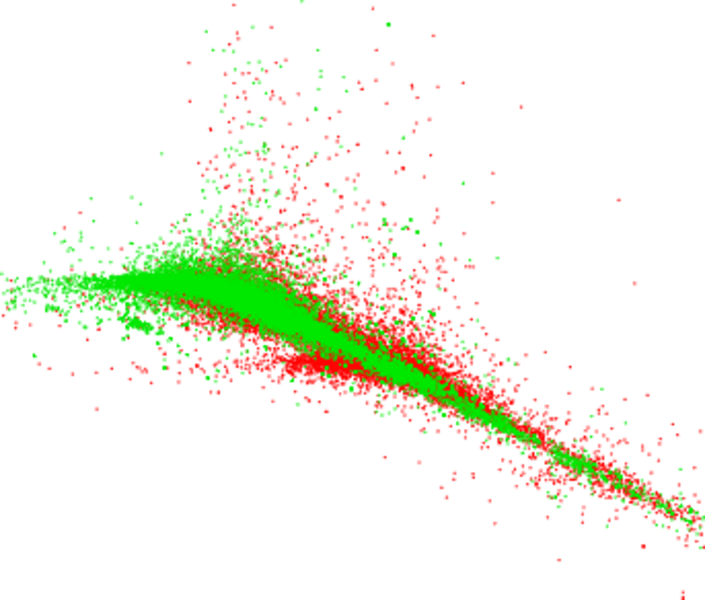
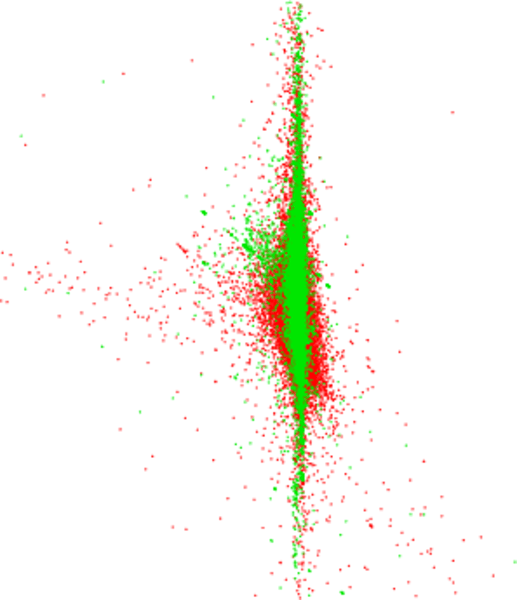
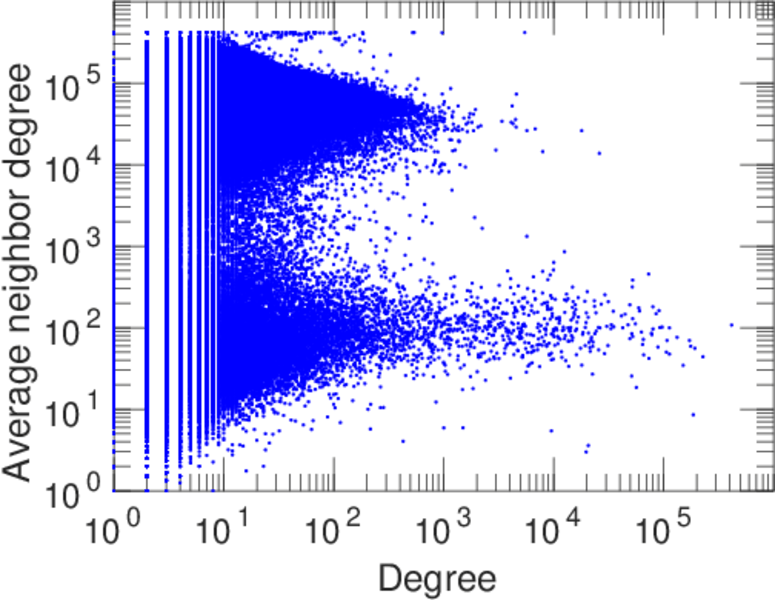
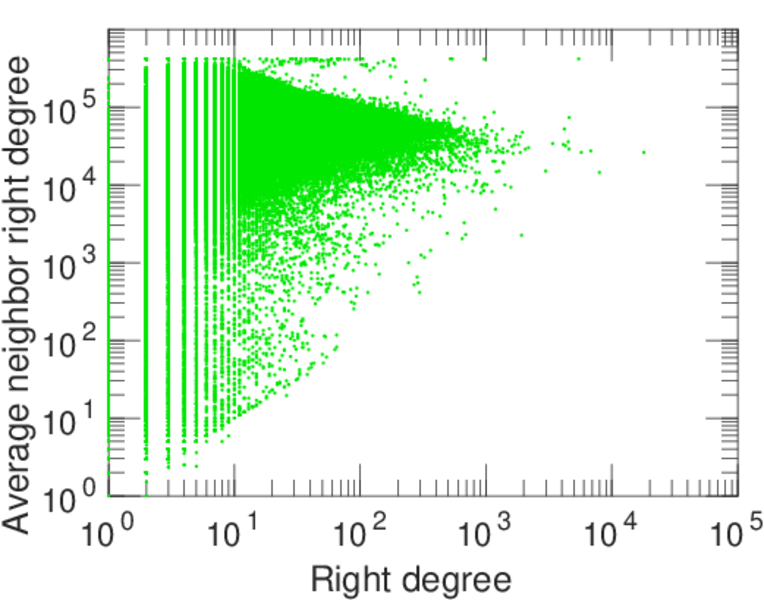
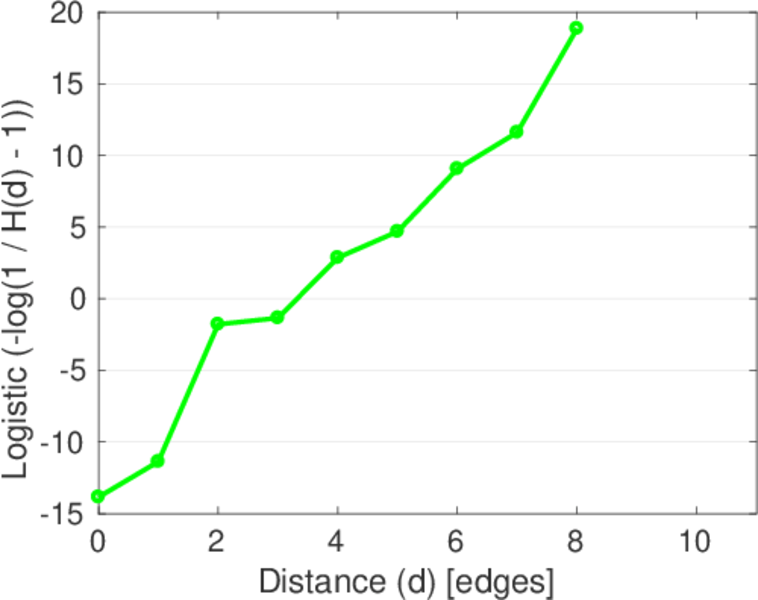
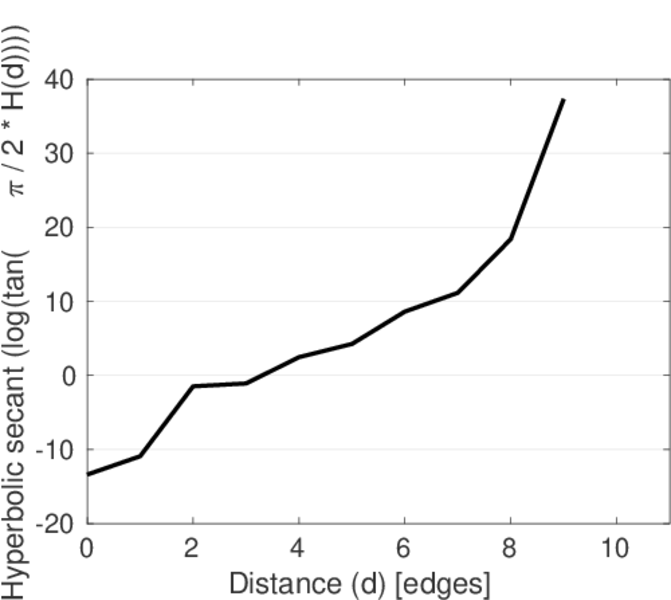
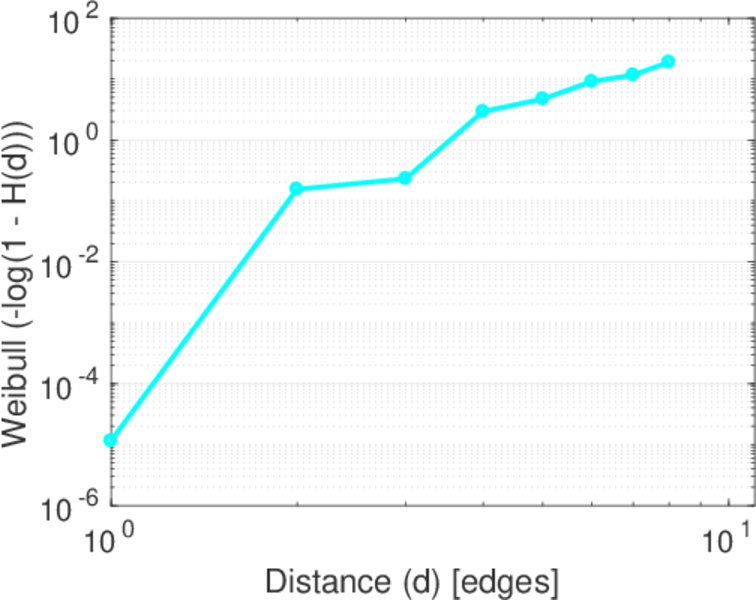
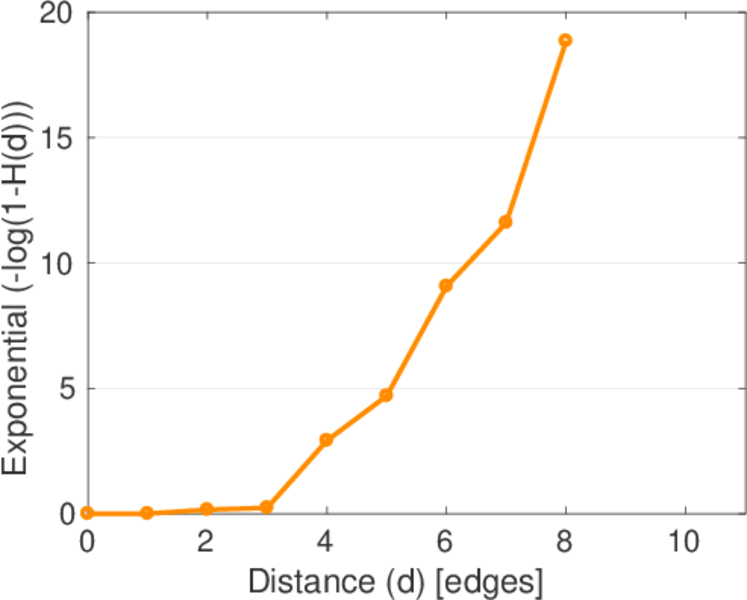
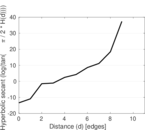
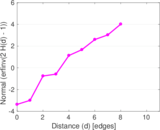
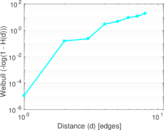
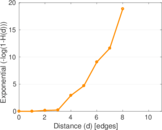
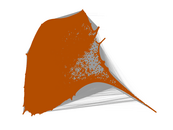
Plots


Downloads
References
|
[1]
|
Jérôme Kunegis.
KONECT – The Koblenz Network Collection.
In Proc. Int. Conf. on World Wide Web Companion, pages
1343–1350, 2013.
[ http ]
|
|
[2]
|
Wikimedia Foundation.
Wikimedia downloads.
http://dumps.wikimedia.org/, January 2010.
|
 KONECT ‣ Networks ‣
Buy Me a Coffee
KONECT ‣ Networks ‣
Buy Me a Coffee