Wikipedia edits (eo)
This is the bipartite edit network of the Esperanto Wikipedia. It contains
users and pages from the Esperanto Wikipedia, connected by edit events. Each
edge represents an edit. The dataset includes the timestamp of each edit.
Metadata
Statistics
| Size | n = | 542,626
|
| Left size | n1 = | 15,511
|
| Right size | n2 = | 527,115
|
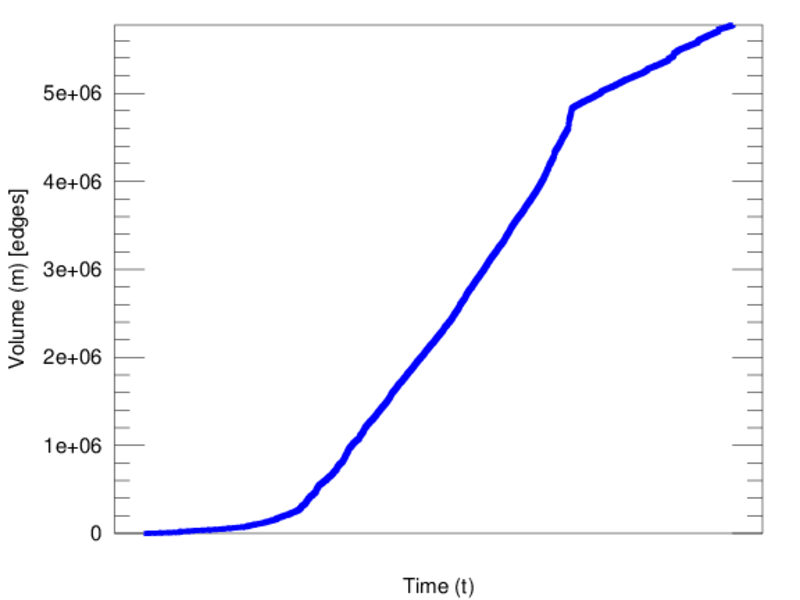
| Volume | m = | 5,775,209
|
| Unique edge count | m̿ = | 3,149,617
|
| Wedge count | s = | 73,120,114,823
|
| Cross count | x = | 7.187 48 × 1019
|
| Square count | q = | 145,789,683,927
|
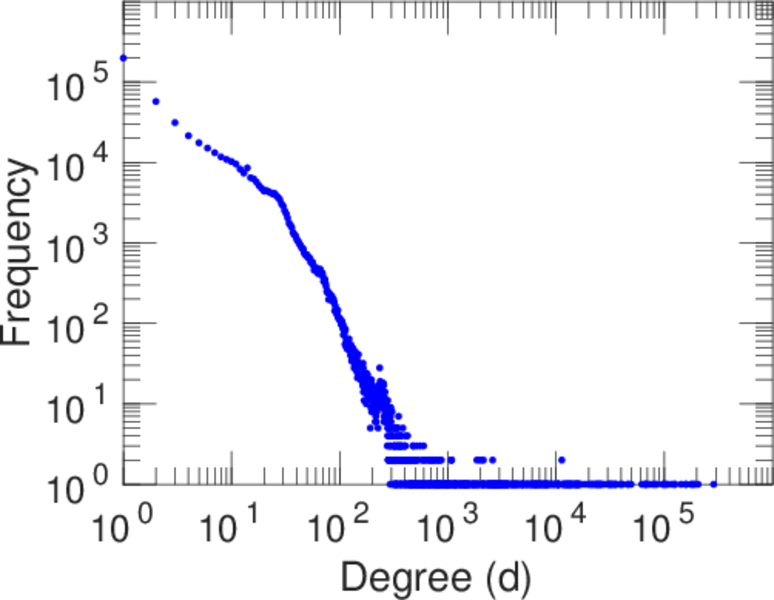
| Maximum degree | dmax = | 286,394
|
| Maximum left degree | d1max = | 286,394
|
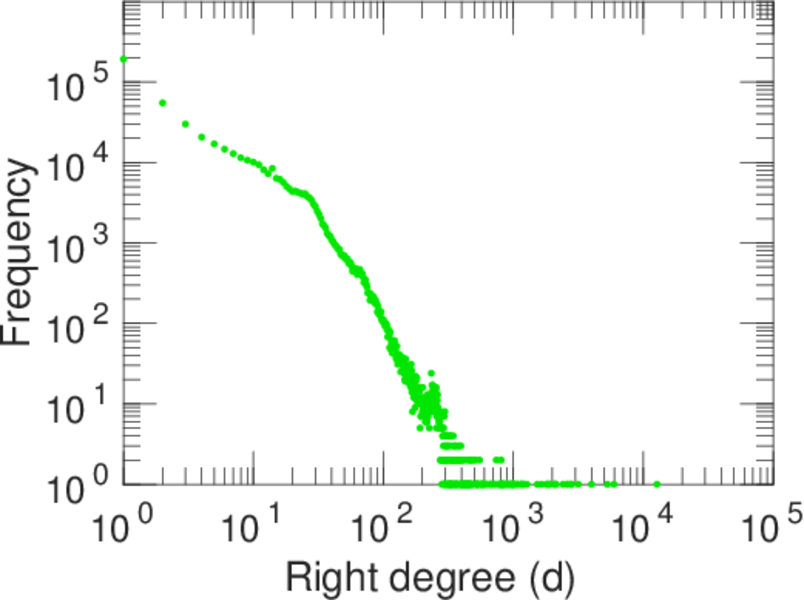
| Maximum right degree | d2max = | 12,775
|
| Average degree | d = | 21.286 1
|
| Average left degree | d1 = | 372.330
|
| Average right degree | d2 = | 10.956 3
|
| Fill | p = | 0.000 385 223
|
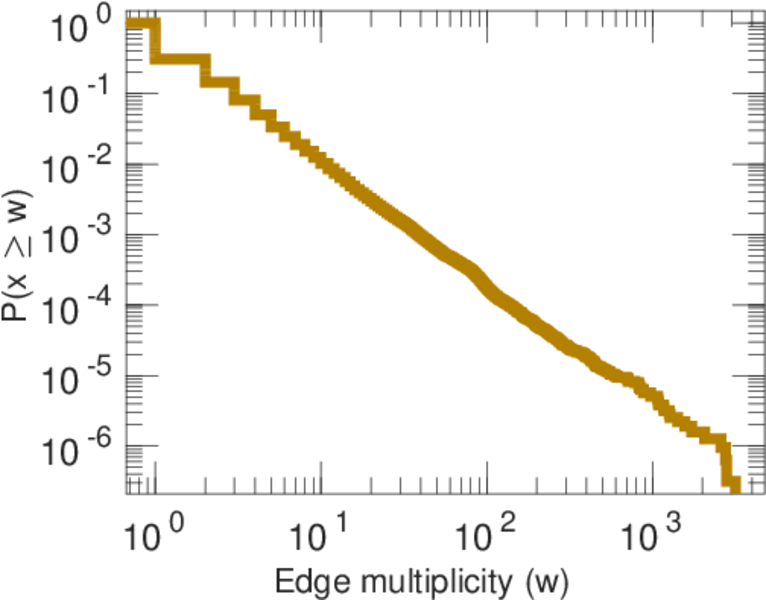
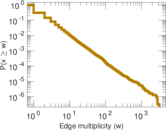
| Average edge multiplicity | m̃ = | 1.833 62
|
| Size of LCC | N = | 536,474
|
| Diameter | δ = | 11
|
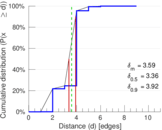
| 50-Percentile effective diameter | δ0.5 = | 3.357 97
|
| 90-Percentile effective diameter | δ0.9 = | 3.921 76
|
| Median distance | δM = | 4
|
| Mean distance | δm = | 3.586 41
|
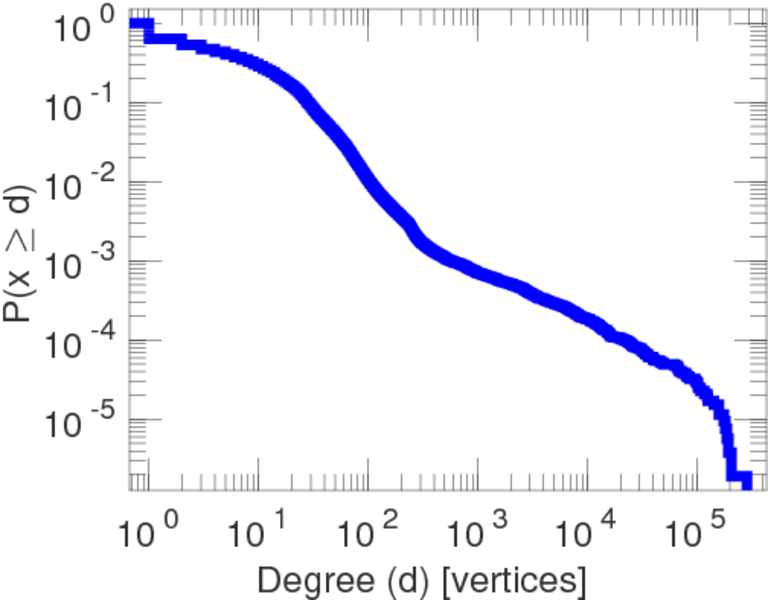
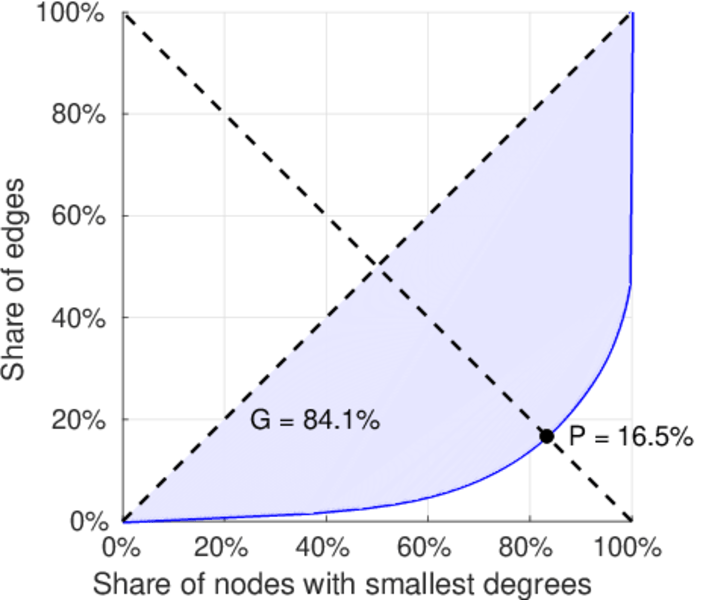
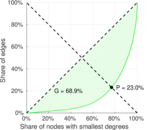
| Gini coefficient | G = | 0.842 336
|
| Balanced inequality ratio | P = | 0.164 345
|
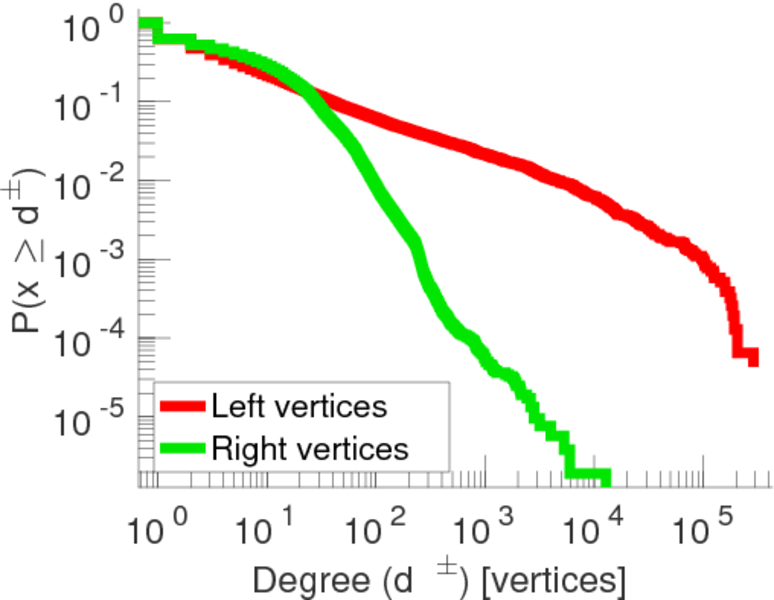
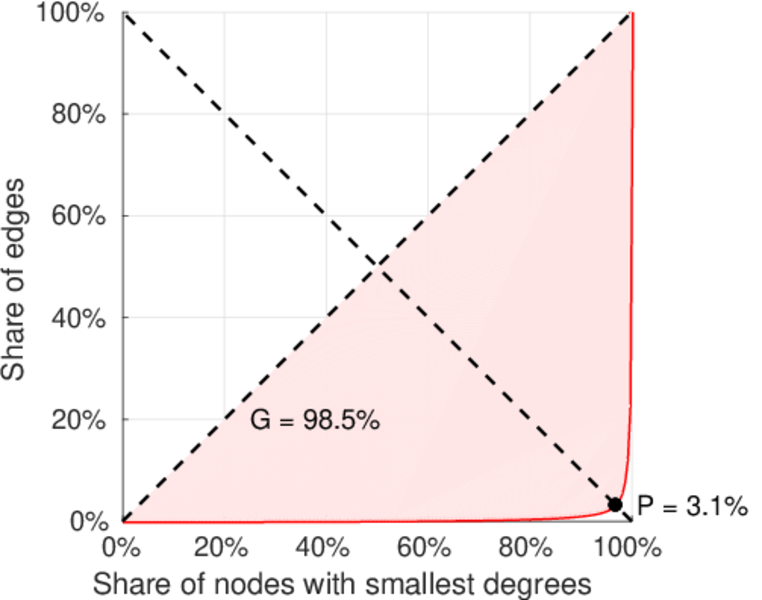
| Left balanced inequality ratio | P1 = | 0.030 813 9
|
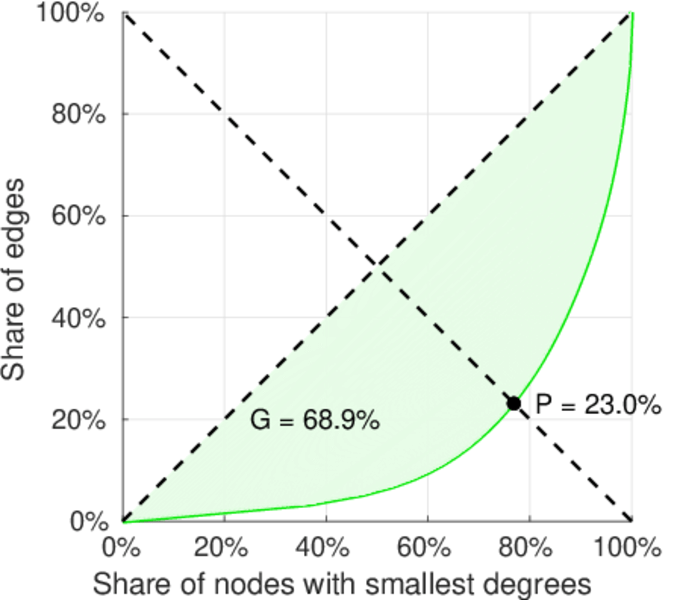
| Right balanced inequality ratio | P2 = | 0.229 648
|
| Relative edge distribution entropy | Her = | 0.718 542
|
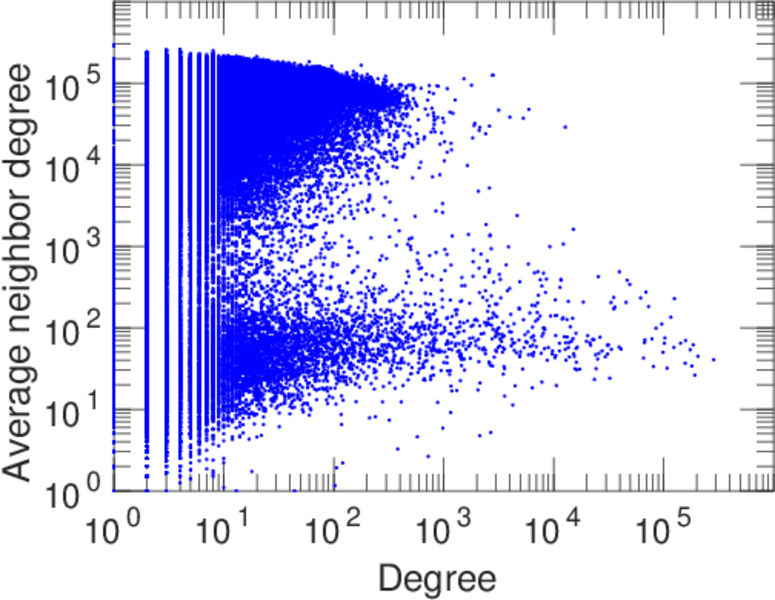
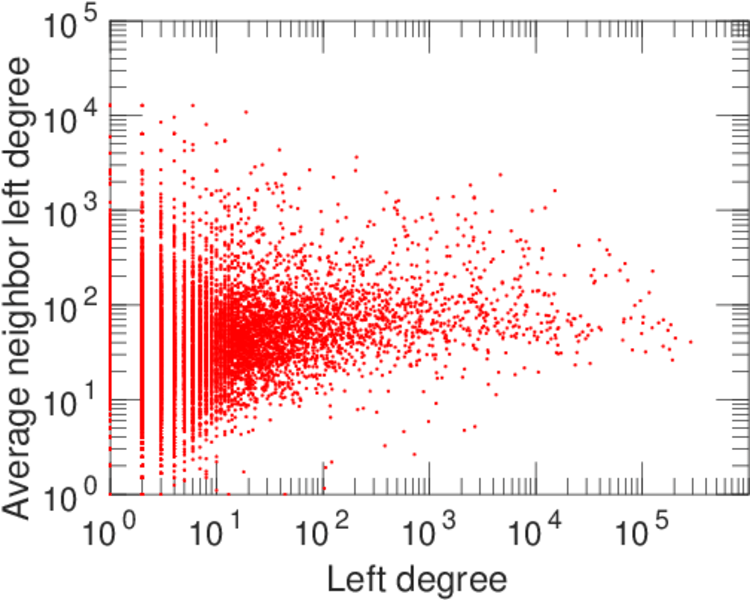
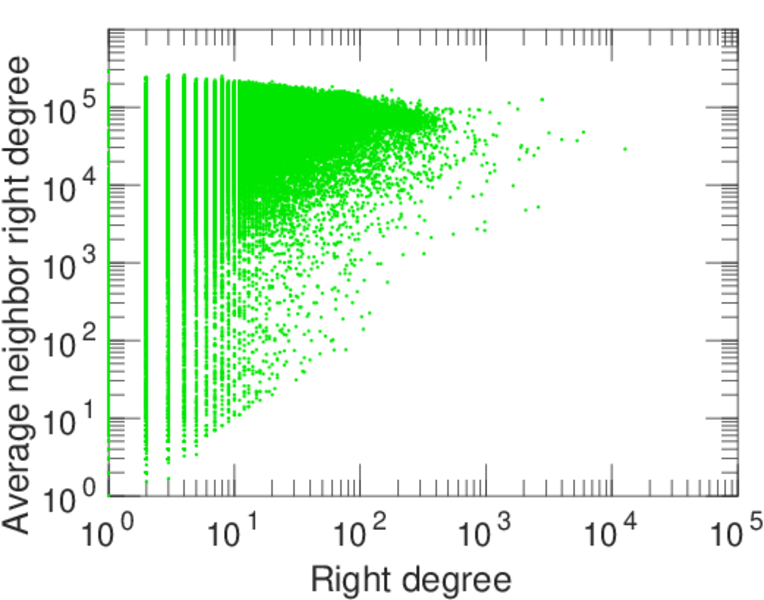
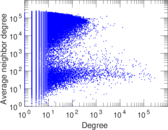
| Degree assortativity | ρ = | −0.138 637
|
| Degree assortativity p-value | pρ = | 0.000 00
|
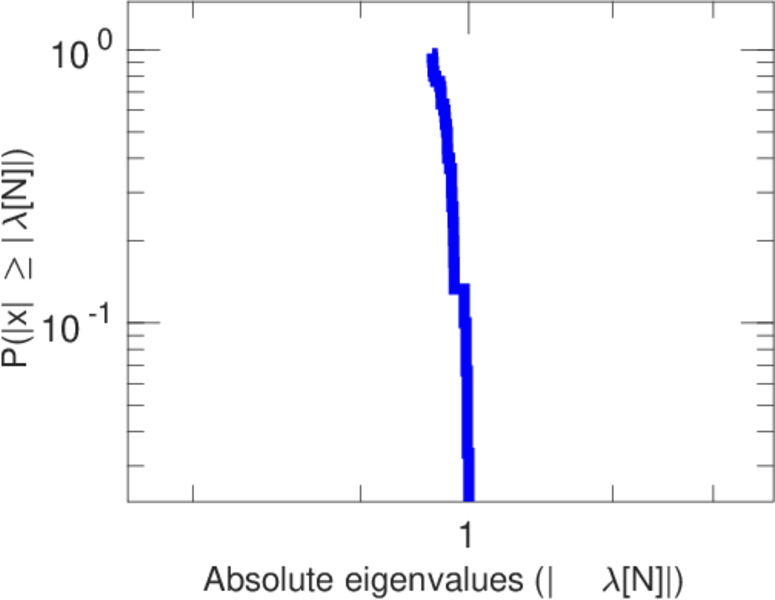
| Spectral norm | α = | 4,382.43
|
| Algebraic connectivity | a = | 0.007 888 56
|
| Spectral separation | |λ1[A] / λ2[A]| = | 1.308 43
|
| Controllability | C = | 508,722
|
| Relative controllability | Cr = | 0.944 969
|
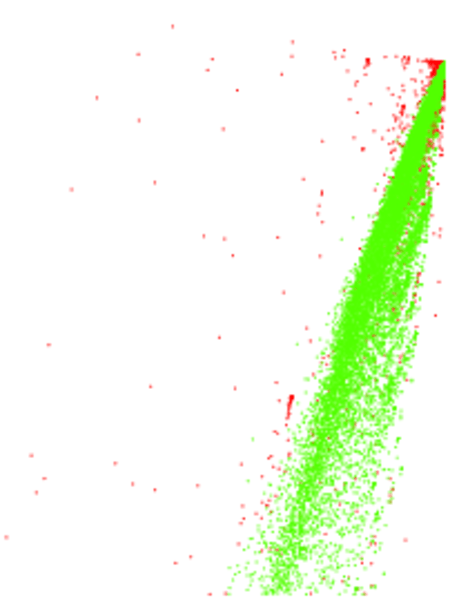
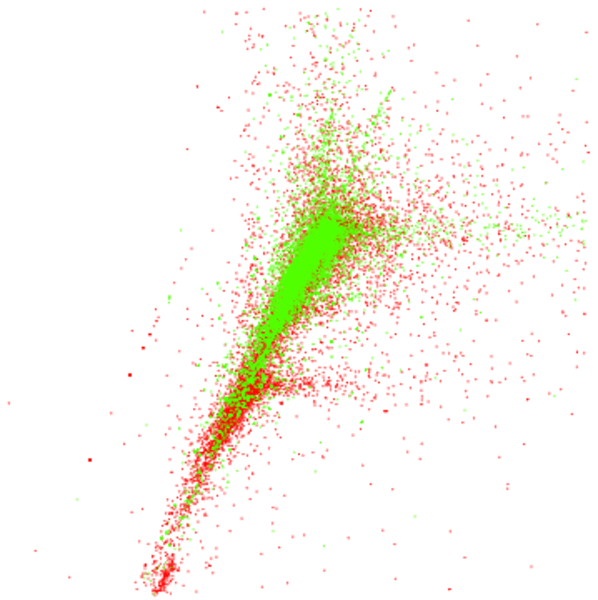
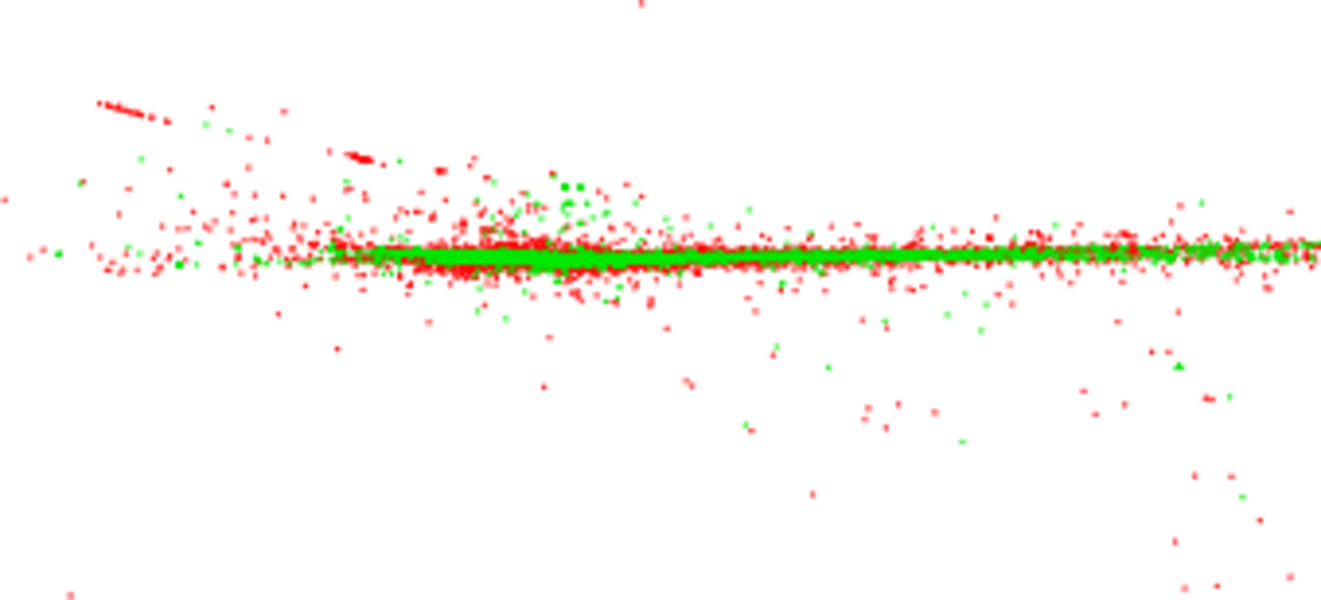
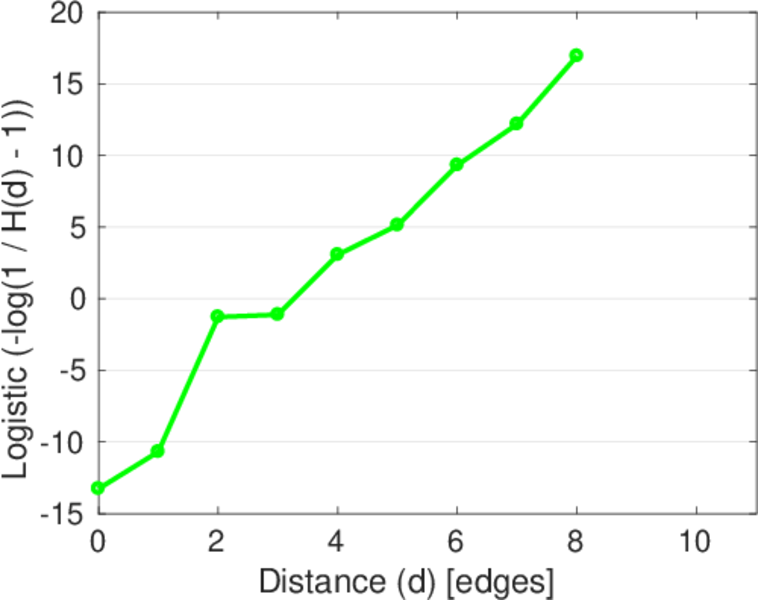
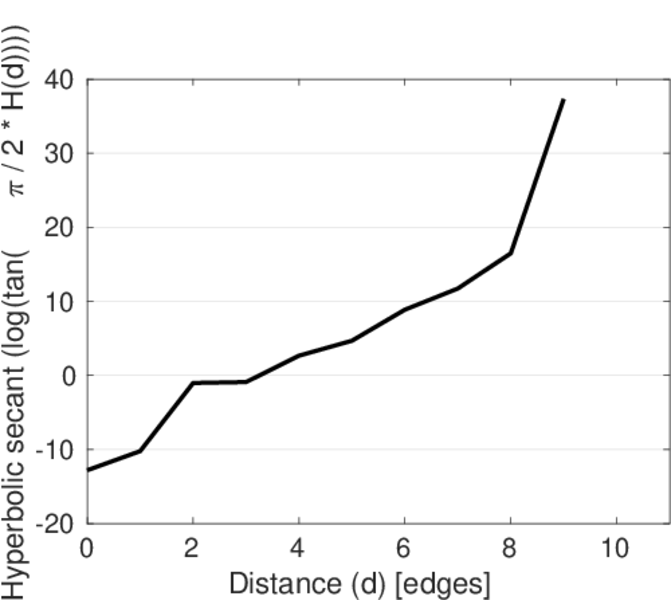
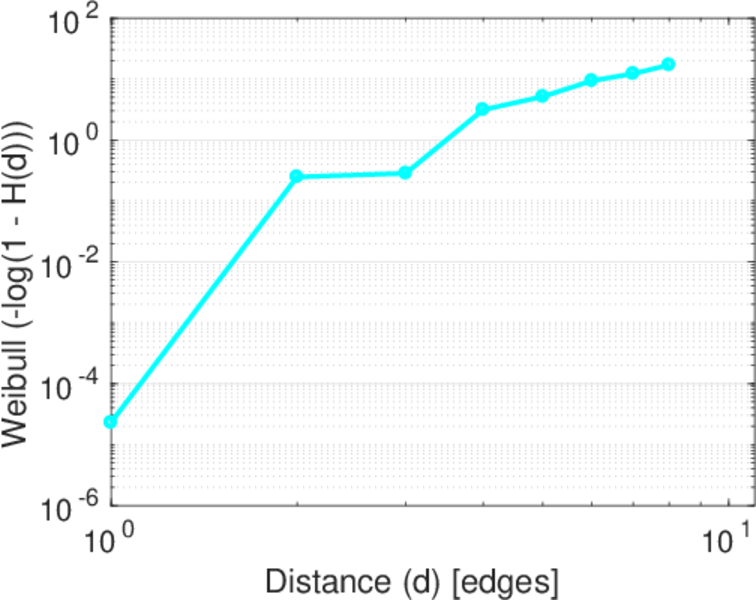
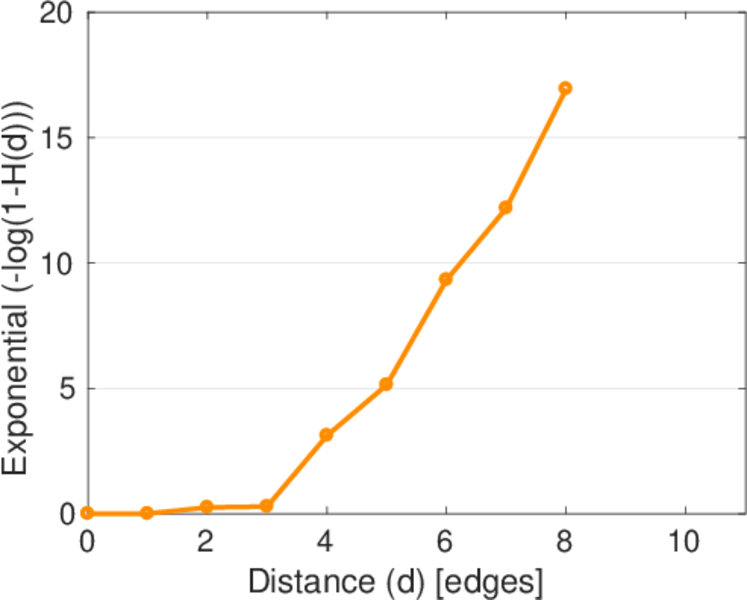
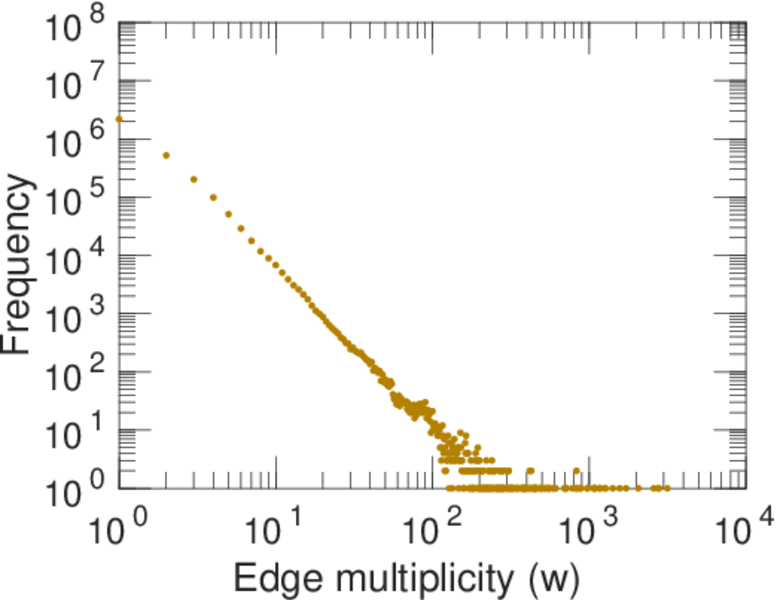
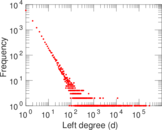
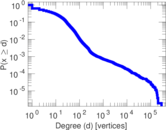
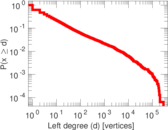
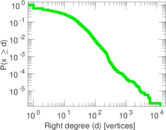
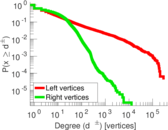
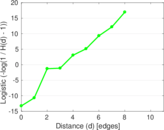
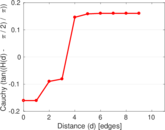
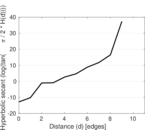
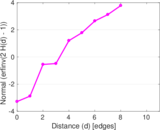
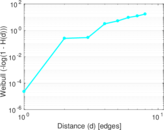
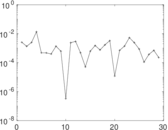
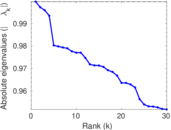
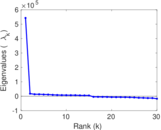
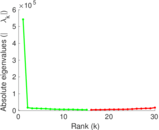
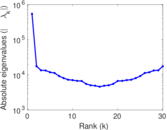
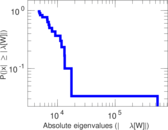
Plots


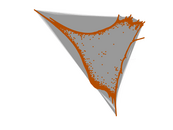


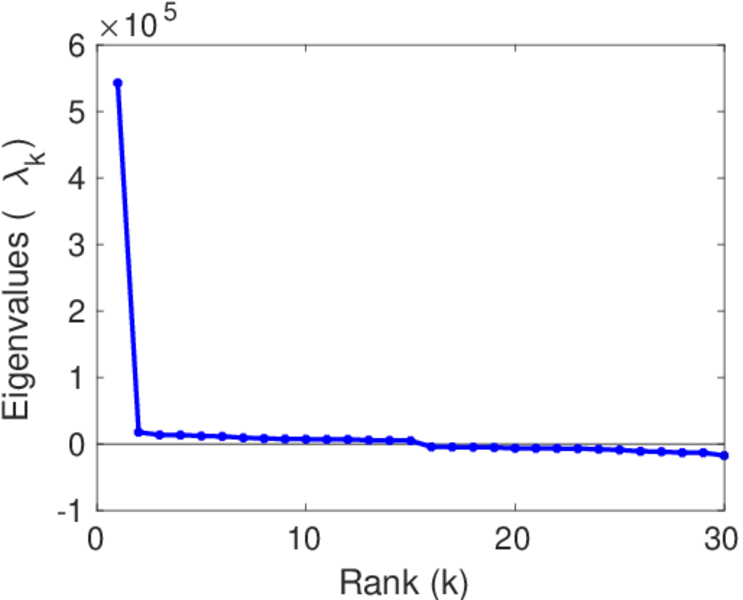
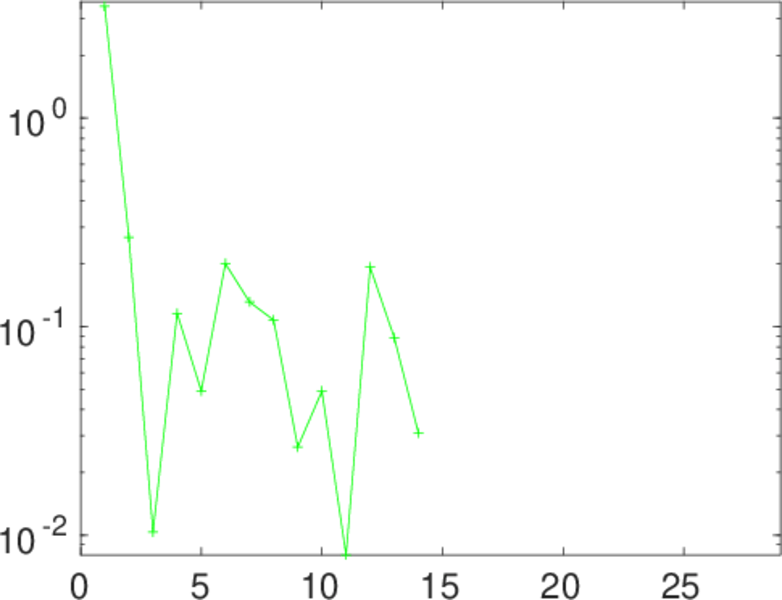
Matrix decompositions plots


Downloads
References
|
[1]
|
Jérôme Kunegis.
KONECT – The Koblenz Network Collection.
In Proc. Int. Conf. on World Wide Web Companion, pages
1343–1350, 2013.
[ http ]
|
|
[2]
|
Wikimedia Foundation.
Wikimedia downloads.
http://dumps.wikimedia.org/, January 2010.
|
 KONECT ‣ Networks ‣
Buy Me a Coffee
KONECT ‣ Networks ‣
Buy Me a Coffee