Wiktionary edits (es)
This is the bipartite edit network of the Spanish Wiktionary. It contains users
and pages from the Spanish Wiktionary, connected by edit events. Each edge
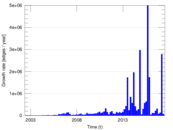
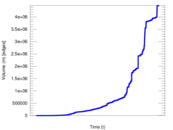
represents an edit. The dataset includes the timestamp of each edit.
Metadata
Statistics
| Size | n = | 901,301
|
| Left size | n1 = | 5,759
|
| Right size | n2 = | 895,542
|
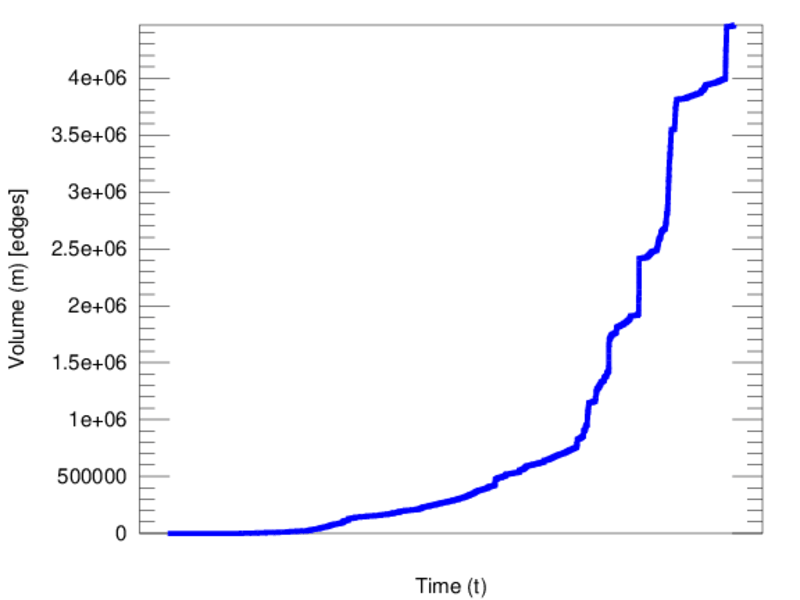
| Volume | m = | 4,467,056
|
| Unique edge count | m̿ = | 2,865,051
|
| Wedge count | s = | 766,133,270,561
|
| Claw count | z = | 190,780,498,162,887,968
|
| Cross count | x = | 3.711 65 × 1022
|
| Maximum degree | dmax = | 1,297,482
|
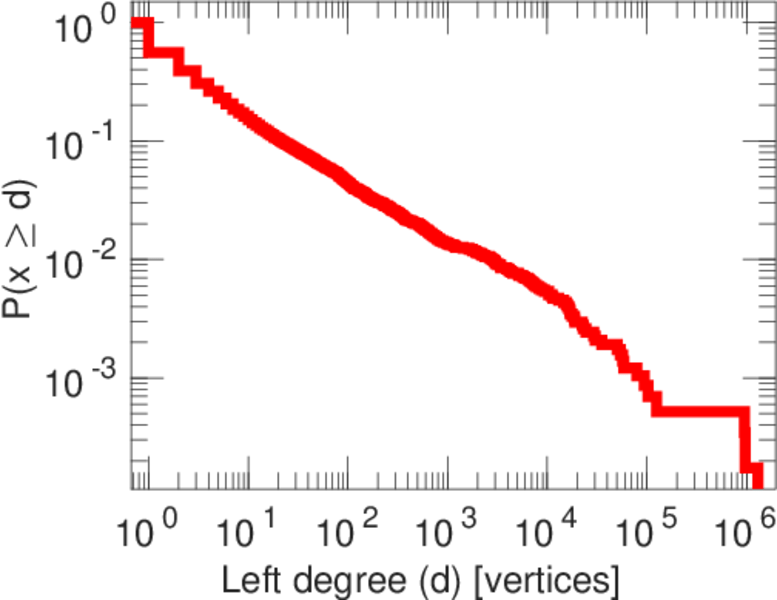
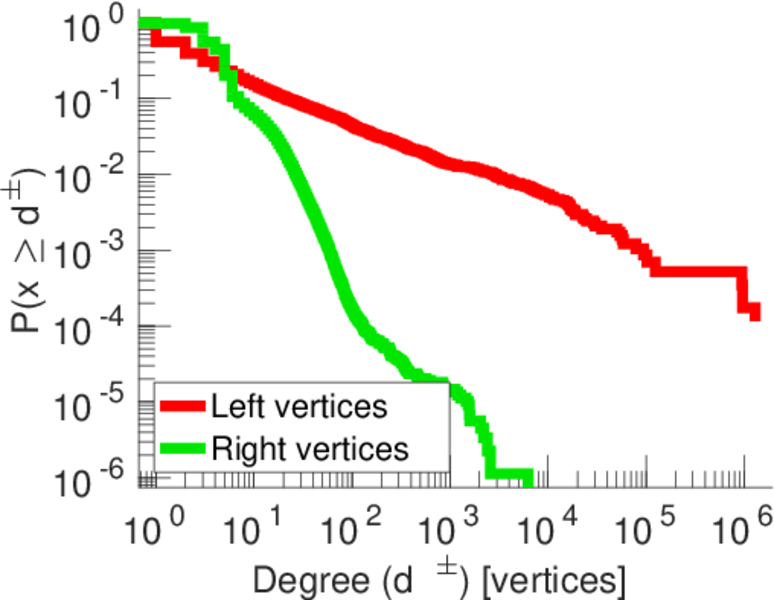
| Maximum left degree | d1max = | 1,297,482
|
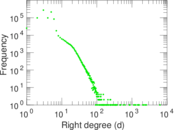
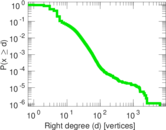
| Maximum right degree | d2max = | 6,288
|
| Average degree | d = | 9.912 46
|
| Average left degree | d1 = | 775.665
|
| Average right degree | d2 = | 4.988 10
|
| Fill | p = | 0.000 555 520
|
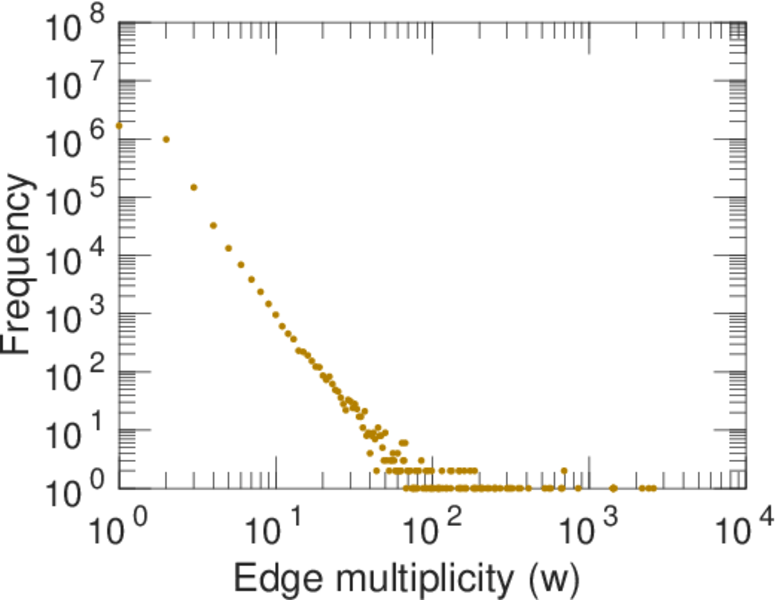
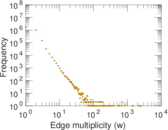
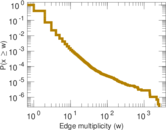
| Average edge multiplicity | m̃ = | 1.559 15
|
| Size of LCC | N = | 893,499
|
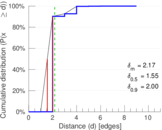
| Diameter | δ = | 12
|
| 50-Percentile effective diameter | δ0.5 = | 1.553 83
|
| 90-Percentile effective diameter | δ0.9 = | 1.996 89
|
| Median distance | δM = | 2
|
| Mean distance | δm = | 2.173 71
|
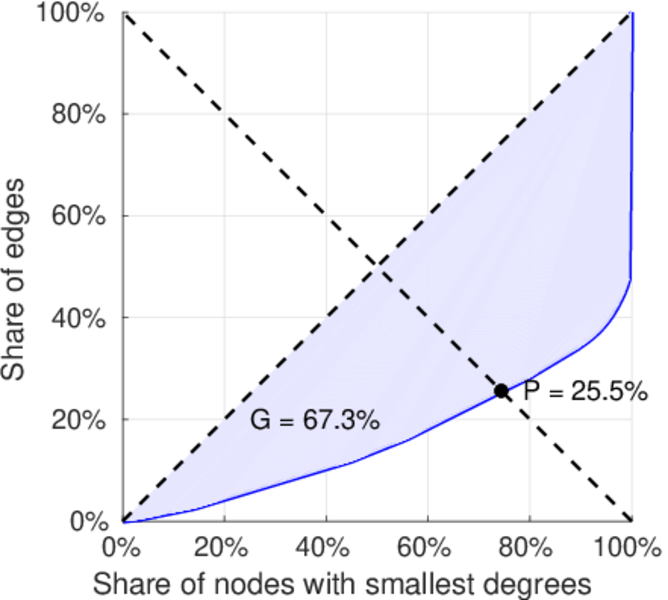
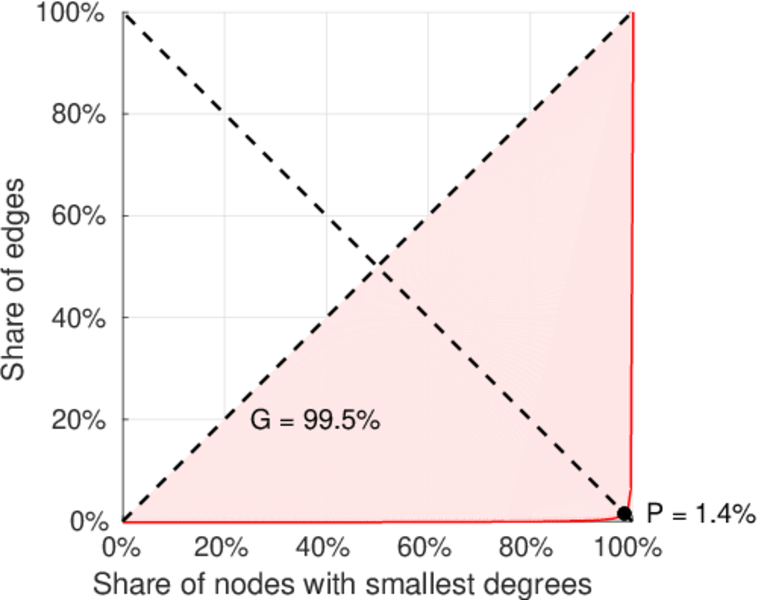
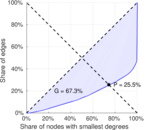
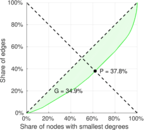
| Balanced inequality ratio | P = | 0.254 452
|
| Left balanced inequality ratio | P1 = | 0.013 604 5
|
| Right balanced inequality ratio | P2 = | 0.378 356
|
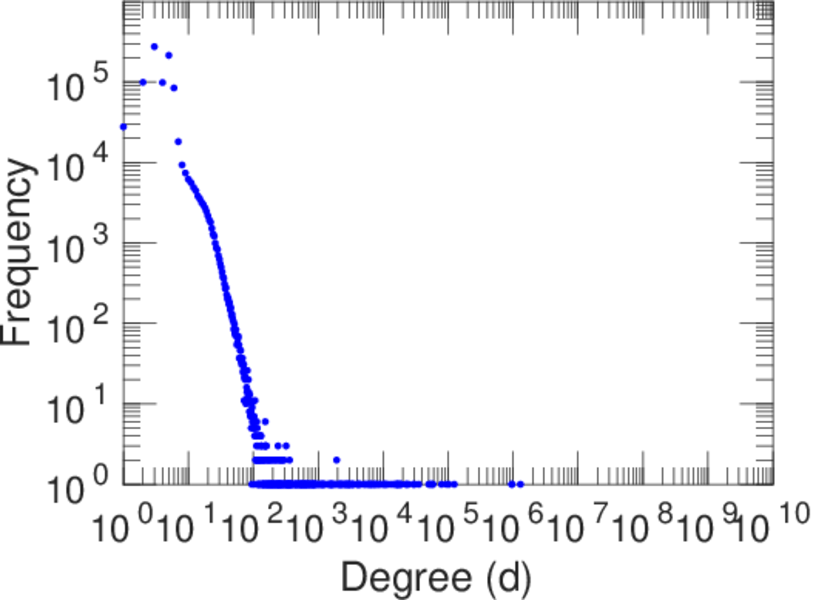
| Power law exponent | γ = | 1.973 78
|
| Tail power law exponent | γt = | 3.831 00
|
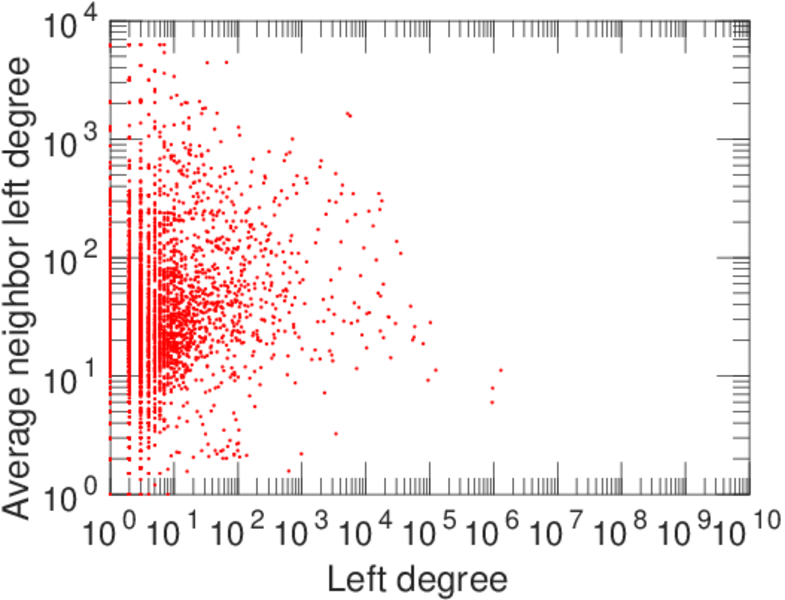
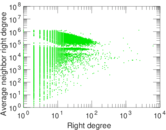
| Degree assortativity | ρ = | −0.440 710
|
| Degree assortativity p-value | pρ = | 0.000 00
|
| Spectral norm | α = | 3,004.23
|
| Spectral separation | |λ1[A] / λ2[A]| = | 1.048 15
|
| Controllability | C = | 885,008
|
| Relative controllability | Cr = | 0.989 386
|
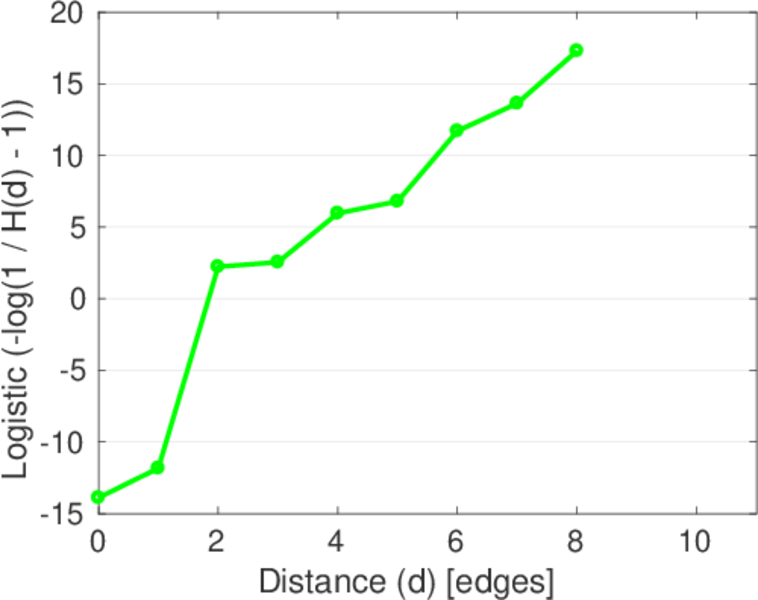
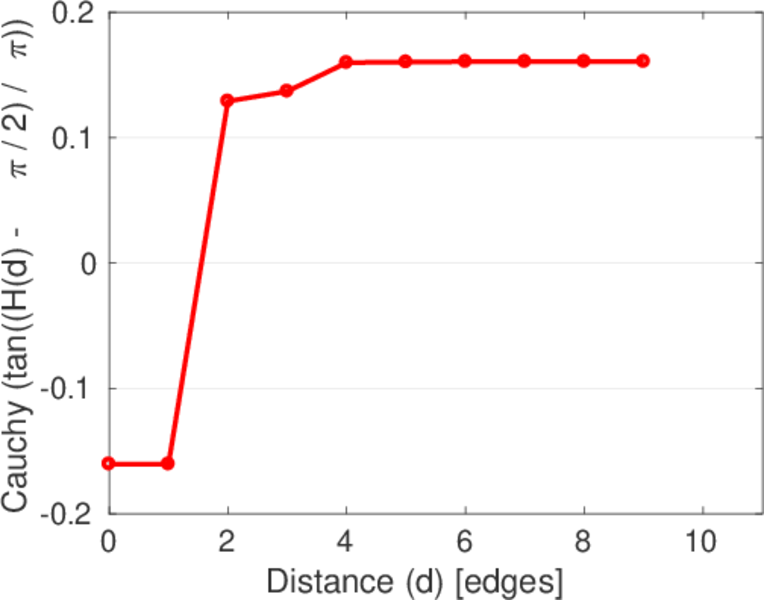
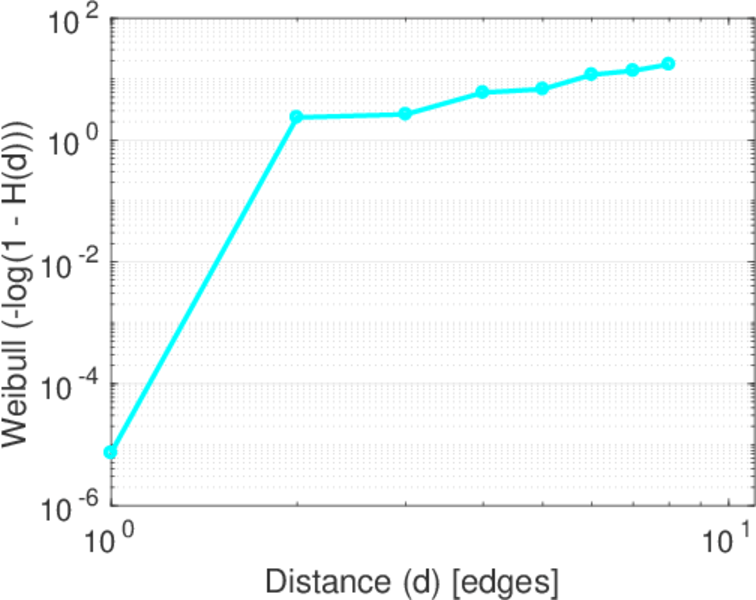
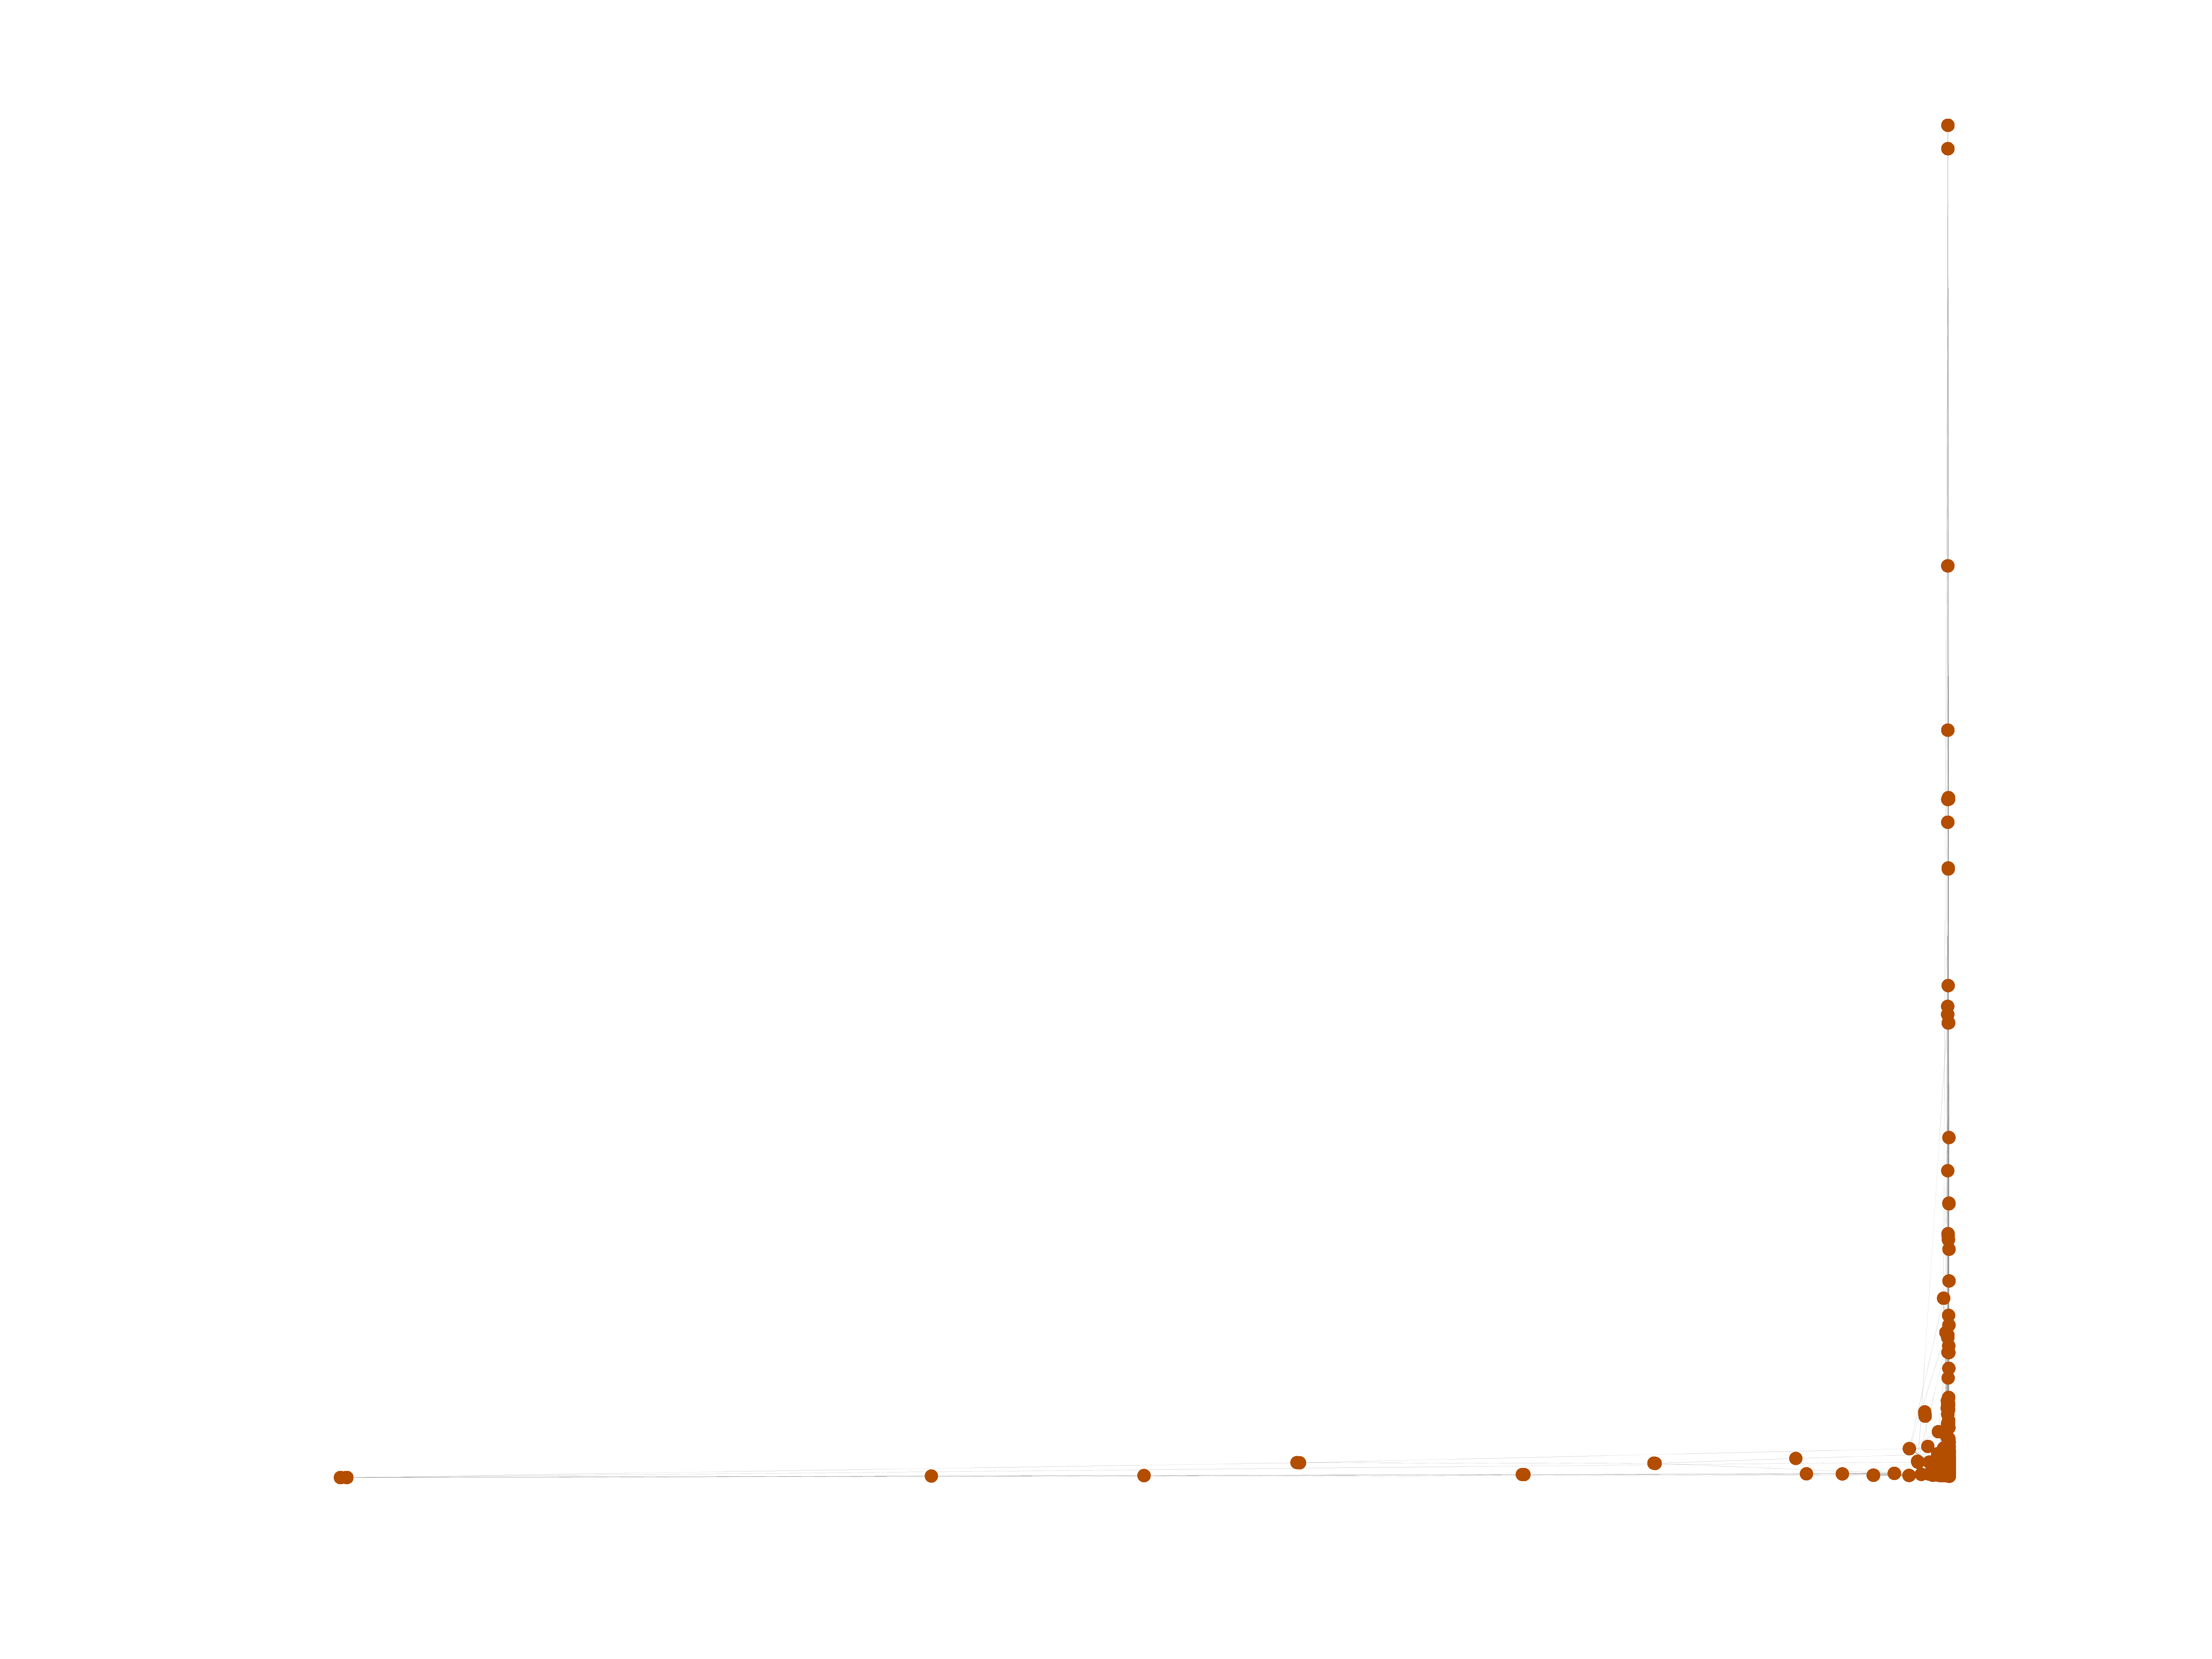
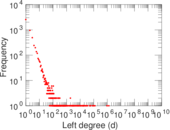
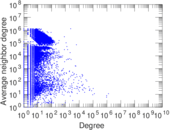
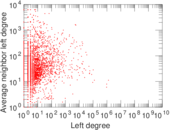
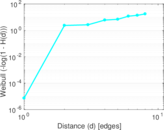
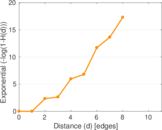
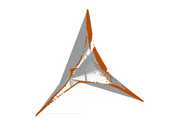
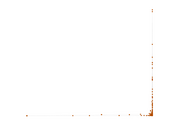
Plots


Downloads
References
|
[1]
|
Jérôme Kunegis.
KONECT – The Koblenz Network Collection.
In Proc. Int. Conf. on World Wide Web Companion, pages
1343–1350, 2013.
[ http ]
|
|
[2]
|
Wikimedia Foundation.
Wikimedia downloads.
http://dumps.wikimedia.org/, January 2010.
|
 KONECT ‣ Networks ‣
Buy Me a Coffee
KONECT ‣ Networks ‣
Buy Me a Coffee